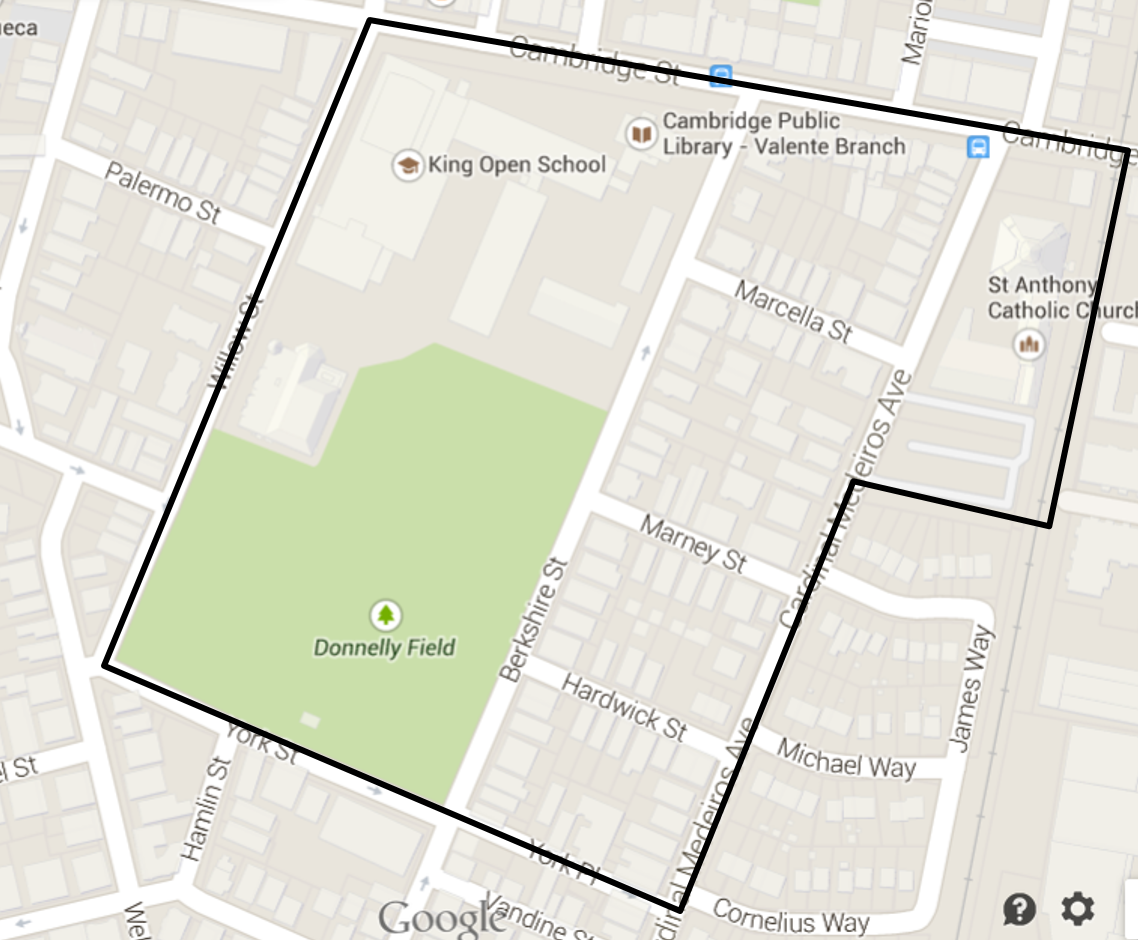
 Figure 1: Map of my site, image from Google Maps, 2015
The society in which we live is shaped by many invisible factors from the past. This applies not only to the customs and expectations that we have, but also to the shapes of our cities. We can get a sense of how communities developed over time by examining history: both the history of the specific locations as well as the context surrounding the area. This can be applied to the specific case of the site outlined on the modern-day map in Figure 1 which has undergone many dramatic changes over the past two centuries. In these year, the area has changed from swampland, to a country estate, to industrial sites, to the residential neighborhood of today. Historical maps show these changes, but Kenneth Jackson’s The Crabgrass Frontier helps put these changes in context. Drawing on these sources, the overall picture becomes clearer. Though many factors affected the development of this neighborhood, the dominant form of transportation of the time was the primary factor in how the site developed.
Slow Initial Development
By the 1830s, the city of Cambridge had developed enough to give a good idea of where the site was be relative to the streets that have lasted to modern times. As can be seen in Figure 2, as of 1830, there was nothing but swampland and marsh in the area. This made the land less desirable, since there was still plenty of space in Cambridge and Boston to build without filling in the swamps in this location. After all, with the primary methods of transportation being travel by foot or by boat, it is no wonder that there was little motivation to develop an area far from the coast and outside of a comfortable walking distance from any central area. As Jackson says, “The . . . important characteristic of the walking city was the tendency of the most fashionable and respectable addresses to be located close to the center of town” (location 351). There really was little motivation to move into the area and develop it. The site was essentially “country” land, farther than even the suburbs of East Cambridge.
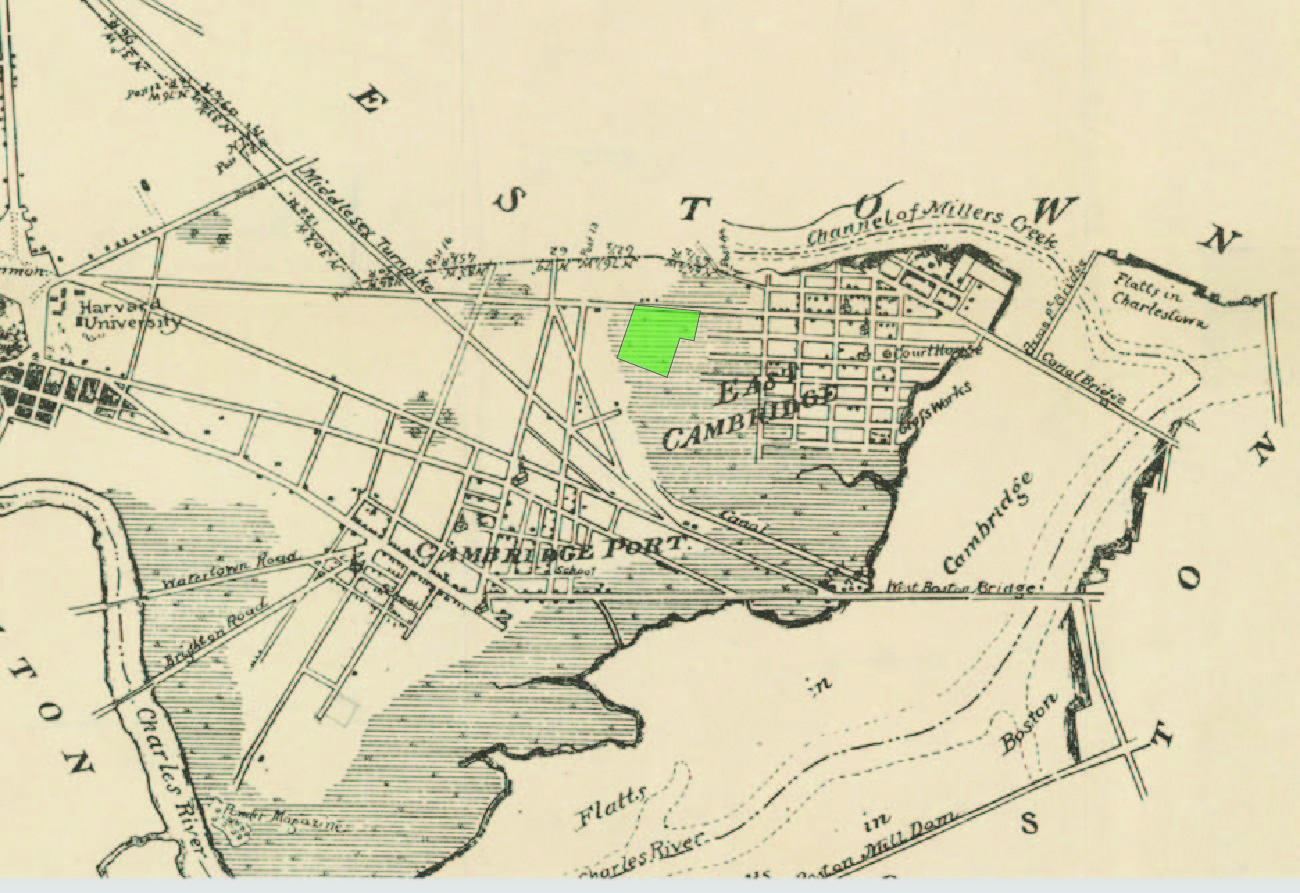 Figure 2: My site was originally swampland, an undeveloped area between East Cambridge and Harvard Square. 1830s map by John Hales.
First Development of Industry
Unexpectedly, it was water transportation that first made this site more connected to the rest of the city and the world. As land filling occurred in Boston, it appears that the same happened on this site in Cambridge. By 1857, some streets started to move into the area, implying that the land was no longer swampy. However, after filling the majority of the land, a canal was constructed to connect this area to the Charles River and the harbor beyond that. A railroad was also constructed through the area, but, as can be seen in better detail on the 1873 Bromley map in figure 4, there were no spurs leading off of it in the area,. As a result, it appears that the canal was more significant to the area at first.
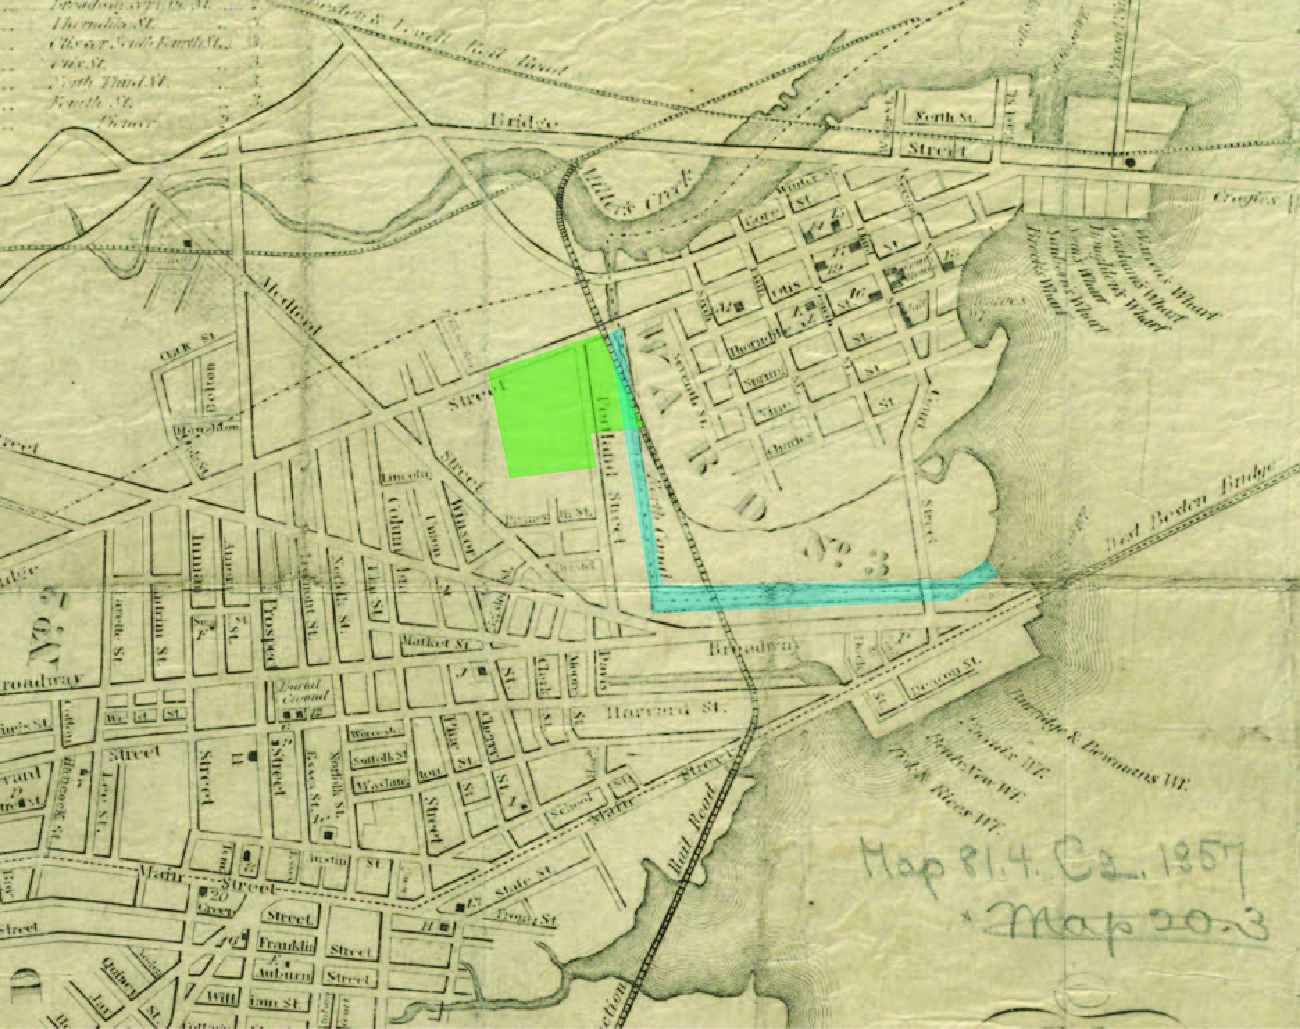 Figure 3:This 1857 map of Cambridge shows the first development of streets in the area. There is also a canal alongside to site connecting it to the Charles River. Map by W.A. Mason.
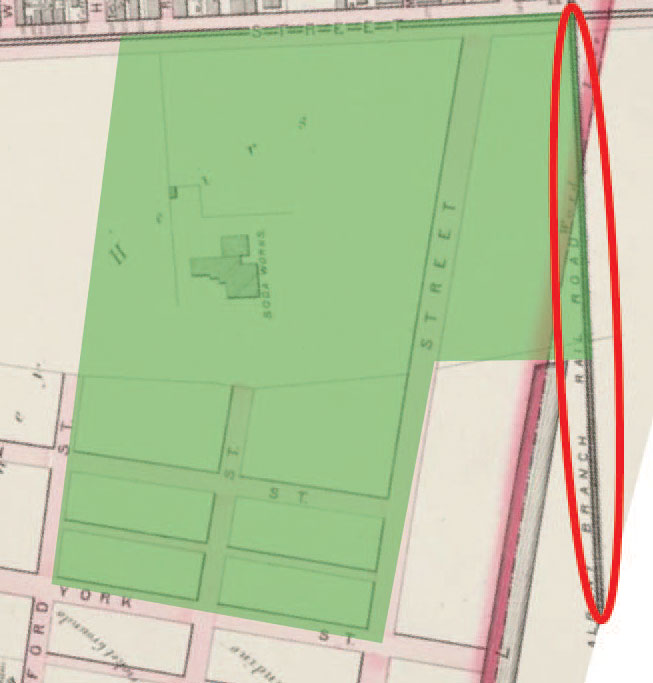 Figure 4:1873 map by Bromley shows that there are still no railroad spurs from the main track leading into my site. This implies that the nearby industry was not making use of the rail road yet.
The entire site, and most of the land surrounding it, was owned by the Binney family, as shown on the 1873 map. This kept the area mostly empty of residential development. Instead, the Binney family allowed a soda works factory to build on the land. With the large amount of still undeveloped land, and the connection to the sea via the canal, the area was ripe for industrial development to begin, especially with the great potential represented by the railroad line running nearby. With the transportation available at the time and the area controlled by one landowner, the site was best suited to industry. However, as is hinted at with the marks or streetcars along Cambridge Street on the 1873 map, transportation in the area was changing, pushing the area in a different direction.
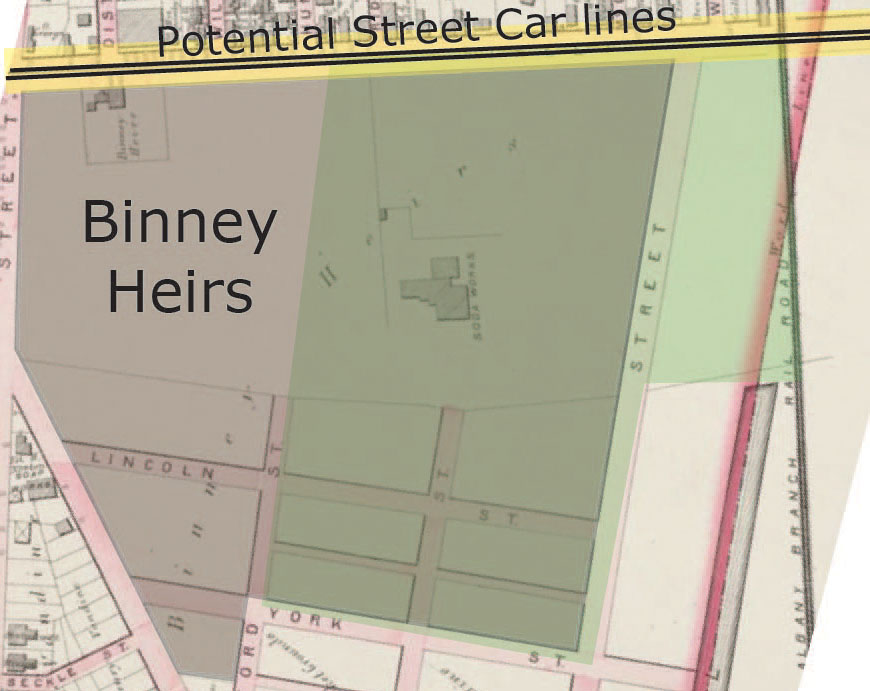 Figure 5:The Binney Family owned the majority of the land in my site as well as additional land to the west. Along the top of the map, on Cambridge St, there are signs of streetcar tracks running into Boston. 1873 Bromley Map.
Residential Development
With the construction of the railroad and canal, the potential for industry already existed; however, as the street car expanded and gained popularity, the push for residential development was strong when the division of the Binney family land occurred. Between the 1886 map and the 1894 map, the ownership of the site switched between the Binney heirs to what appears to be a number of different members of the Binney family as well as a few owners outside of the family. Perhaps the head of the family died, dividing the remaining land among the children.
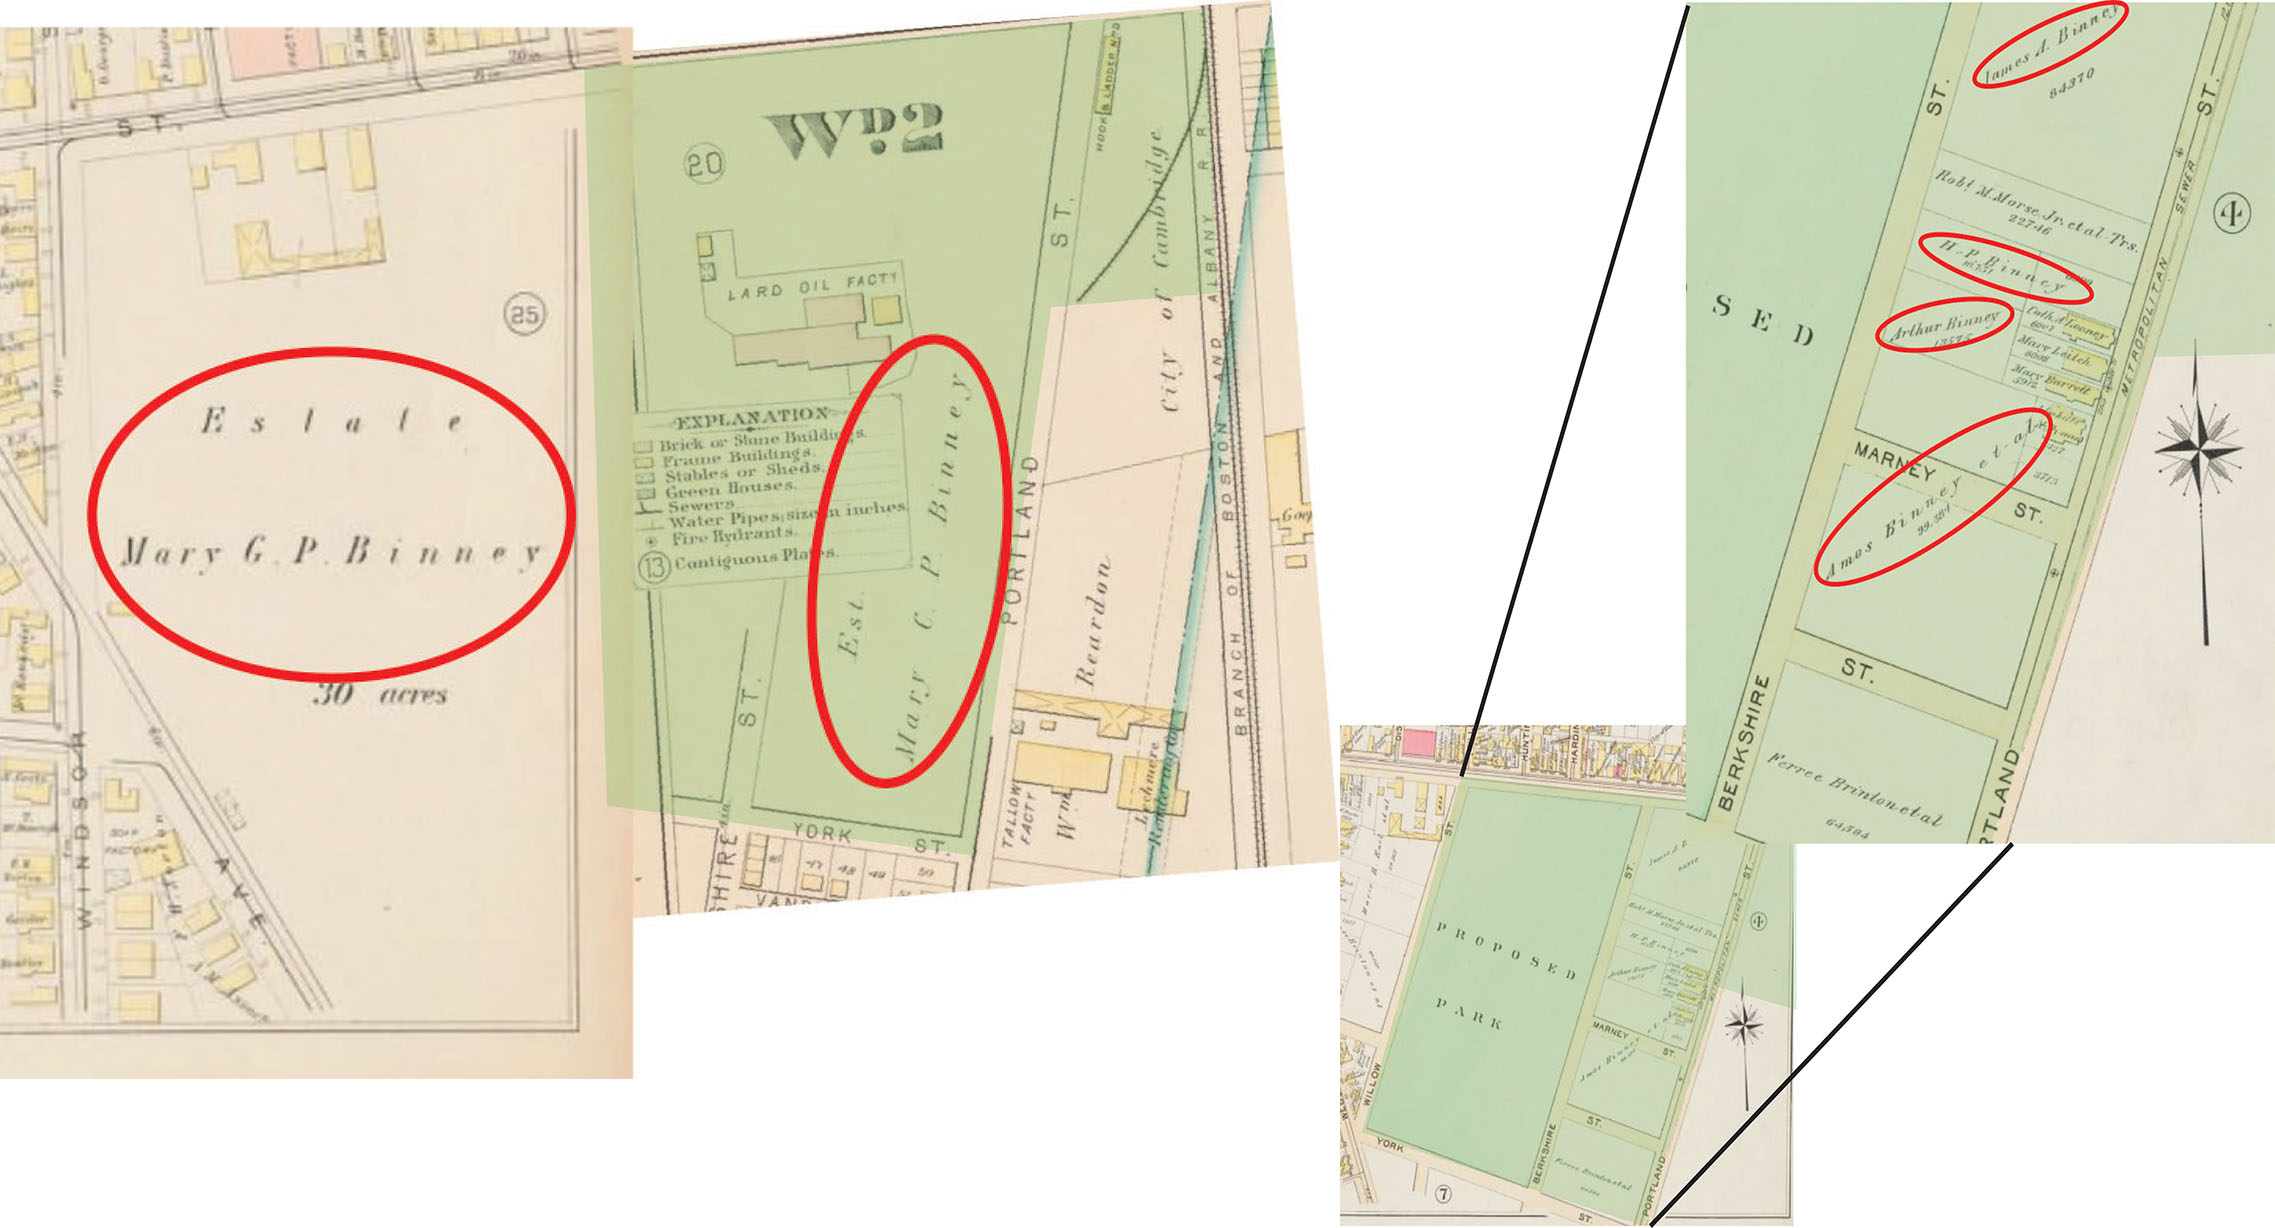 Figure 6: The 1886 Bromley map on the left shows that the land was owned soley by Mary G. P. Binney. In the 1894 Bromley map on the right, the land has been divided and 4 Binney family members still hold large portions of land.
Whatever the cause, the subdivision of the land resulted in dramatic changes. The factory to the east of Portland Street disappeared, replaced by smaller lots. On the land purchased by outside owners, residential houses popped up. This follows the trend of people moving out of the city and into the suburbs during this time. As Jackson says, “In Boston, . . . the horsecar lines tended to extend real-estate development” (location 800). Essentially, this movement away from the center of the city was enabled by the streetcar, or horsecar, system. Cambridge Street would have had a well-developed street car system as it is the road that runs into Boston via the Craigie Bridge (in the same location as the former Canal Bridge seen in Figure 2, Craigie Bridge appears in the upper right corner of Figure 3 as well). As a result, once the land was available for development, this site became a very popular building spot. Since the land was divided among many owners after the split-up of the Binney Estate, there was no cohesive development plan. Nevertheless, in the 6 years between 1894 and 1900, nearly all of the land was developed as residential housing.
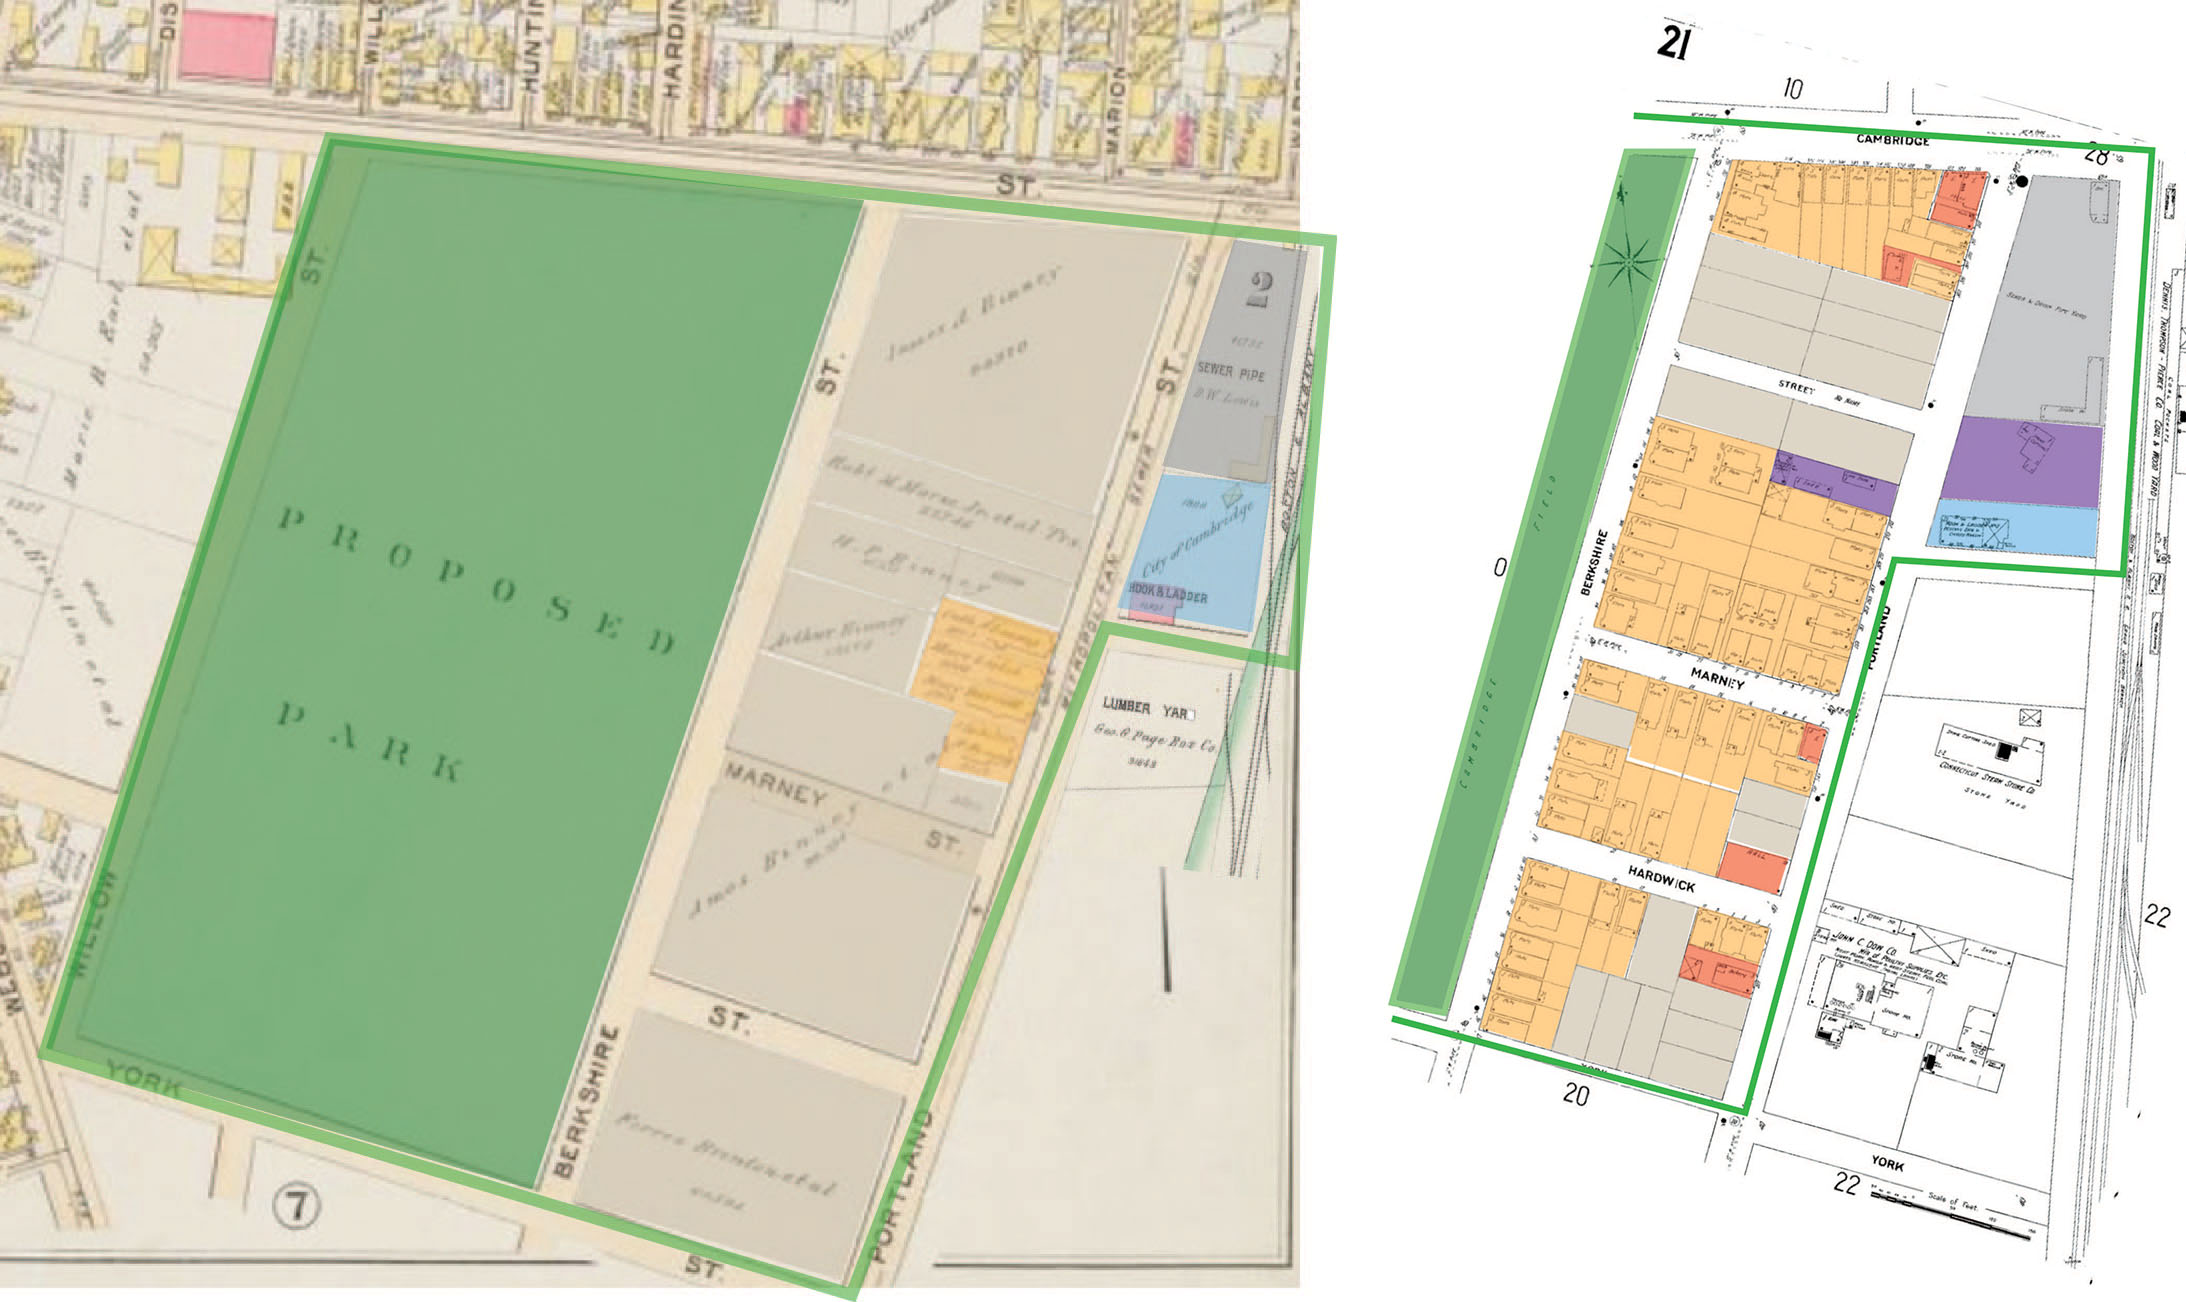 Figure 7: Between the 1894 Bromley map and the 1900 Sanborn map, much of the land was developed into residences.
No longer was this location remote and empty, instead the streetcar made it only a few minutes journey away from central locations. As the number of residents skyrocketed, Cambridge started to look like a city itself. In spite of this, the buildings retain their detached style reminiscent of the suburbs instead of row houses more common in Boston proper. The street car dramatically changed the land use in this site, giving it the overall skeleton that remains today. However, as transportation evolved yet again, there were subtle changes that occurred.
Signs of the Early Automobile and the Influence of Public Transportation
With the increasing popularity of the automobile and the construction of the green line station a few block up Cambridge Street, all undeveloped land was built upon by 1934 in this site. There is evidence that the main mode of transportation for at least some, if not most of the residents was the automobile. This can be seen in the construction of garages behind many of the buildings, as shown in the 1930 map.
Private transportation would not have been necessary in this location, due to the proximity of Lechmere Station, but the number of garages hints that it was becoming a more important mode of transportation in the area. This most likely allowed for a mixture of classes to live in the area. People with enough money to afford a car had garages and close proximity to the center of the city and those without enough money for a car still had easy access via public transportation. In spite of the fact that there were a number of cars owned in the neighborhood, it is likely that the majority of people in the area still took public transportation at least part of the time.
This area near the railroad tracks stayed industrial because of the railroad access for long after the original factory moved out and was converted into residential dwellings. However, between the 1930s and 1980s, major industry vanished from the area.
As cars and trucks became more common and highways were fully developed, industry was no longer limited by the location of railroad tracks. Jackson reiterates, “In conjunction with better highways and new methods of materials handling that emphasized one-story manufacture, the truck created a new efficiency for outlying industries that was not matched by similar economies in inner-city operations” (location 3654). It actually became more efficient for industries to use trucks to move their supplies than to be constrained by railroad lines. Additionally, land was much less expensive farther from the city and there was much more room to expand. This became more important with the new emphasis on one-story manufacturing that required industries to take up more space. With the ability to use trucks to transport their goods to market and move supplies in, many companies shifted their locations to the edge of urban centers. Jackson states that “between 1920 and 1930, the proportion of factory employment located in central cities declined in every city of more than 100,000 residents in the United States” (location 3654). While this tendency became obvious on this site at a later time period than Jackson suggests, it still follows the same trend of industry decentralization as time went on.
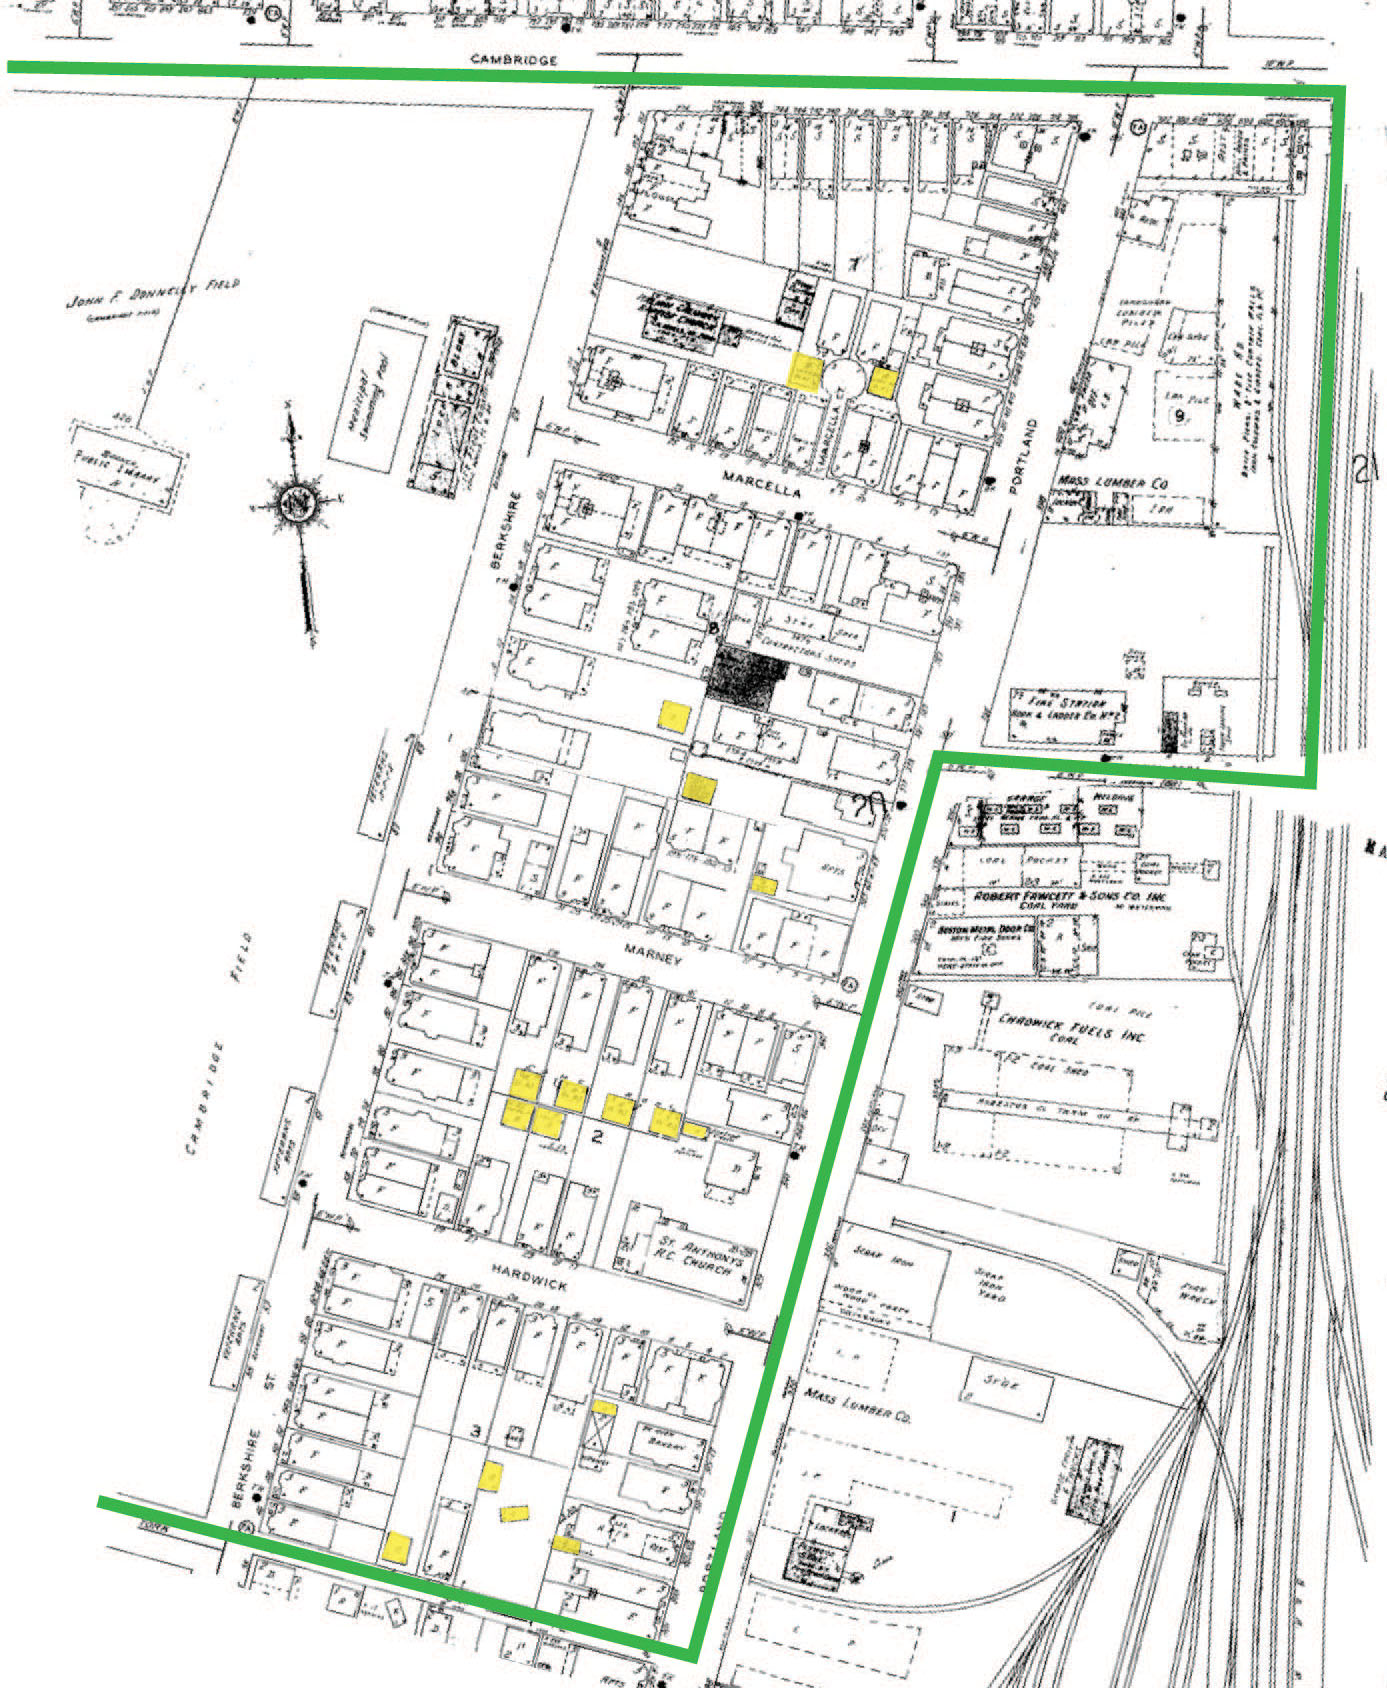 Figure 8: In this 1934 Sanborn map, the garages are highlighted in yellow. A fair number have been constructed.
The Disappearance of Industry
Since around the 1880s or before that, industry had be taking full advantage of the access to the railroad track near this site. As can be seen in the 1930s map, many spurs were created to lead off of the tracks and into the nearby factories.
 Figure 9: This 1934 Sanborn map highlights in red the railroad spurs near the site. Industry would have been making full use of the railroads to transport supplies in and out of the area.
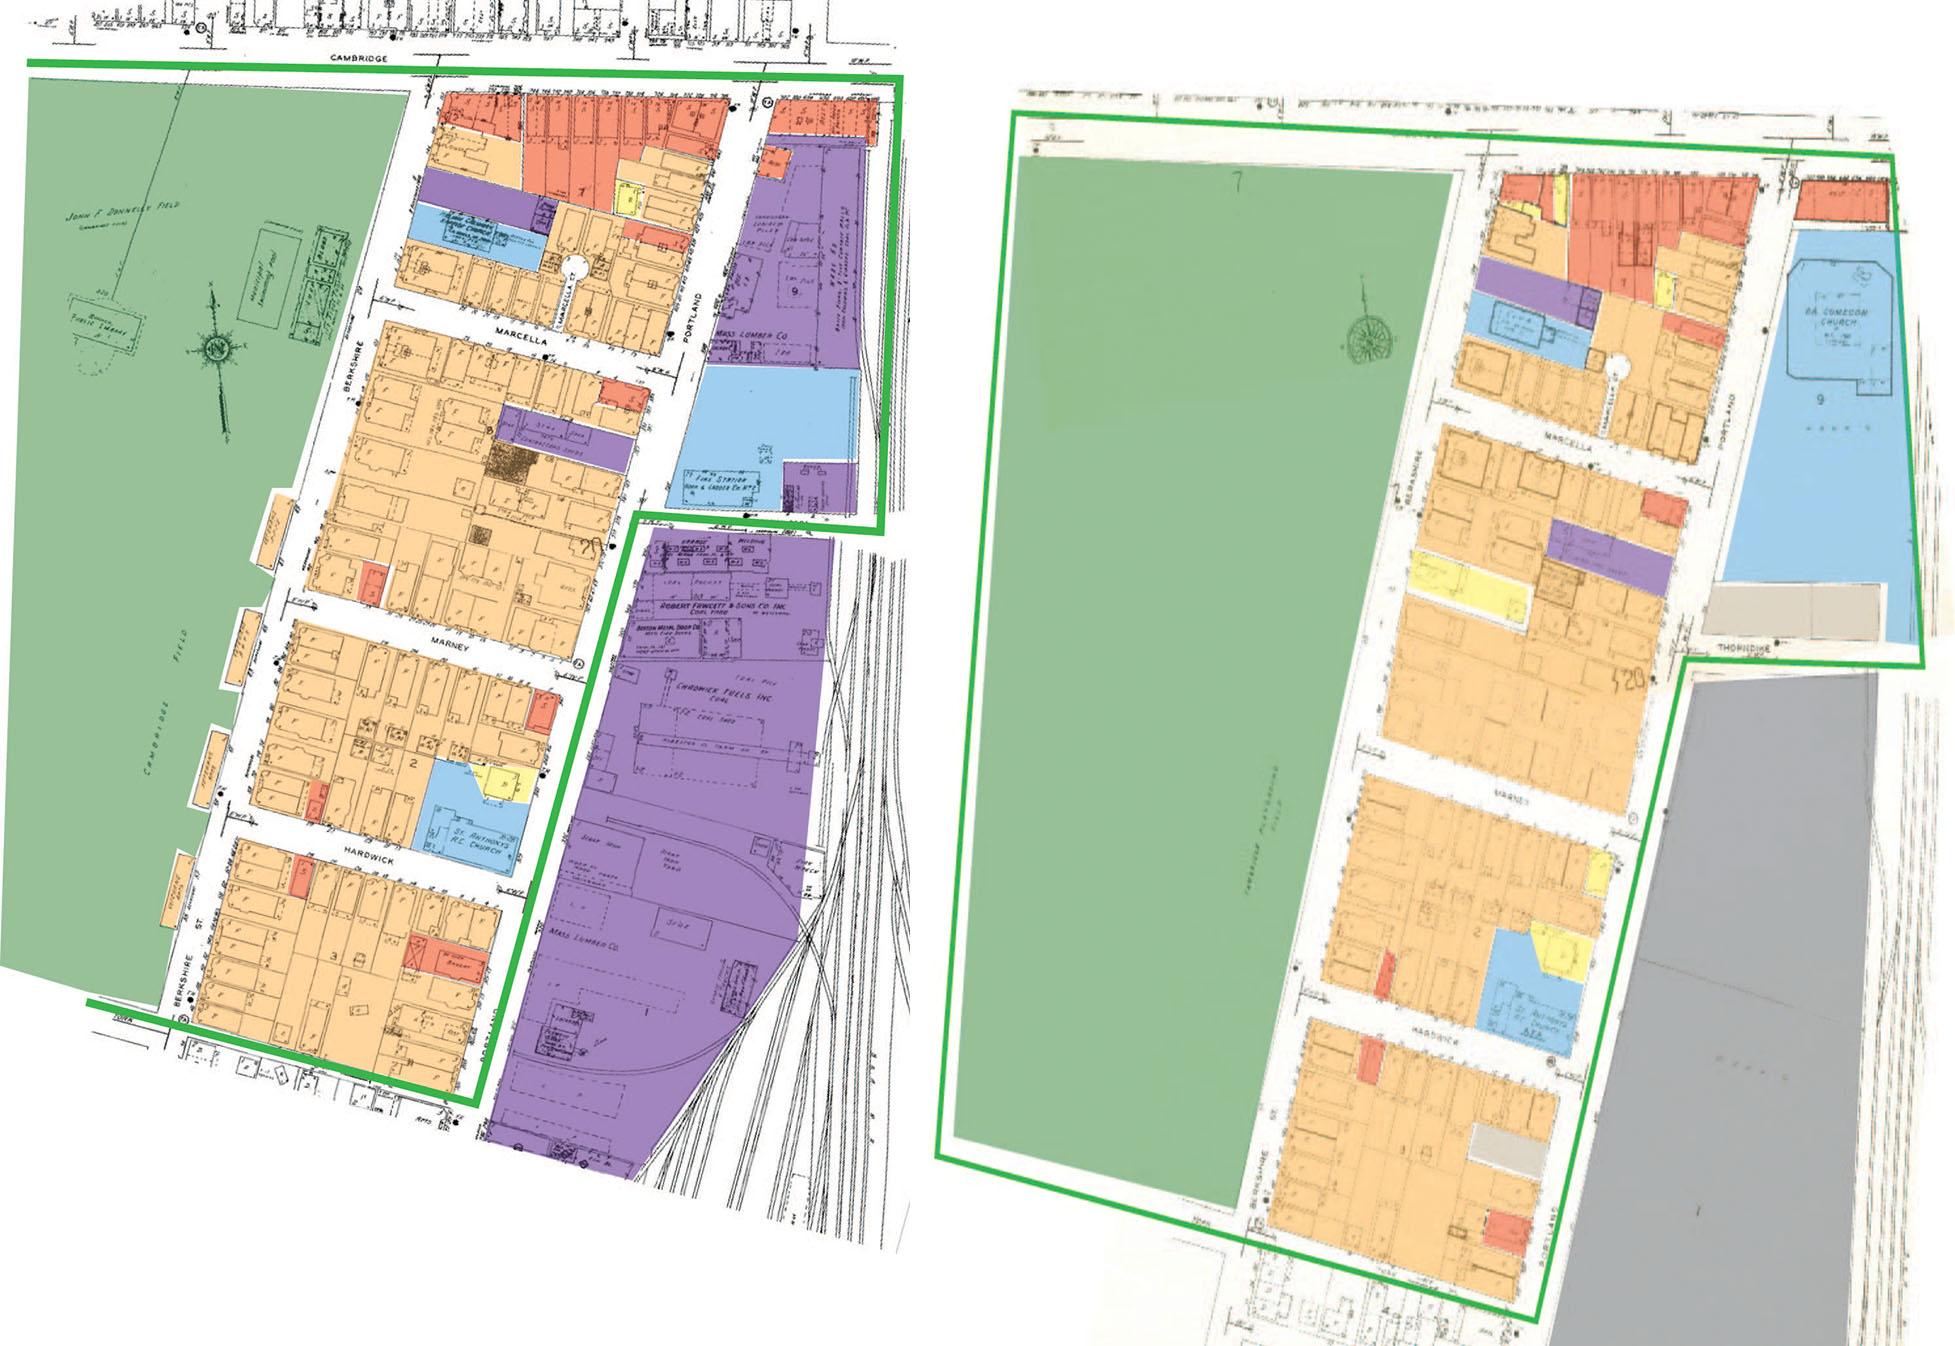 Figure 10: Between the 1934 Sanborn map on the left and the 1981 Sanborn map on the right, large swaths of industry (in purple) has been replaced by parking lots of institutional buildings (grey and blue respectively).
What, however, replaced those companies? By the 1980s, the space was entirely converted into parking lots. This is, perhaps, even more telling. The very technology that allowed the industrial companies to move out quickly took over their former locations. However, it appears that the same high land prices that made it economical for industrial companies to move out of the cities eventually encouraged the change of most of the parking lots into single family homes, giving the property a higher value. Thus the increased influence of the automobile completed the total change in land use from industrial to residential.
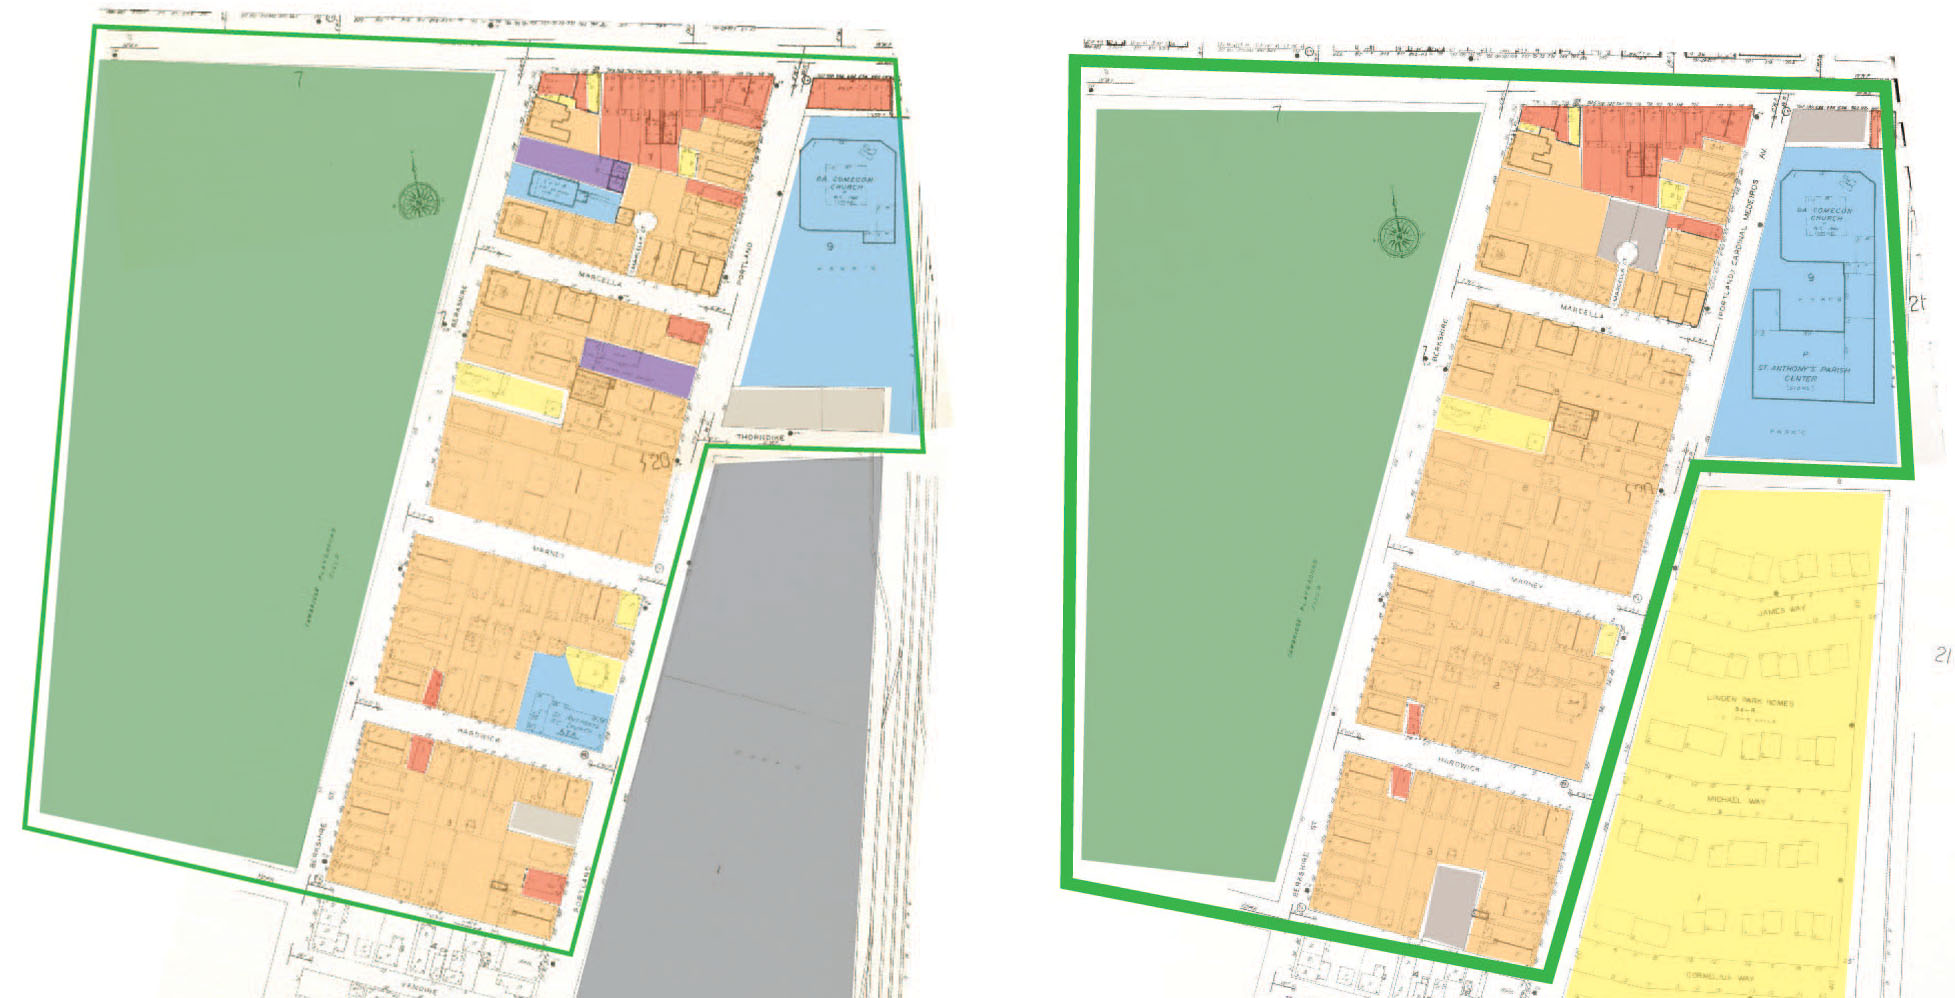 Figure 11: Between the 1981 and 1996 Sanborn maps, the parking lots next to the site (in grey) have been replaced by single family, detached home (in yellow).
Conclusion
Although many different factors affected the development of this site, the predominant force behind the dramatic changes taking place was transportation. Each major step in development of the site correlates with a change in transportation technology that enabled people and industries to have better access to the area and better connectivity with the rest of the city and world. From the canal that enabled industries to access the harbor, and thus the ocean beyond, to the automobile that enabled fast, personal transport as well as industrial shipping, this site reflects the changing needs and abilities of the society living in it. It is interesting how American cities reflect the conflicting values of privacy along with the desire to be connected and have easy access to other people and commercial areas. This site reflects this tension, with its detached houses with their own yards, and yet the neighborhood is within walking distance of many commercial areas and with the many forms of transportation, it would be a matter of minutes to travel to the center of Boston. Thus, residents can maintain their private home life while transportation technology enables easy access to the world beyond their backyards.
Bibliography
Jackson, Kenneth. The Crabgrass Frontier: The Suburbanization of the United States. New York: Oxford University Press, 1987.
Images:
Figure 1: Map from Google Maps 2015
Figure 2: Map from Hales, John G, 1830. Found in Harvard University Library. http://ids.lib.harvard.edu/ids/view/46931239?buttons=y Accessed March 23, 2015.
Figure 3: Map by Mason, W.A., 1857. Published by Ford, John. Found in the Norman B. Leventhal Map Center at the Boston Public Library. http://maps.bpl.org/id/12714 Accessed March 23, 2015.
Figure 4 and 5: Hopkins, Griffith Morgan. Atlas of the city of Cambridge, Middlesex Co. Plate J, Massachusetts. Philadelphia: G.M. Hopkins & Co., 1873
Figure 6: G.M. Hopkins & Co. Atlas of the city of Cambridge, Massachusetts: from official records, private plans and actual surveys. Plates 20, 25. Philadelphia: G.M. Hopkins, 1886.
G.W. Bromley & Co. Atlas of the city of Cambridge, Massachusetts: from actual surveys and official plans. Plates 6, 7. Philadelphia: G.W. Bromley and Co., 1894.
Figure 7: G.W. Bromley & Co. Atlas of the city of Cambridge, Massachusetts: from actual surveys and official plans. Plates 6, 7. Philadelphia: G.W. Bromley and Co., 1894.
Digital Sanborn Maps: Insurance Maps of Cambridge Volume 1. Sheet 21. New York: Sanborn-Perris Map Co. United. 1900.
Figure 8 & 9: Digital Sanborn Maps: Insurance Maps of Cambridge Volume 1. Sheet 21. New York: Sanborn-Perris Map Co. United. 1934.
Figure 10: Digital Sanborn Maps: Insurance Maps of Cambridge Volume 1. Sheet 21. New York: Sanborn-Perris Map Co. United. 1934.
Digital Sanborn Maps: Insurance Maps of Cambridge Volume 1. Sheets 7, 20. New York: Sanborn-Perris Map Co. United. 1981.
Figure 11: Digital Sanborn Maps: Insurance Maps of Cambridge Volume 1. Sheets 7, 20. New York: Sanborn-Perris Map Co. United. 1981.
Digital Sanborn Maps: Insurance Maps of Cambridge Volume 1. Sheets 7, 20. New York: Sanborn-Perris Map Co. United. 1996.