Note: In this paper, all Sanborn and Bromley Maps are oriented such that the upper end points West, the right end points North, the bottom end points East, and the left end points South.
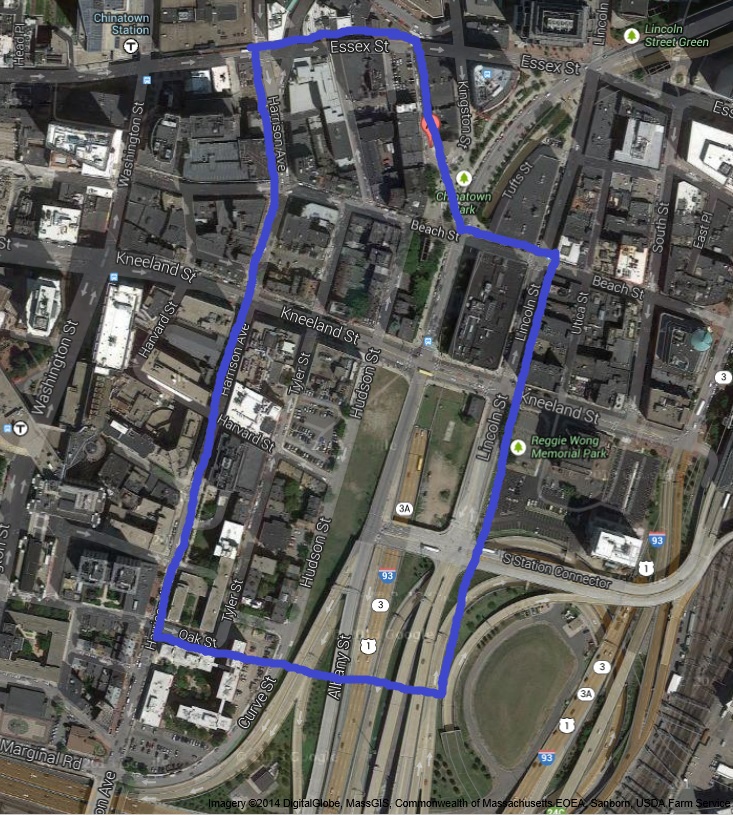 Google Maps Satellite View of Chinatown, as accessed in April 2014 [12]. Site today. I expanded my site slightly east to include the expressway because Chinatown’s history was largely centered on transportation development.
Chinatown is one of many cultural communities in Boston that seems to live in its own niche. Compared to the surrounding areas, its demographic is dramatically different, its signs are in Chinese, and its stores and restaurants remind us more of the buildings in China than the U.S. But this was not always the case. My site in Chinatown was once a largely industrial neighborhood occupied by early European settlers. Since then, the development of transportation from the train to the automobile and the influx of immigrants have transformed my site into a largely commercial, working class neighborhood of Chinese residents. Starting in the mid-20th century, however, as part of urban renewal, local government and institutions have increasingly encroached on Chinatown’s properties, leaving the future of the cultural community in question.
1867: Early Railroad Industry and Community
Transportation (The Railroad and the Horse Car) and Ownership (European Settlers)
In 1867, my site in Chinatown was occupied by settlers of European origin and was largely centered on railroad construction and industry. The Boston and Albany Railroad was located on the eastern border of the site in 1867 (Figure 2). Workers likely flocked to the area for railroad-related jobs, as the dominating industry was carpentry (Figure 1). Carpenter shops appeared on almost every block (Figure 1). Close to the railroad were machine shops and other factories (Shown in Figure 2: West of Lincoln Street and colored purple). In Crabgrass Frontier by Kenneth Jackson, Jackson writes that Philadelphia’s first suburb, Southwark, was “populated by many artisans – carpenters, shoemakers, tailors…[V]ery few men of wealth or position [were] among its residents” [1]. Similarly, many of the residents of my site in 1867 were artisanal, blue-collar workers, such as carpenters.
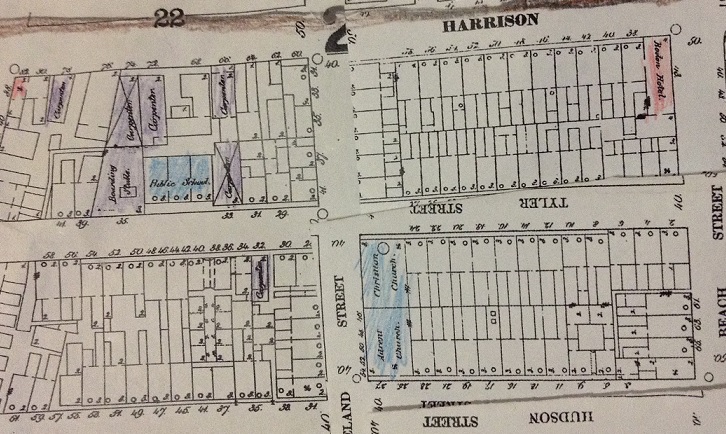 Figure 1. Sanborn map 1867 [13]. Carpenter shops, which make up a significant portion of the land use, are shaded in purple. The hotel is shaded in red at the intersection of Harrison and Beach Streets. The “X” symbol represents stables.
The other major land use in the neighborhood was residential. One block from the railroad was a series of dwellings, along with Christian and Baptist Churches and schools (Figure 2). According to Crabgrass Frontier by Kenneth Jackson, the New York and New Haven Railroad caused the “population [along the tracks to grow] by more than 50% in the first decade after initial construction” [2]. My railroad-bordered site may have had a similar population growth rate, which could explain why residences made up a large part of my site.
There were a few other land uses as well. Stables were common (Figure 1), suggesting that horse car was still used in 1867. Less significant was commercial land use. There were only a few shops in the area, suggesting that the community may have been just beginning to develop. At the intersection of Harrison Avenue and Beach Street, however, was a hotel (Figure 1). Jackson writes, “In the middle of the nineteenth century, every city…every wide place in the road with aspirations to larger size, had to have a hotel” (253). The hotel may be a sign that the community was preparing to attract visitors, expand its businesses, and grow. The neighborhood appears to be on the rise in mid-19th century.
1867-1885: Garment Industry and Early Chinese Immigrants
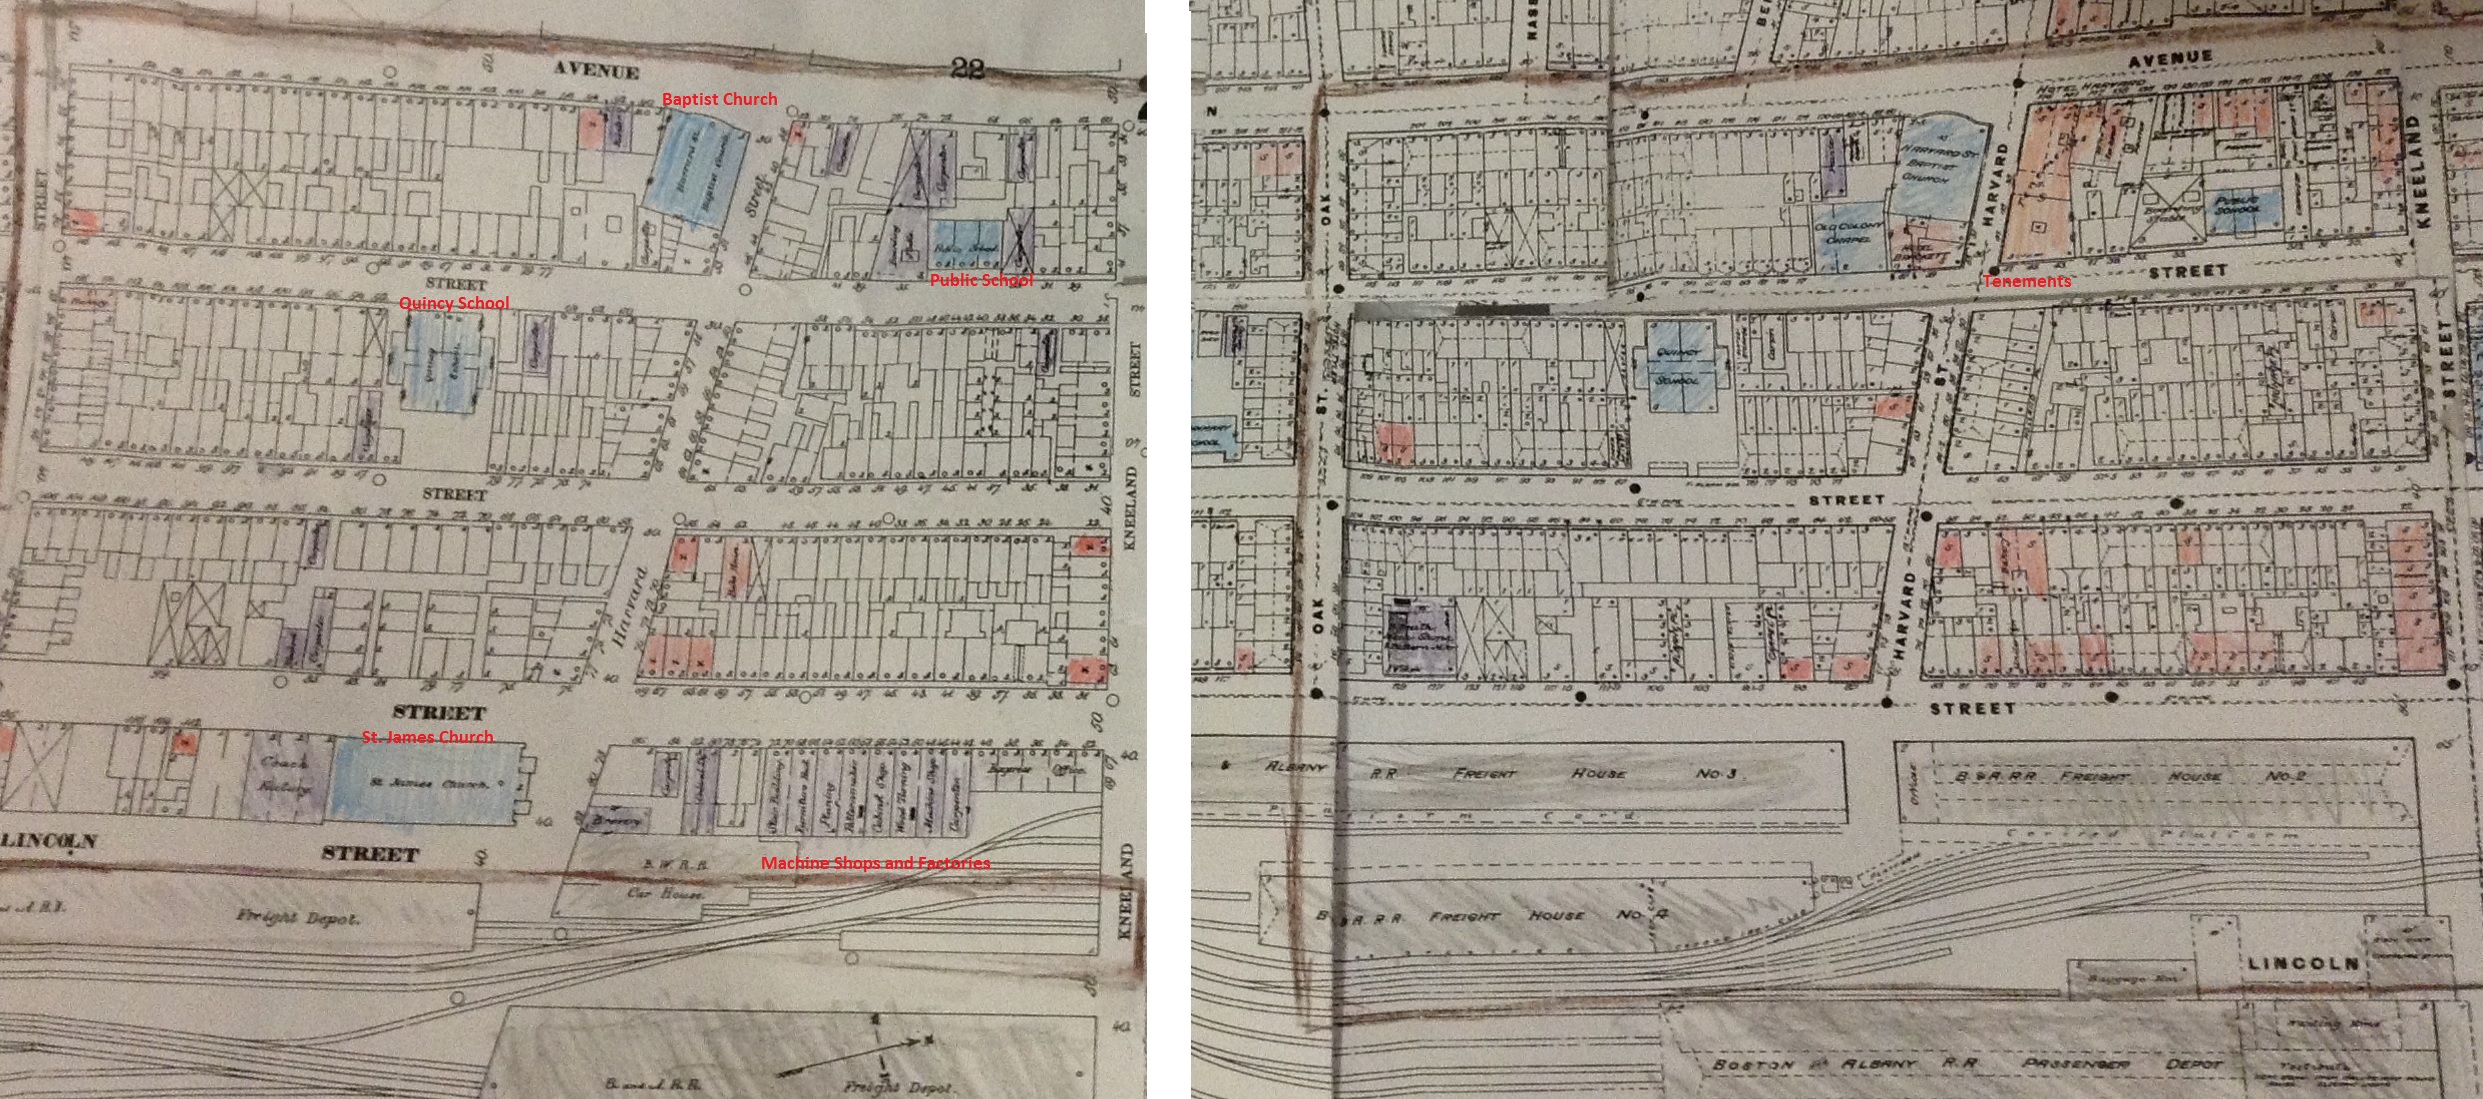 Figure 2. Sanborn Map 1867 (left) [14] and Sanborn Map 1885 (right) [15]. The shaded, gray areas represent the land use occupied by the Boston and Albany railroad, which has expanded a full block west from 1867 to 1885. We also see significant change in the amount of commercial land use (shaded red) from 1867 to 1885, especially close to the railroad. In 1885, we also see tenements. Finally, the unshaded properties represent dwellings, while the properties shaded blue represent institutions, such as churches.
Transportation (Completion of the Railroad)
The expansion, and likely the completion, of the railroad seems to have triggered a shift from largely industrial land use to largely commercial land use. By 1885, the railroad had expanded a block to the west (Figure 2) and does not change in size again on the Sanborn maps until it is replaced by the expressway (Expressway development discussed in the section 1929-1962). This suggests that in 1885, railroad construction at the site was likely ending. Factories were destroyed (Figure 2), probably because they were no longer needed for railroad construction, while the number of shops grew (Figure 2). Many of the new commercial buildings were by the railroad (Figure 2), perhaps because it is less desirable to have residences bordering the smoke, soot, and noise of the railroad. Jackson notes that in 1839 a “locomotive boiler exploded at Fourteenth Street [in New York City], killing the engineer and injuring twenty passengers. As a result of this and other accidents, fear of the big engines became widespread” [3]. Moreover, opening a store by the railroad would gain the business of travelers. As the railroad became more prominent, so did the commercial culture of the community.
Ownership (Early Chinese Immigration)
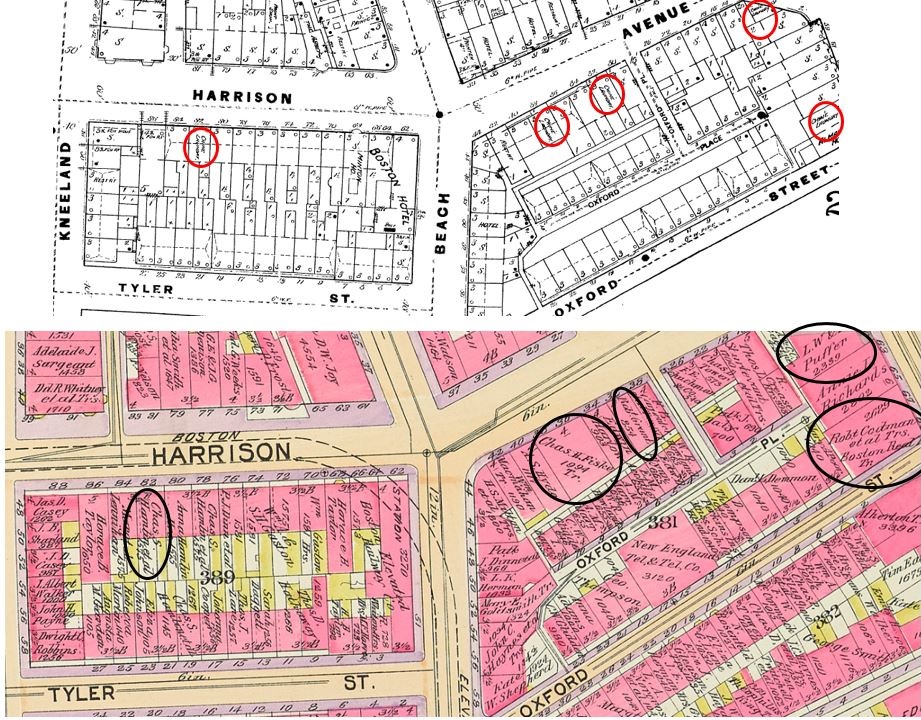 Figure 3 (Sanborn 1885 (top)) [16] and Figure 4 (Bromley 1898 (bottom) [17]). The red circles show the locations of Chinese laundry shops that showed up along Harrison Avenue in 1885. The black circles represent the laundry shops’ property owners, who are not Chinese, but Anglo.
Chinese immigrants, likely beginning to arrive around 1885, started a garment industry and may have contributed to the rise of tenements. In the Sanborn maps of my site, we see the first signs of Chinese residents in the 1885 map, when Chinese laundry shops appeared on Beach Street and Harrison Avenue (Figure 3). However, it is interesting that on the Bromley maps around this time, the recorded owner names for the same buildings that are marked “Chinese Laundry” on the Sanborn maps are English (Figure 4). This suggests that the newly immigrated Chinese workers could not afford to buy their own residences. They rented space and chose to enter the garment industry, perhaps because laundry service does not require much communication, and thus can capture the business of English customers even without knowledge of English. We also see the rise of tenements (Figure 2). Jackson writes that in London, there was legislation to “prevent the growth of [tenements],” as it was “impossible to remove all odors from the city” [4]. Still, tenements may have arisen around the same time the first Chinese immigrants arrived because tenements may have been all the newly immigrated Chinese workers could afford.
1885-1929: Rapid Growth of Chinese Community
Transportation (The Use of the Elevated Railroad and the Decline of the Horse Car)
The advent of the elevated railroad on my site likely aided the rapid growth of stores on Beach Street. The elevated railroad appeared on the 1909 map on Beach Street (Figure 5), which was also the most commercialized area in my site in 1909, with the highest concentration of stores. By my observations, that is still true today. The elevated railroad may have provided easier transportation for travelers and supplies to get to the shops, and thus fuel development in the area. My site in the early 20th century was becoming increasingly commercial.
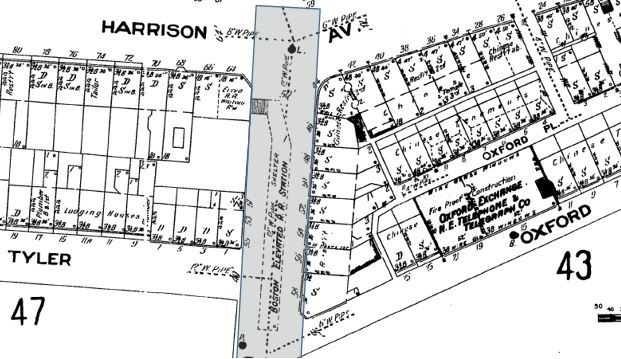 Figure 5. Sanborn Map 1909 [18]. (Sheet 46) Elevated Railroad shaded in gray. Buildings marked “S” represent stores.
The disappearance of stables on my site may foreshadow the growth of the private car. Although there were still a few stables in the 1909 map (Figure 6), they were gone by 1929, replaced by dwellings and residences. This suggests that the horse car as a form of transportation was becoming obsolete. Jackson writes that the “removal of horses from cities was widely considered a proper object for the expenditure of public funds…[T]he private car was initially regarded…a clean and efficient alternative to the old-fashioned, manure-befouled, odoriferous, space-intensive horse” by the 1920s [5]. There may have been a similar drive in Chinatown to make way for the private car, the development of which is discussed in the following section: Government.
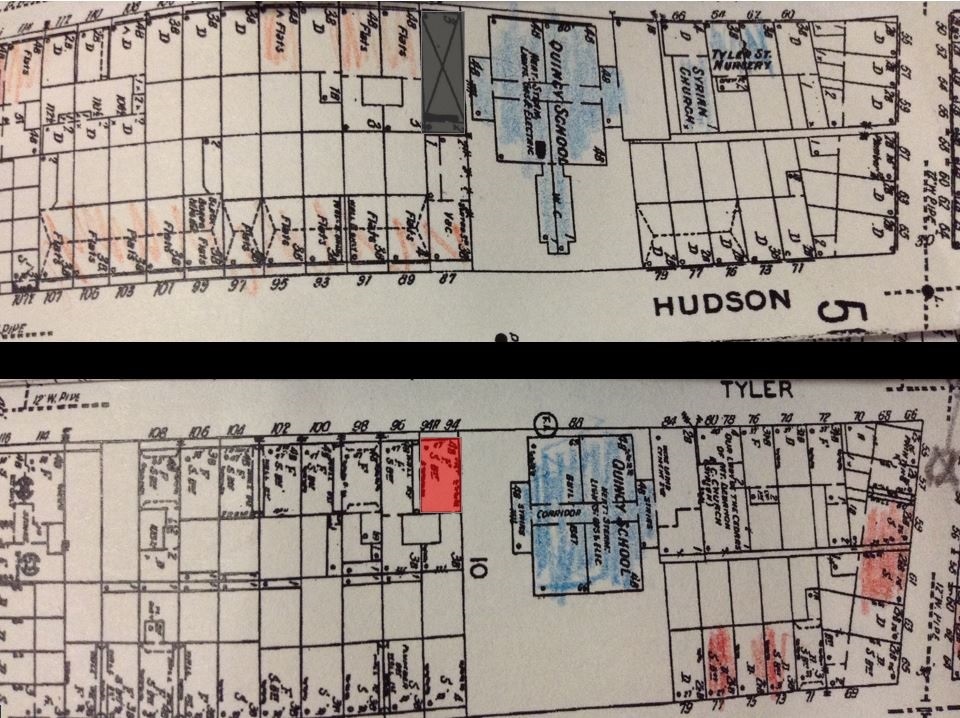 Figure 6. Sanborn Map in 1909 (top) [18] and Sanborn Map in 1929 (bottom) [19]. This is an example of the stable (shaded gray, denoted with X on map) being converted to a store (shaded red) as horses are no longer needed for transportation.
Government (Street Expansion)
The expansion of streets in my site in the early 20th century, likely a project by the local government, may have left residents struggling to run their businesses. Between 1885 and 1929, Harrison Avenue was expanded by slicing off the front portion of many shops along Harrison (Figure 7). Perhaps to make way for the private car, the local government seems to have embarked on street expansion in Chinatown. Shop owners lost the front portion of their stores and may have even been forced to relocate. Instances of government actions hurting Chinatown’s residents will continue as the century progresses, as we will discuss in the section “1929-1962.”
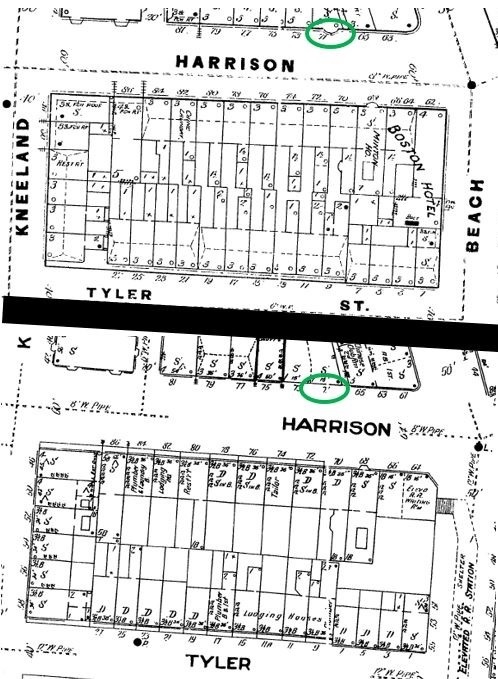 Figure 7. Sanborn Map of 1885 (top) [15] and Sanborn Map of 1909 (bottom) [18]. The circled green portion of the store on the 1885 map was removed as part of the expansion of Harrison Avenue.
Ownership (Growing Chinese Community)
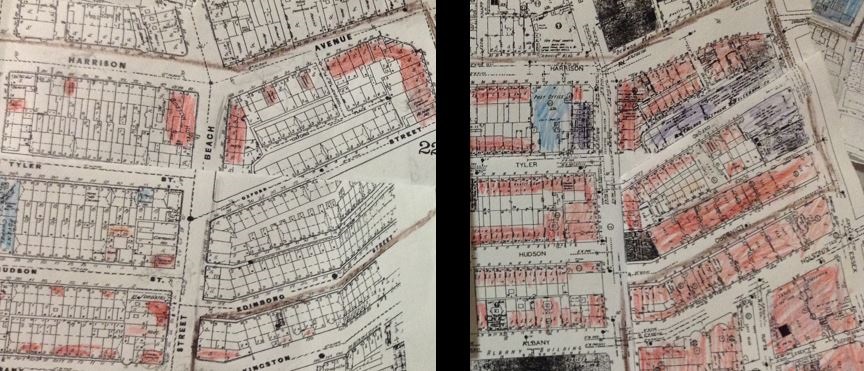 Figure 8. Sanborn Map of 1885 (left) [15] compared to Sanborn Map of 1929 (right) [19]. The amount of commercial properties (shaded red) has greatly increased.
The Chinese residents in this period began to own properties on my site instead of renting them, suggesting that they were gaining economic power. In the 1912 Bromley map, the first Chinese owner, Yee Wah, appeared in the northern portion of the site (Figure 9). By 1938, approximately half of the owners in the northern portion were Chinese (Figure 11). This new buying power indicates that the Chinese were wealthier in the early 20th century than they were when they first arrived. Moreover, the land use in my site in 1929 was significantly more commercial than in 1885, especially north of Kneeland Street (Figure 8). Some of these commercial properties were owned by Chinese residents according to the Bromley map in Figure 11. We cannot be sure whether the other commercial properties were run by Chinese or non-Chinese residents, but we can hypothesize that as the Chinese gained economic stability, they became more capable of opening shops. Thus, it would not be surprising if a significant number of the new commercial properties were run by Chinese residents.
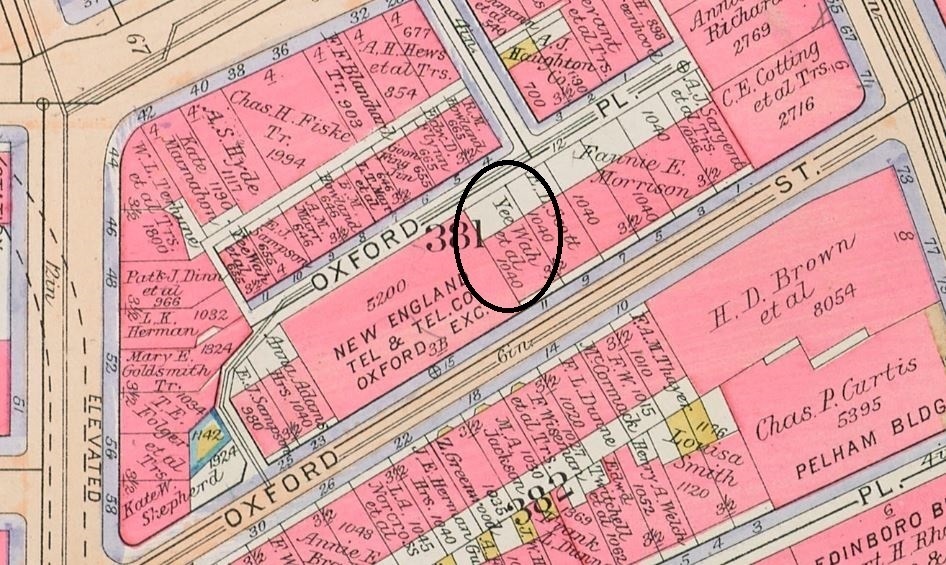 Figure 9. 1912 Bromley Map [20]. Circled is the property of the first Chinese owner found on the Bromley maps: Yee Wah.
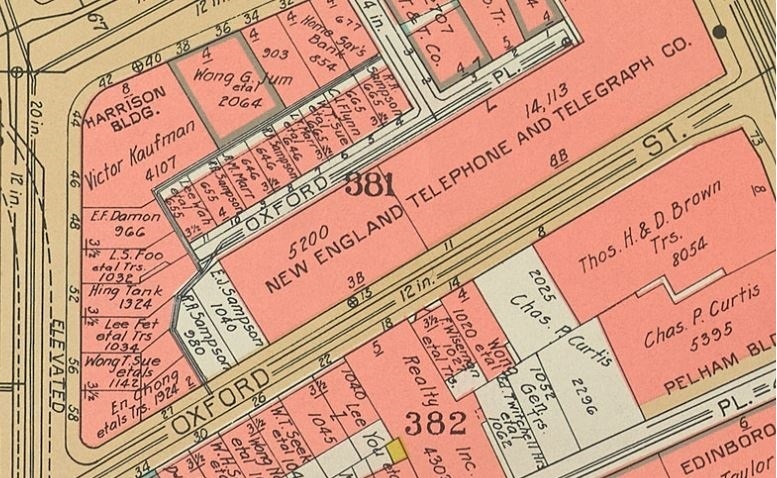 Figure 11. 1938 Bromley Map [22]. Many of the property owners are Chinese, whereas in 1912 (Figure 9), there was only one Chinese property owner.
1929-1962: Urban Renewal and the Struggle of the Chinese Residents
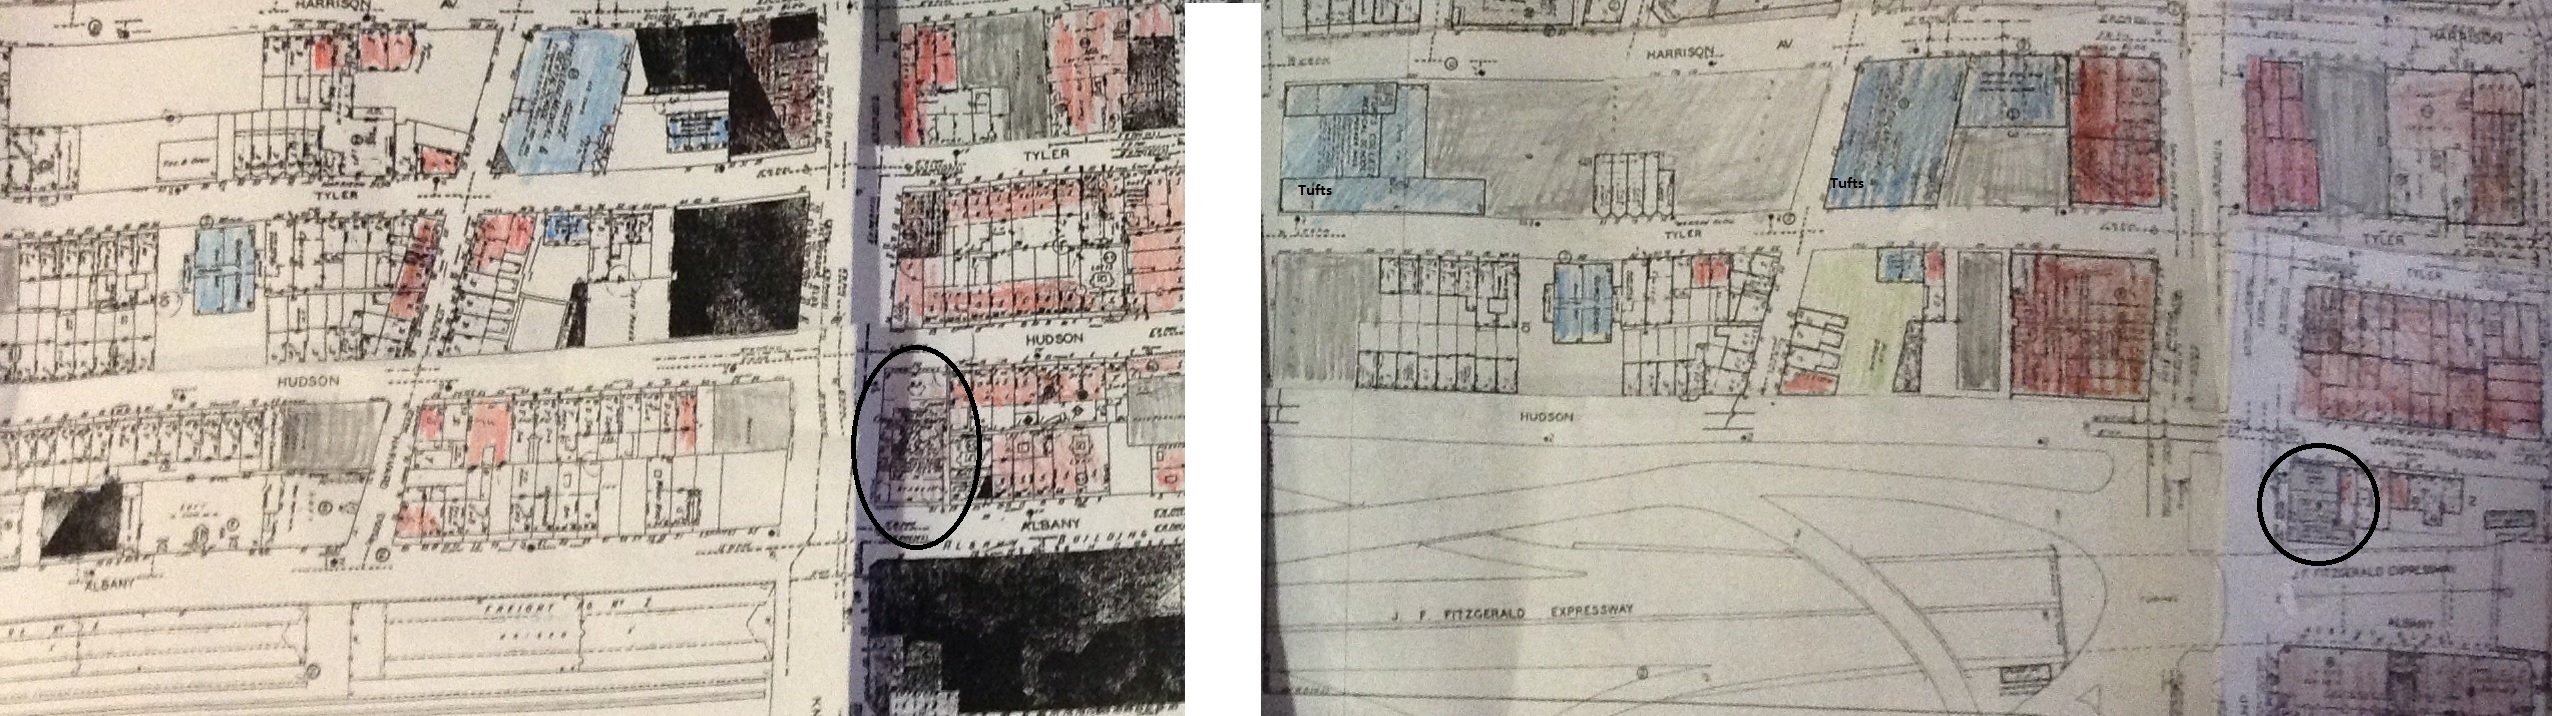 Figure 12. Sanborn Map of 1951 [24] is on the left and 1962 [23] is on the right. The expressway has replaced to railroad. Much of the land is in 1962 institutional (shaded blue), with Tufts Medical Center being one of the main institutions. Much of the other land use in 1962 is devoted to parking (shaded gray). Finally, we see that the Chinese Merchants Association Building (circled in black) was much larger in 1951 than in 1962, when a large portion of the building was replaced by the expressway.
Urban Renewal: Expressway Development and Government Intervention
As the Chinese community gained ground, however, the rise of the automobile and the construction of the expressway on my site put the residents’ recent successes to the test. While in 1951, the Boston and Albany Railroad still bordered Chinatown, it was replaced by the J. F. Fitzgerald Expressway by 1962 (Figure 12). This may be part of the Interstate Highway Act of 1956, where Congress, according to Jackson, “provided for a 41,000 mile system, with the federal government paying 90 percent of the cost” [6]. This act, Jackson writes, moved the government “toward a transportation policy emphasizing and benefiting the road, the truck, and the private motorcar” [7]. Accordingly, many residents in my site were forced to make way for the road. In 1962, all properties east of Hudson Street, including homes and shops, were destroyed. The Chinese Merchants Association building, for example, at the intersection of Hudson and Kneeland Street, was chopped in half (Figure 12). The half building still stands today, with a pagoda on its roof and a red sign that reads “Welcome to Chinatown.” It seems to represent the fighting spirit of its residents; despite the disregard from the government, the building continues to stand proudly.
With the use of cars came the proliferation of parking lots on my site. By 1962, parking lots were a significant land use (Figure 12). Jackson writes that Newark merchants predicted that with the increasing use of cars, “employment in cities [would] mushroom” [8]. However, according to Jackson, “downtown sections became hopelessly congested, and the ease of moving about by car was cancelled out by the impossibility of finding a place to park [around 1930]” [9]. Providing parking in my site in Chinatown was likely necessary to attract business from tourists and Boston residents.
Still, parking lots brought a new set of problems to Chinatown. Parking lots require much more space than a home or shop, so many homes and stores had to be displaced to build the lots. Moreover, Jackson notes that in Atlanta, a drugstore owner was “forced to close in 1926…[and the owner prophesized that] ‘the place where trade is, is where automobiles go…” [10]. Store owners in my site could have experienced a similar problem; while the availability of parking on my site may have initially attracted more visitors, if more visitors had continued to come via car, congestion may have become a problem. Then, travelers may have stopped frequenting Chinatown to avoid the congestion, which could have caused decline in business for Chinatown’s shops. In addition, while main roads such as Harrison Avenue have been expanded (discussed in section on 1885-1929), most narrow alley ways in Chinatown like Oxford Street were still very narrow. Even cars today drive partially on the sidewalk, as shown in Figure 12 in my previous paper on natural processes, which poses a safety risk.
Urban Renewal: Institutional Intervention (Tufts Medical Center)
The purchase of land in my site by Tufts Medical Center took away land previously occupied by residents of my site, and, accordingly, the land use on my site has become increasingly institutional. By 1962, Tufts Medical Center had claimed nearly four blocks between Harrison and Tyler streets for its medical buildings and parking lots (Figure 12). This purchase continued the theme of urban renewal, where the government, according to Jackson, could “stimulate building without government spending…[by relying] on private enterprise to ‘encourage improvement in housing standards and conditions’” [11]. However, this instant of urban renewal displaced countless businesses and residents in Chinatown. Residential spaces decreased, and Chinese residents who perhaps could only afford the housing in Chinatown were left struggling to find a new, affordable home. Since 1929, due to the encroachment of government projects such as the building of the expressway and the purchase of land by institutions such as Tufts Medical Center, Chinatown has been gradually shrinking, and its residents displaced.
Conclusion: The Struggle to Preserve the Cultural Community
Chinatown has arguably improved in the past few years. The construction of Chinatown Park by the freeway has added green space and Asian plants such as bamboo. Slightly off of my site but still in Chinatown is a playground sheltered by oriental-style trees that provide shade and cool air. In front of the main gate is an area for residents to gather in the morning to practice tai chi, play Chinese chess, or have performances during holidays.
Still, in many other ways, Chinatown has been on a downward trend since the coming of the expressway and urban renewal, and there are many signs that conditions may only worsen. Seemingly to make up for the loss of homes due to expressway construction, between Hudson Street and the expressway is ongoing construction of luxury apartments. However, the residents who lived in the destroyed homes likely cannot afford luxury apartments. Instead, the apartments will likely bring in wealthier residents. The land around and inside Chinatown is increasingly being claimed by governments, wealthier individuals, and institutions such as Tufts, encroaching on the already small cultural community. Whether its displaced residents will be able to find affordable housing and whether the neighborhood can keep its properties will be seen in the coming years. Will Chinatown flourish, barely survive, or die out?
Footnotes:
1. Jackson, Kenneth T. Crabgrass Frontier: The Suburbanization of the United States (New York: Oxford University Press, 1985), 16.
2. Ibid., 36.
3. Ibid., 38.
4. Ibid., 16.
5. Ibid., 164.
6. Ibid., 249.
7. Ibid., 191.
8. Ibid., 174.
9. Ibid.
10. Ibid.
11. Ibid., 203.
12. Boston, MA. (1 Apr. 2014). Google Maps, Sanborn, DigitalGlobe, MassGIS, Commonwealth of Massachusetts EOEA, USDA Farm Service Agemcy. Google. Retrieved from https://www.google.com/mapmaker?ll=42.350593,-71.060198&spn=0.005623,0.009398&t=h&z=18&vpsrc=6&q=Chinatown,+Boston,+MA&hl=en&utm_medium=website&utm_campaign=relatedproducts_maps&utm_source=mapseditbutton_normal
13. Boston, Massachusetts [map]. 1867. "Sanborn Fire Insurance Maps, 1867". Digital Sanborn Maps 1867-1970.
14. Ibid.
15. Boston, Massachusetts [map]. 1885. "Sanborn Fire Insurance Maps, 1885-1888". Digital Sanborn Maps 1867-1970. < http://sanborn.umi.com.libproxy.mit.edu/ma/3693/dateid-000002.htm?CCSI=254n> (1 Apr 2014).
16. Ibid.
17. Bromley, G.W. 1898 Atlas of Boston.1898, “Atlas of the City of Boston: Boston Proper and Back Bay,” Massachusetts Real Estate Atlas Digitization Project. < http://www.mass.gov/anf/research-and-tech/oversight-agencies/lib/massachusetts-real-estate-atlases.html> (1 Apr 2014).
18. Boston, Massachusetts [map]. 1909. "Sanborn Fire Insurance Maps, 1909". Digital Sanborn Maps 1908-1938. < http://sanborn.umi.com.libproxy.mit.edu/ma/3693/dateid-000019.htm?CCSI=254n> (1 Apr 2014).
19. Boston, Massachusetts [map]. 1929. "Sanborn Fire Insurance Maps, 1929". Digital Sanborn Maps 1929-1951. < http://sanborn.umi.com.libproxy.mit.edu/ma/3693/dateid-000035.htm?CCSI=254n> (1 Apr 2014).
20. Bromley, G.W. 1912 Atlas of Boston.1912, “Atlas of the City of Boston: Boston Proper and Back Bay,” Massachusetts Real Estate Atlas Digitization Project. < http://www.mass.gov/anf/research-and-tech/oversight-agencies/lib/massachusetts-real-estate-atlases.html> (1 Apr 2014).
21. Bromley, G.W. 1917 Atlas of Boston.1917, “Atlas of the City of Boston: Boston Proper and Back Bay,” Massachusetts Real Estate Atlas Digitization Project. < http://www.mass.gov/anf/research-and-tech/oversight-agencies/lib/massachusetts-real-estate-atlases.html> (1 Apr 2014).
22. Bromley, G.W. 1938 Atlas of Boston.1938, “Atlas of the City of Boston: Boston Proper and Back Bay,” Massachusetts Real Estate Atlas Digitization Project. < http://www.mass.gov/anf/research-and-tech/oversight-agencies/lib/massachusetts-real-estate-atlases.html> (1 Apr 2014).
23. Boston, Massachusetts [map]. 1962. In: Sanborn Insurance Maps of Boston, Massachusetts” Volume 1S. New York: Sanborn Company, 1962. Plates 59 and 60.
24. Boston, Massachusetts [map]. 1951. In: Sanborn Insurance Maps of Boston, Massachusetts” Volume 1S. New York: Sanborn Company, 1962. Plates 59 and 60.
Bibliography:
Boston, MA. (1 Apr. 2014). Google Maps, Sanborn, DigitalGlobe, MassGIS, Commonwealth of Massachusetts EOEA, USDA Farm Service Agemcy. Google. Retrieved from https://www.google.com/mapmaker?ll=42.350593,-71.060198&spn=0.005623,0.009398&t=h&z=18&vpsrc=6&q=Chinatown,+Boston,+MA&hl=en&utm_medium=website&utm_campaign=relatedproducts_maps&utm_source=mapseditbutton_normal
Bromley, G.W. Atlas of Boston. “Atlas of the City of Boston: Boston Proper and Back Bay,” Massachusetts Real Estate Atlas Digitization Project. < http://www.mass.gov/anf/research-and-tech/oversight-agencies/lib/massachusetts-real-estate-atlases.html> (1 Apr 2014).
Jackson, Kenneth T. Crabgrass Frontier: The Suburbanization of the United States. New York: Oxford University Press, 1985.
Sanborn Fire Insurance Maps.” Digital Sanborn Maps. < http://sanborn.umi.com.libproxy.mit.edu/ma/3693/dateid-000002.htm?CCSI=254n> (1 Apr 2014).