Going back in time, my site tells the story of Central Square and how, based on its centralized location, it became the focus of political and social services that united the city of Cambridge as well as a main point of connection between Cambridge and the neighboring urban areas. This centrality lead to a concentrated increase in civic, commercial, and residential development as the area shifted from suburban to urban. Over time, the area has become an epitome district capturing the history and culture of Cambridge.
The Meaning of Central
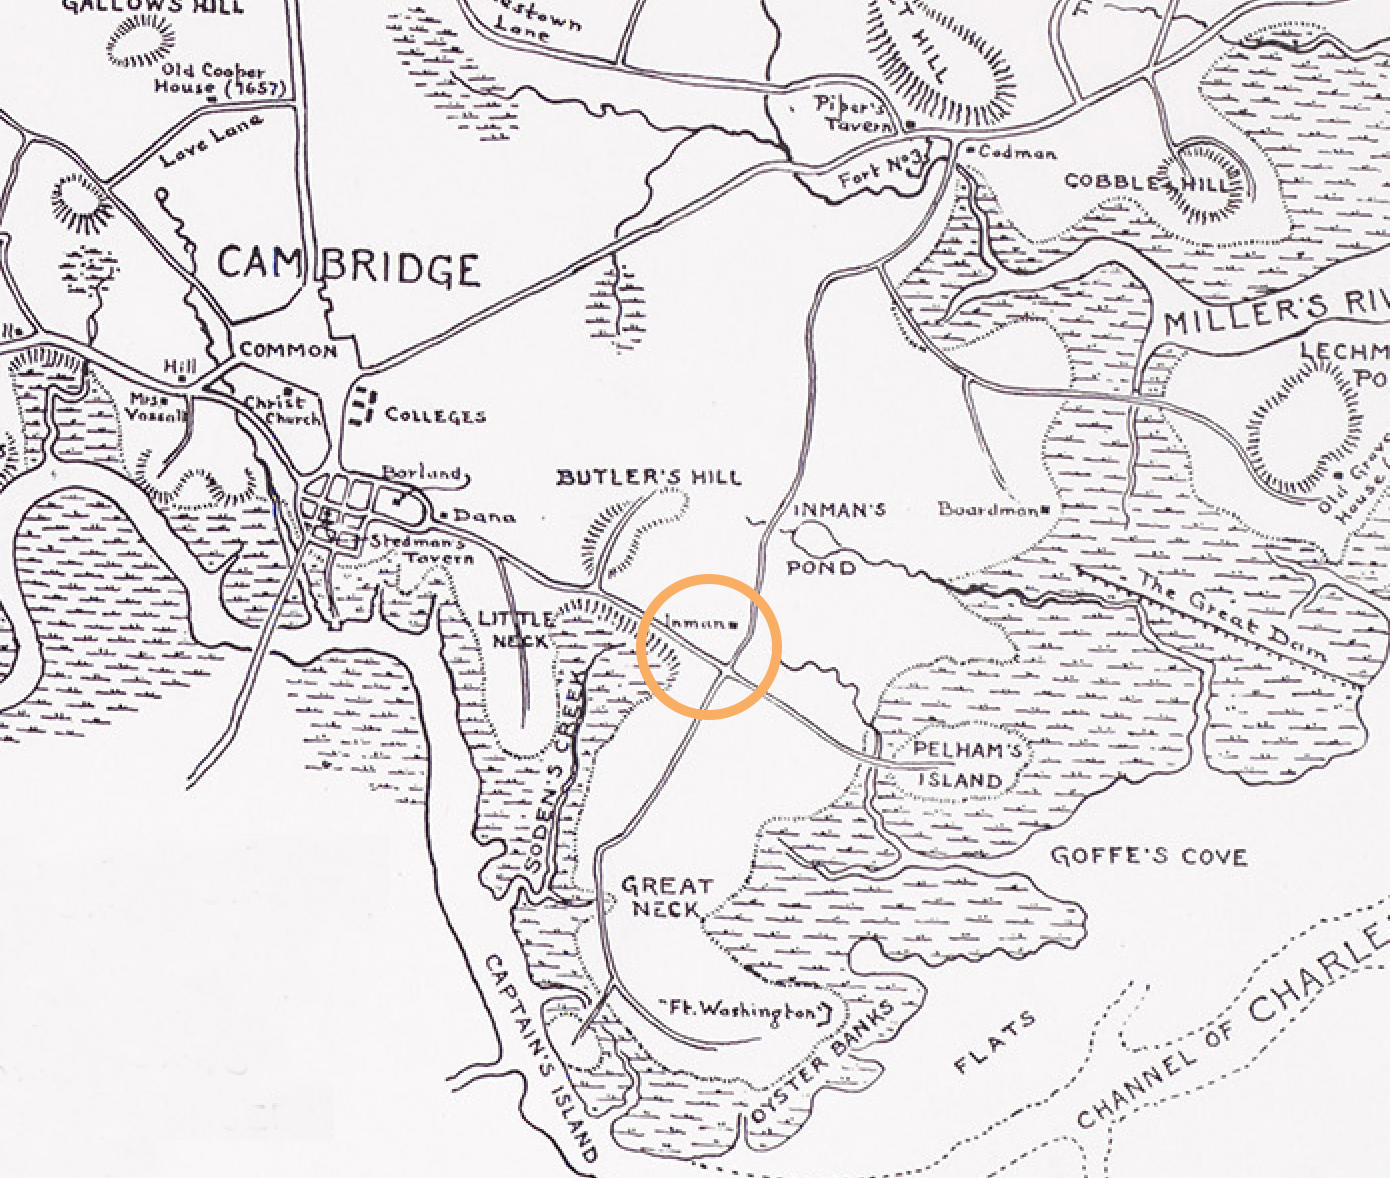 Figure 1: This 1777 Map excerpt shows Cambridge in Revolutionary Times. Note the crossroads by the Inman estate as the approximate location of Central Square today.
 The Central Square area has been an important site for as long as America has existed as a country. On the 1777 map of routes during the Revolutionary War, the area that is currently Central Square was once an important crossroads joining the vital pathways between the north and south, east and west (Figure 1). Although those roads are no longer there, the Inman Estate located at that junction has been very influential in the initial development of the area.
Close to the beginning of the revolutionary war, the Inman family fled Cambridge and their mansion was used to house patriot troops and the headquarters for General Israel Putnam (Waymarking). Its likely that after the American Revolution, some of the first settlements in Cambridge grew up around that area because of the easy access to roads and familiarity with the region. And the General Putnam Mansion remained an important figure in the region until way into the 19th century, as viewable on 1865 map (Figure 3).
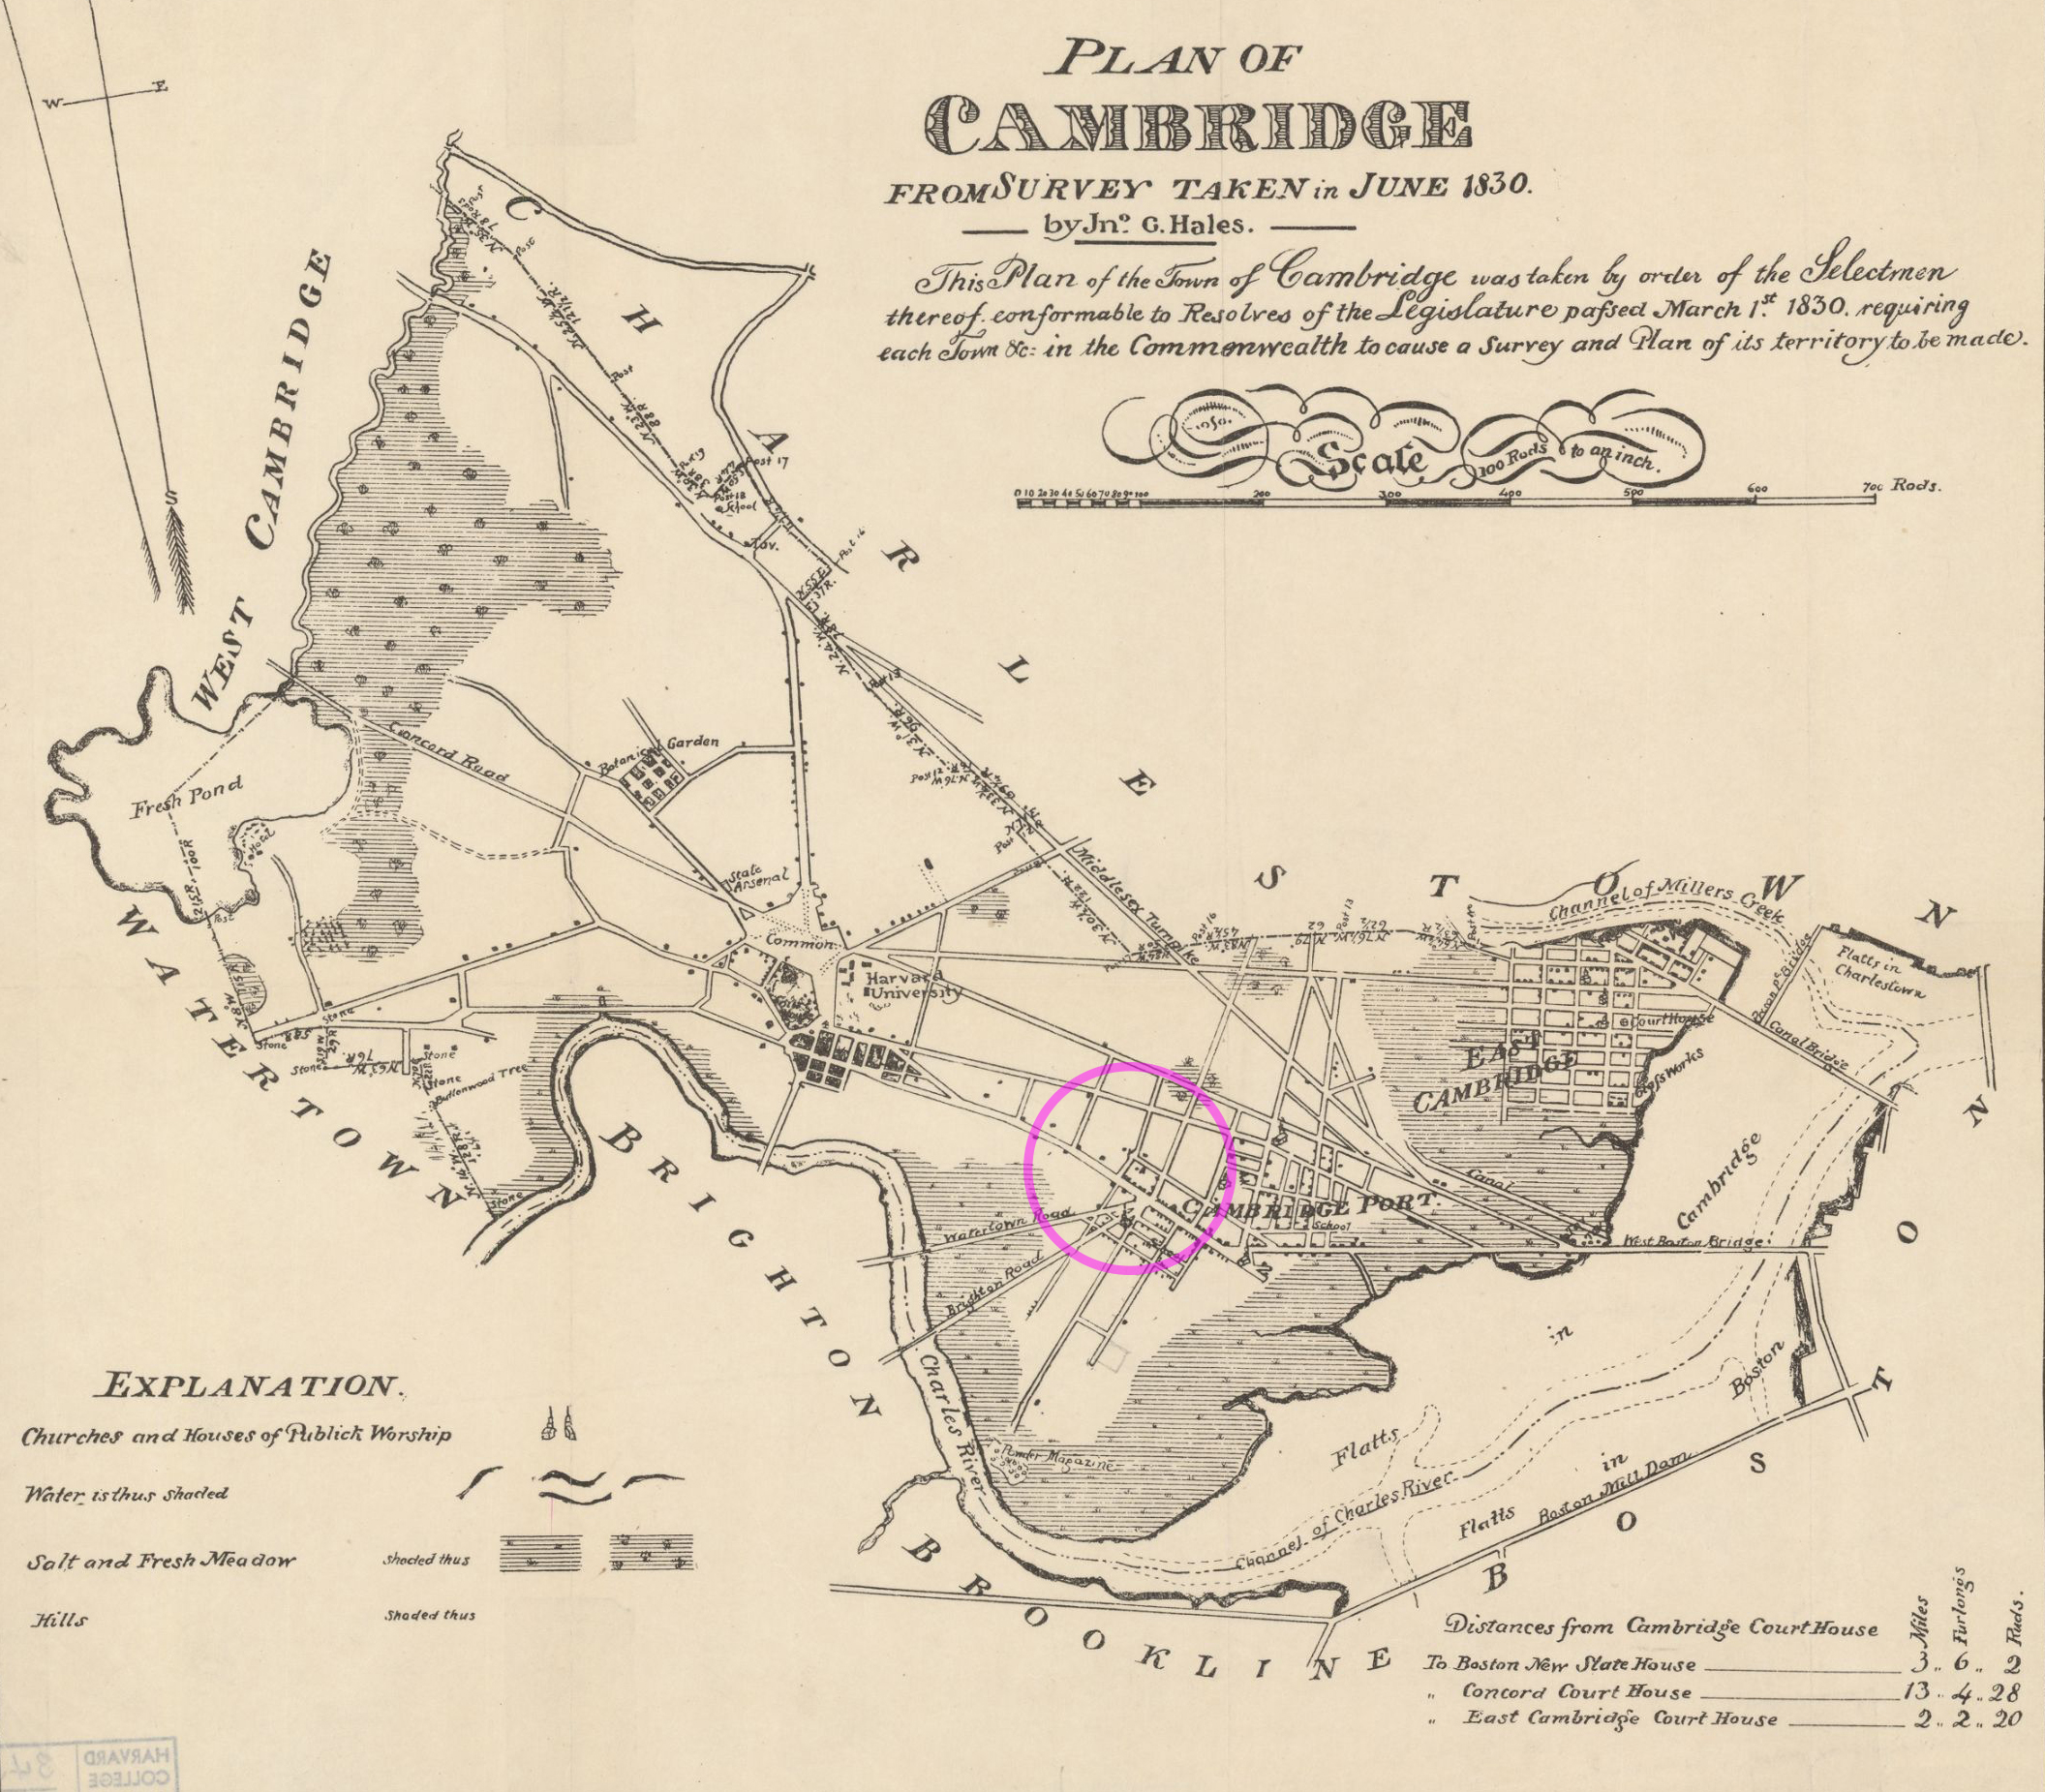 Figure 2: This 1830 Map shows the three main settlements in Cambridge: Old Cambridge/Harvard Square, East Cambridge, and Cambridge Port. Note that the Central Square area is defined by the intersection of three main bridges that cross marshland to get to main urban areas south of Cambridge.
 Cambridge Port was established in 1808 (Timeline) and by 1830 Cambridge Port was one of the three major populated regions of Cambridge in addition to East Cambridge and Old Cambridge around Harvard University. It remained an essential crossroads connecting Cambridge and Charlestown to the north with bridges to Brighton, Brookline, and Boston south of the Charles river. The West Boston Bridge was especially important because, constructed in the late 18th Century, it cut the distance from Harvard to Boston down from about eight miles to less than four (Waymarking), and made Cambridge Port, as opposed to East Cambridge, the central point between the two major locations.
In the early 19th century Cambridge Port had its own meeting house, school, churches, and cemetery. Despite the few connecting roads, it was fairly separated from Harvard and East Cambridge by geographic features such as salt marshes. In order to unify the three diverging neighborhoods the new Cambridge Town Hall was moved out of Old Cambridge and into Cambridge Port in 1832, a more centralized location between the other two areas (Timeline). This newly focused center of government was crucial for joining the communities to prepare for incorporation of the three into one unified city in 1846 (Waymarking).
Becoming a Public Center
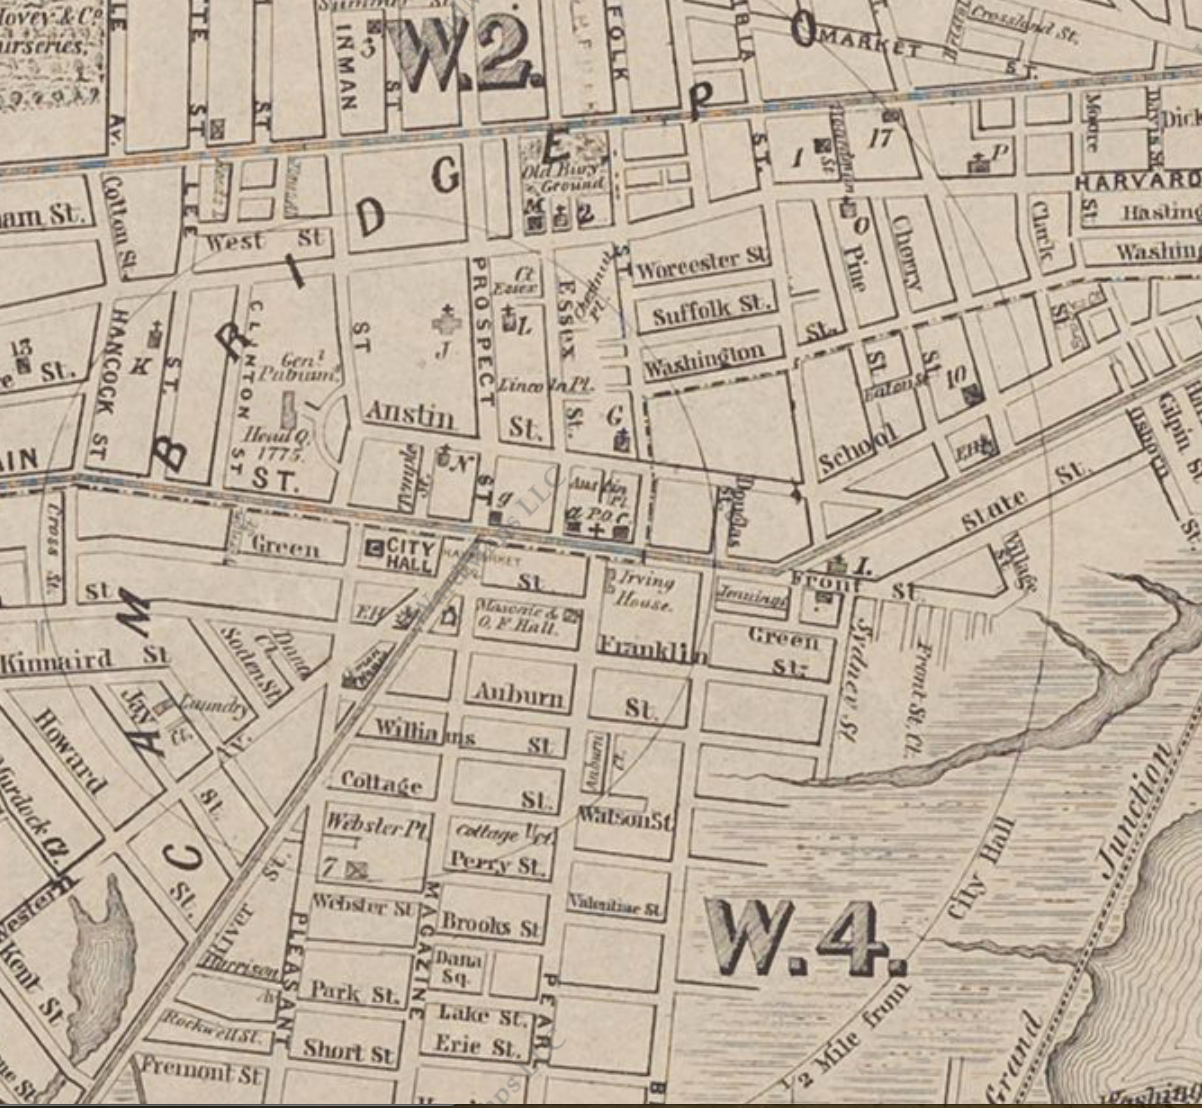 Figure 3: This Map of Cambridge from 1865 shows the rail car lines that go down Front Street and River Street and the Grand Junction Railroad that goes along the Charles RIver. It also shows City Hall at its previous location (right across the street from its current location) with radial distance lines centered around City Hall and labels such as “½ Mile From City Hall.” Furthermore, you can see some of the original churches, public buildings, and post office around Central Square, along with the Inman Estate labeled “Gen. Putnam Head Q. 1775,” nearly a century after the American Revolution.
 The marshes that dominated most of Cambridge in the early half of the century were filled by the 1870s (Figure 4) to make room for an increased population and as city as a whole grew, its center grew with it. After Town Hall (which became City Hall with incorporation in 1846) moved to the Cambridge Port area, it was only a matter of time before other civic institutions followed. By the mid 19th Century, Central Square was also home to a post office (Figure 3), police station, and fire engine house (Figure 5). City Hall was also soon joined by other public meeting places such as Union Hall, Masonic Hall, and a YMCA (Figure 5). And the number of public serving buildings continued to increase throughout the 19th century as more halls, recreational facilities, churches, libraries, theaters, and even a mission continued to move into the area.
It is also around this time that Central Square got its name and recognition for the key role it played in Cambridge life and politics. While a map in 1830 showed significant distances based on the East Cambridge Courthouse (now the Middlesex County, constructed in the early 18th Century), by 1865 Cambridge map makers recognized the new City Hall in Central Square as the new defining location on map and drew reference distances based on that point (Figure 3).
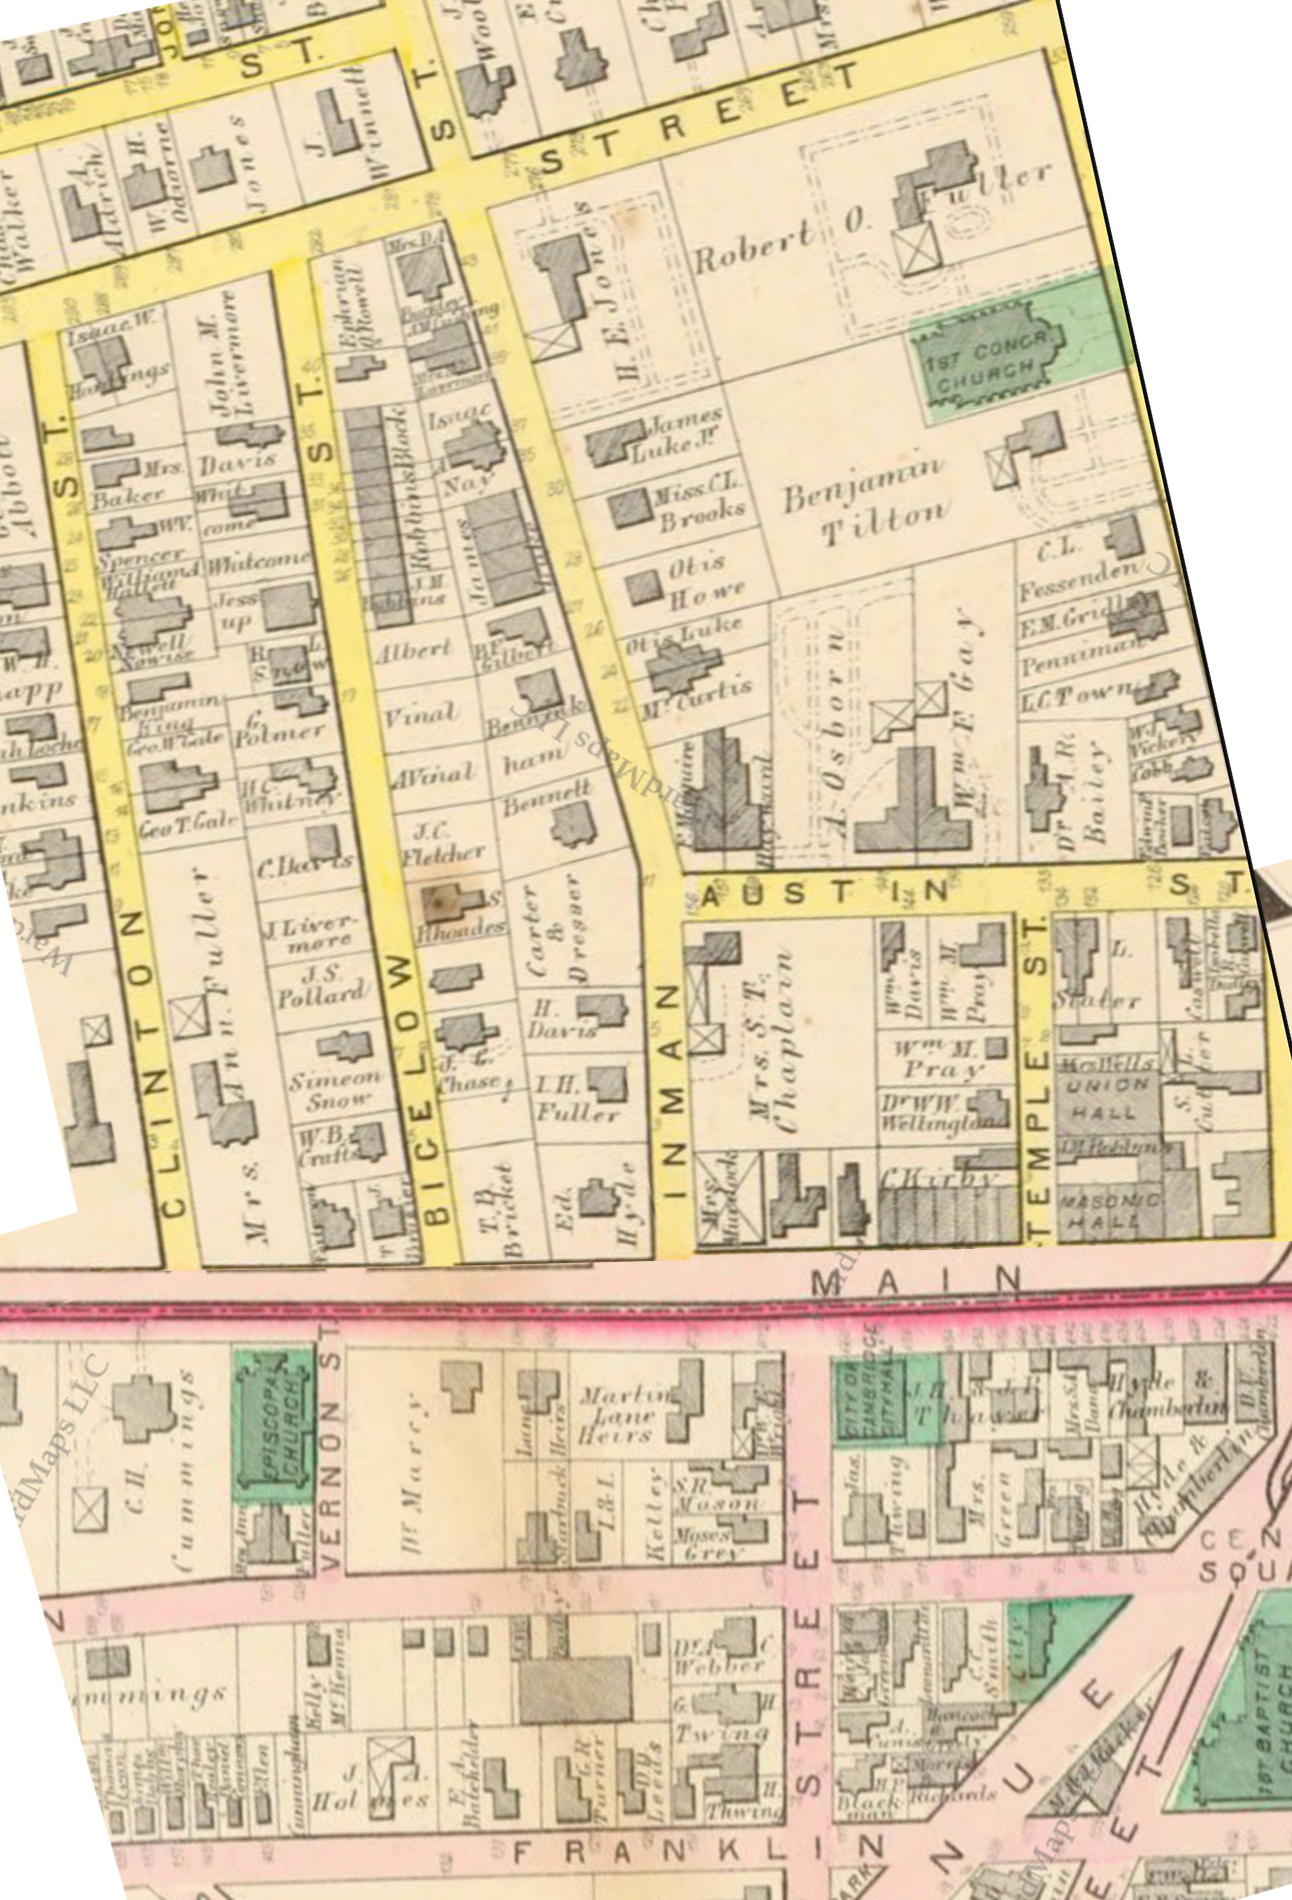 Figure 4: This Hopkins Atlas Map from 1873 shows Central Square with a range of older buildings and grand single-family properties, to newer and smaller flats in the residential district. There are also plots that are owned but have not yet been developed showing that this was a period of expansion and growth in Central Square. Note that the Inman House, which was once so influential in the development of this area, is no longer present.
 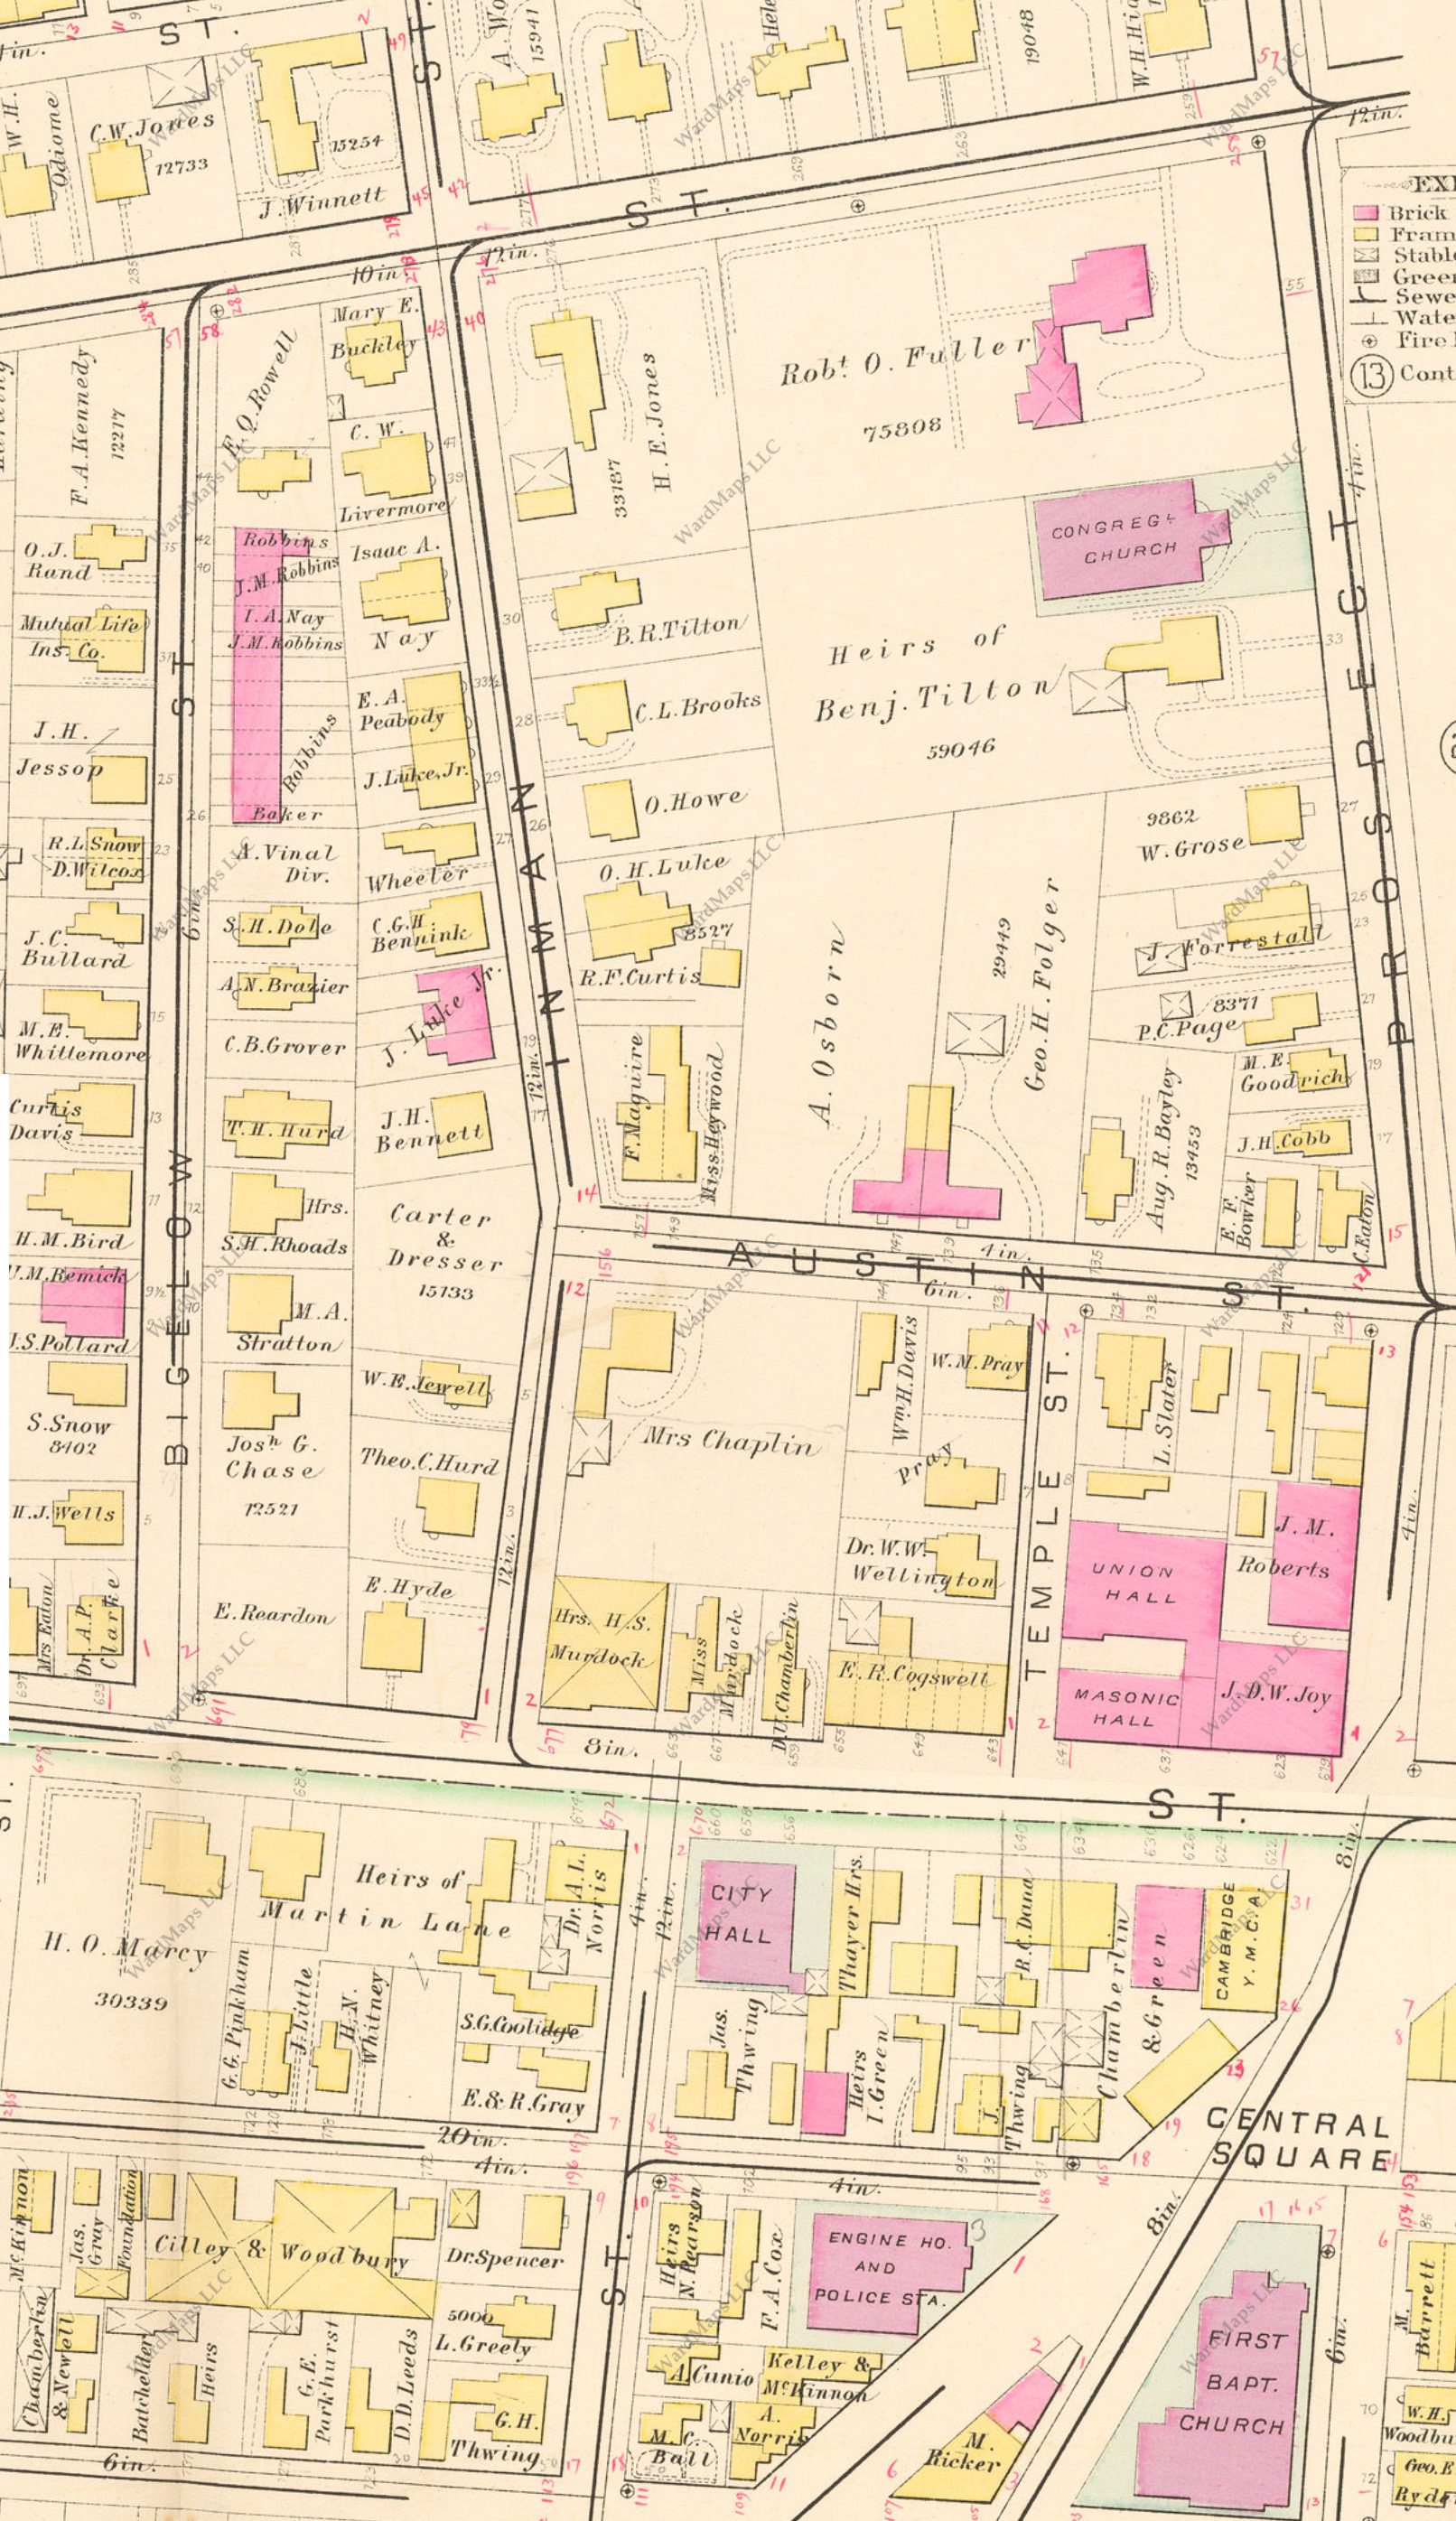 Figure 5: This Hopkins Atlas Map from 1886 is very similar to that of 1873 but shows that more properties are slowly being developed over this time.
 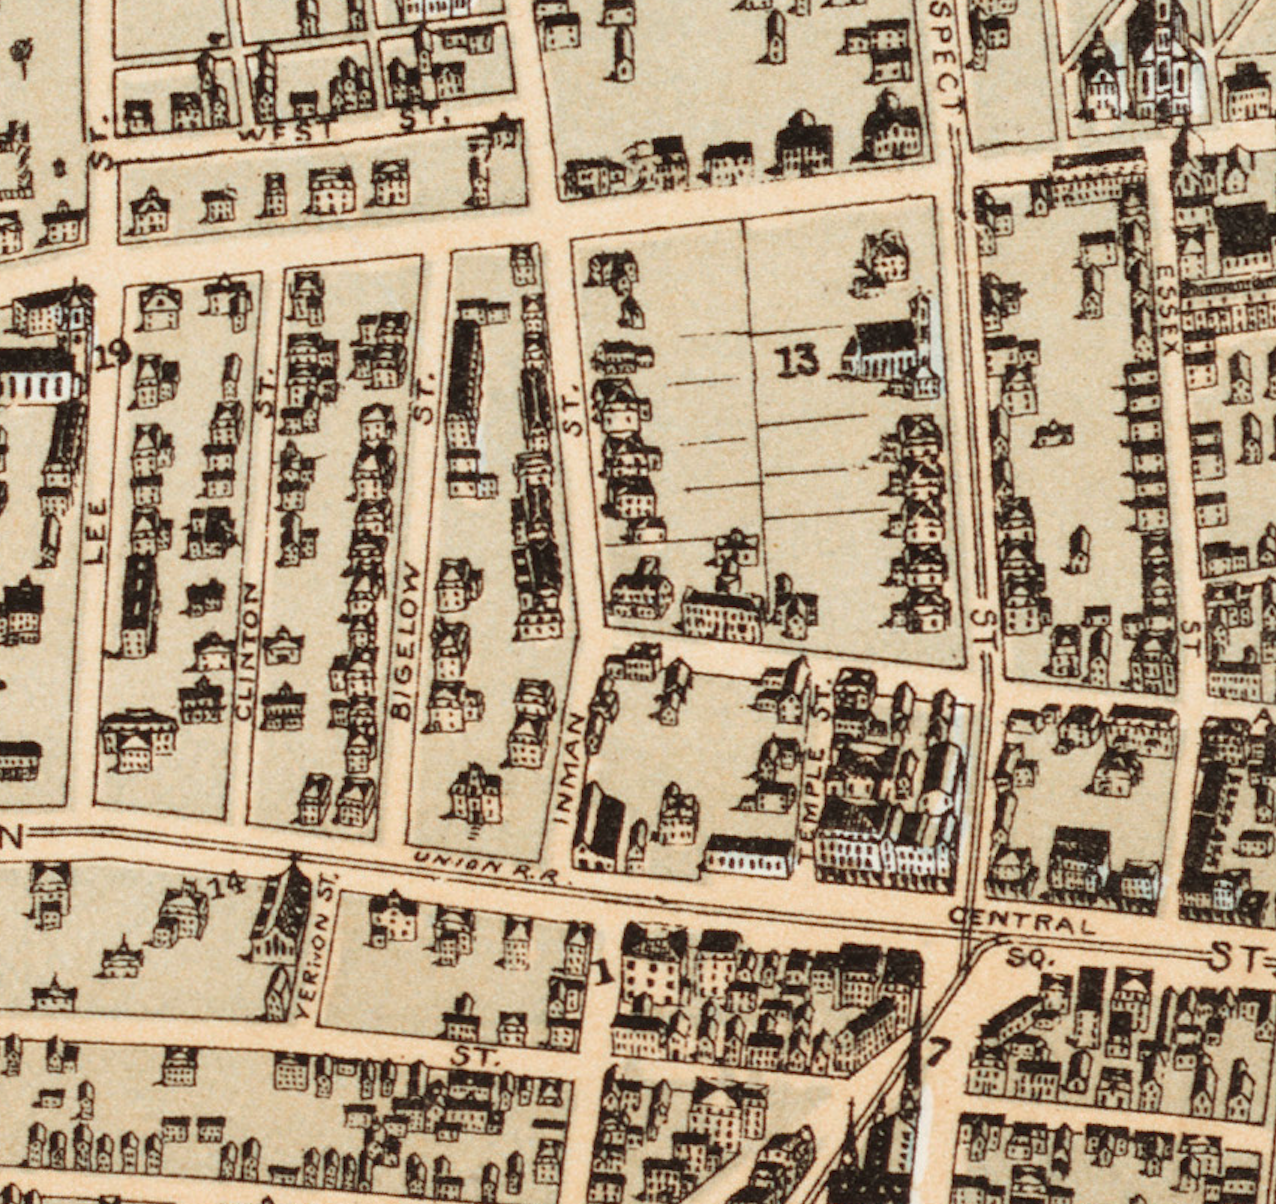 Figure 6: This Bird's eye view of Central Square from 1886 is a nice contrasting perspective on the area as it is easier to see relative density of the space: the open backyards on the upper plots and the higher, up to four story, buildings that line Front Street. The "1" labeled in the center denotes City Hall.
 ___
The Modern Link between Urban and Suburban
The 19th Century saw the invention of the steam locomotive, telegraph, elevator, telephone, lightbulb, automobile and more (Timeline). Great technological leaps, especially in transportation and building technology, in the 19th and 20th centuries helped to rapidly expand the area around my site and define Cambridge and Central Square’s place in relation to the greater Boston area.
While Community and Civic buildings were thriving in Central Square, the majority of Cambridge’s growth was in residential housing (Jackson, 21). Public transportation came to Cambridge in 1824 with the opening of horse drawn omnibus services to carry passengers into Boston, as seen in the can see 1865 map (Figure 3). Then in 1853 the Grand Junction Railroad opened and ran across the marshes from East cambridge through Cambridge Port (also in corner of Figure 3. And in 1912 the Boston Subway system was extended to Cambridge, with one of its most heavily trafficked stops right in Central Square (see tracks in 1930 Bromley map, Figure 9). These ever-improving public transportation systems helped to maintain and modernize Central Square’s importance as an accessible center of travel and activity. And, of course, the quick spread popularity in the early 20th century of the automobile and affordable Model T as an efficient form of private transportation even further increased the ease of accessibility between Cambridge and Boston (Timeline). On the Bromley Maps, you can clearly see the transition from Stables and bike repair shops to Garages and auto body shops around central square (Figure 10).
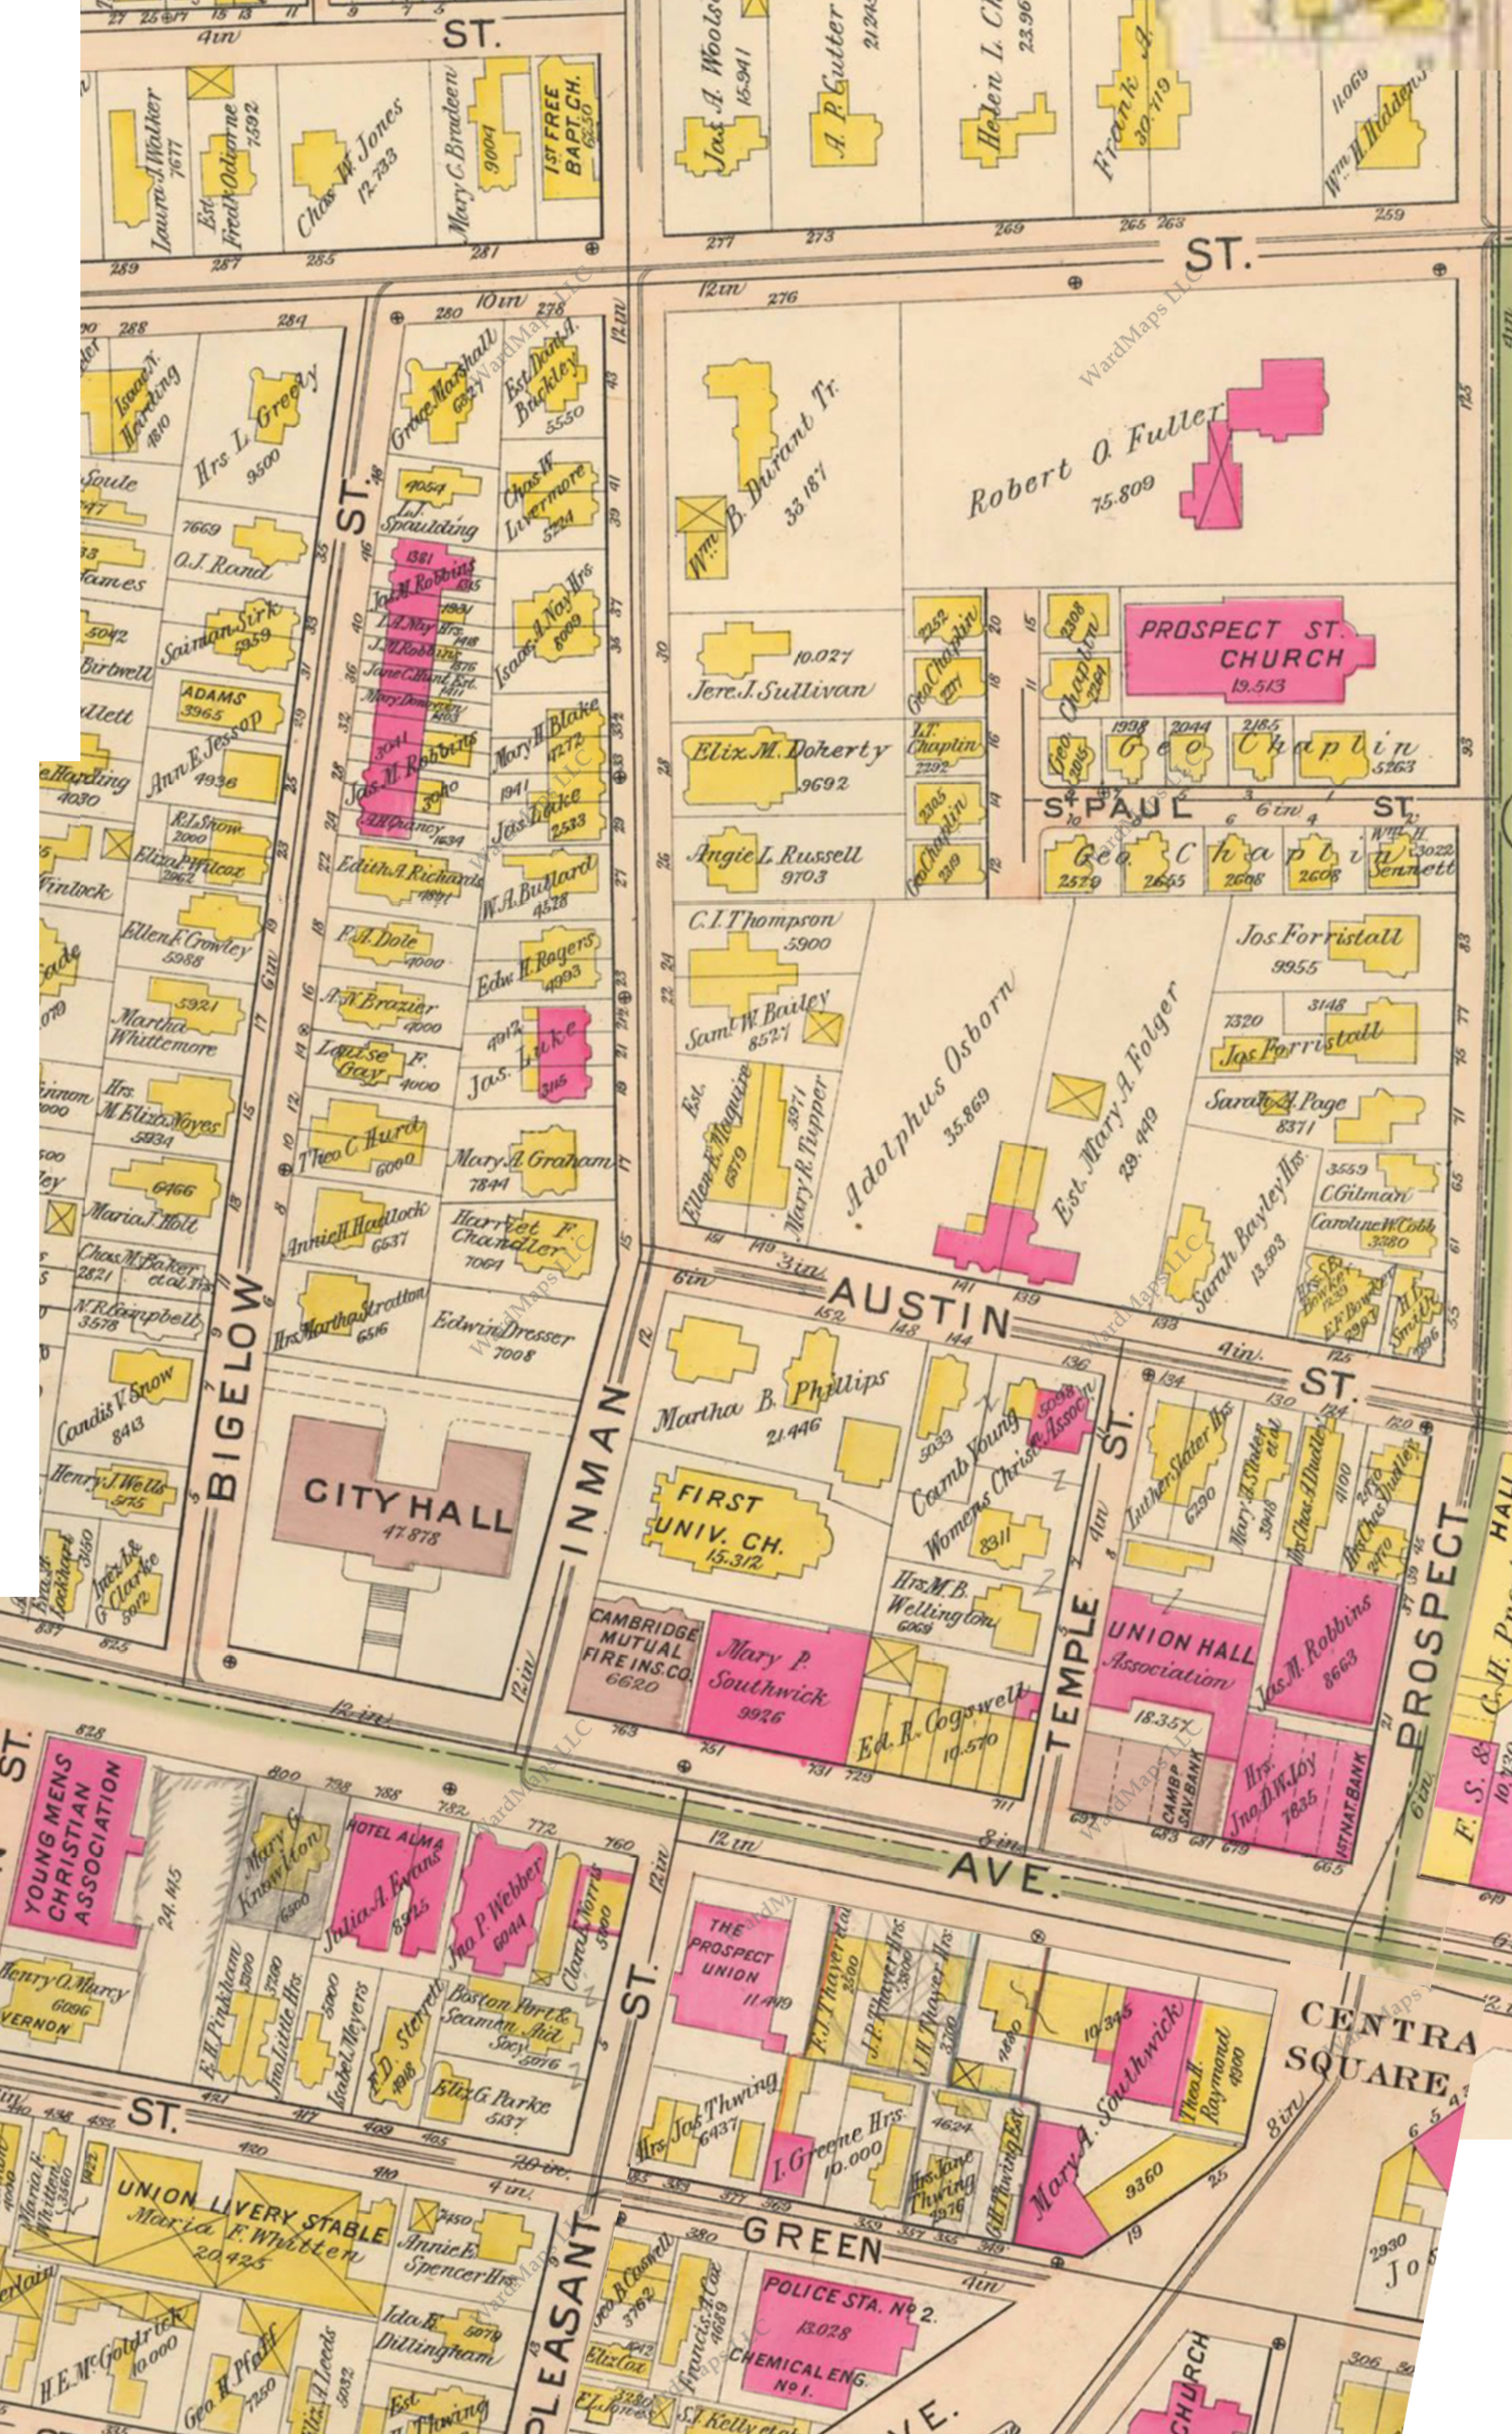 Figure 7: Map from 1903 Bromley Atlas
 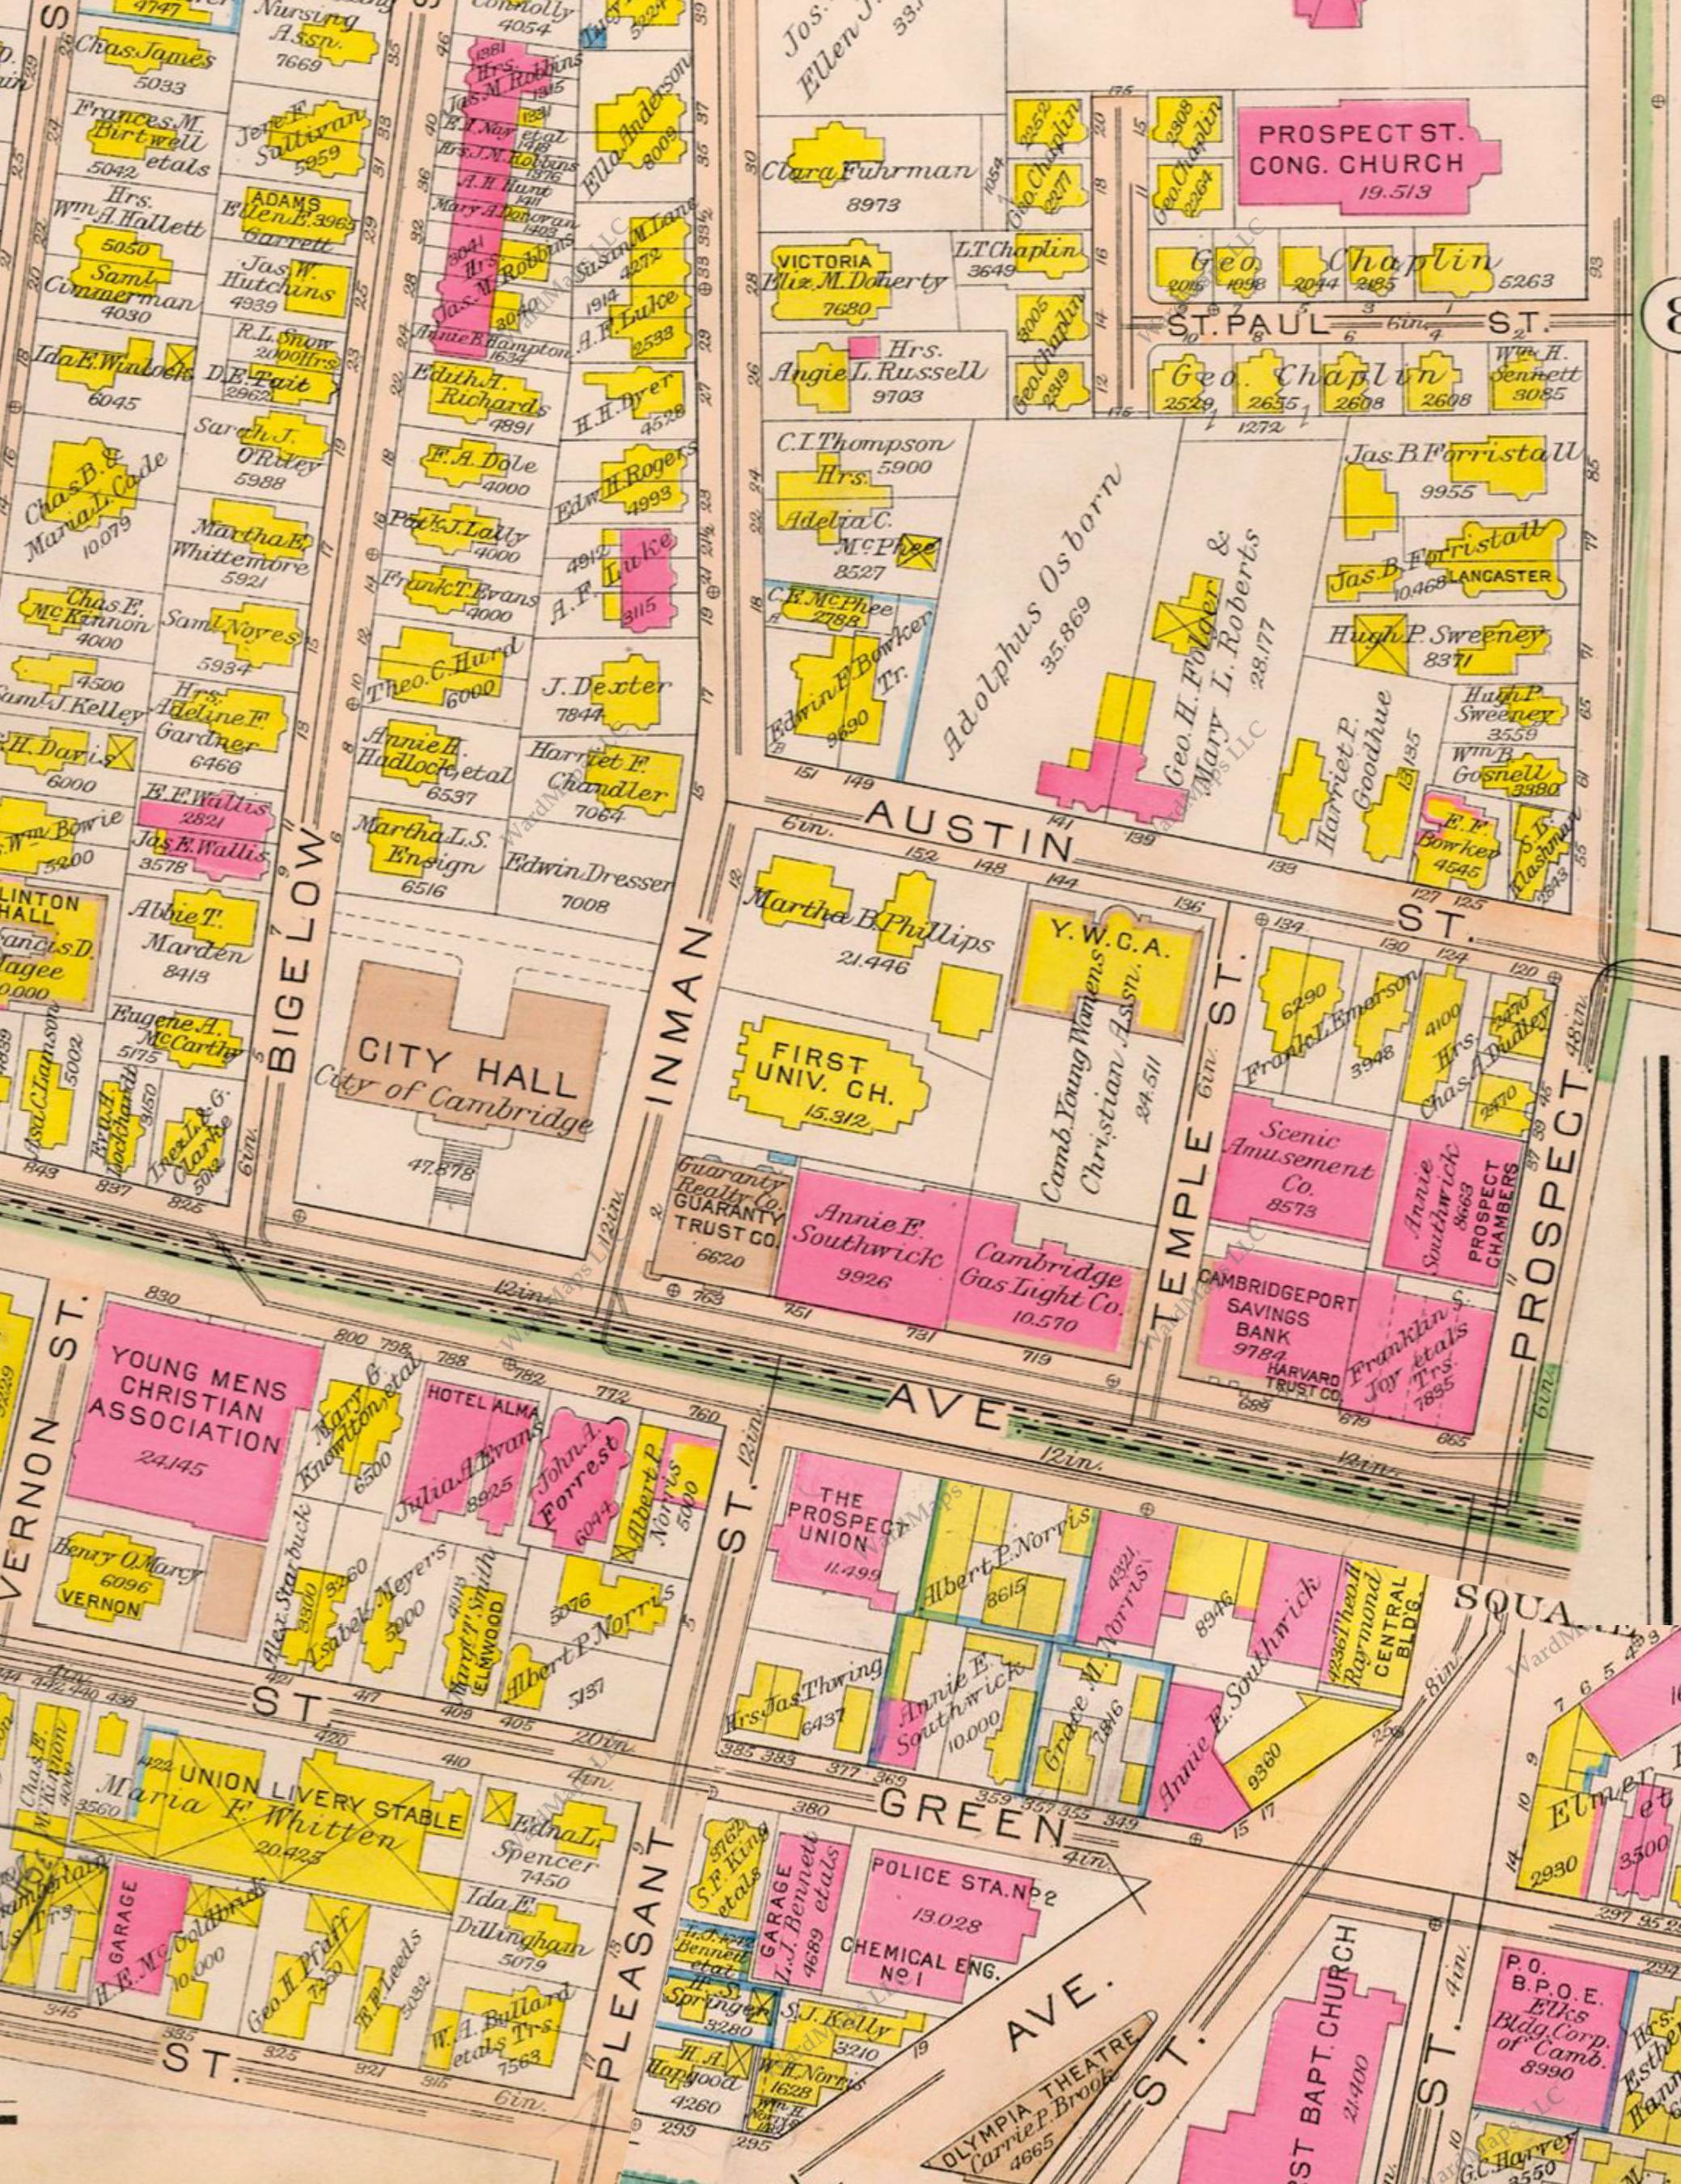 Figure 8: Map from 1916 Bromley Atlas. Can see a clear trend of buildings around Central Square getting bigger and moving from small shops, to larger scale businesses and institutions.
 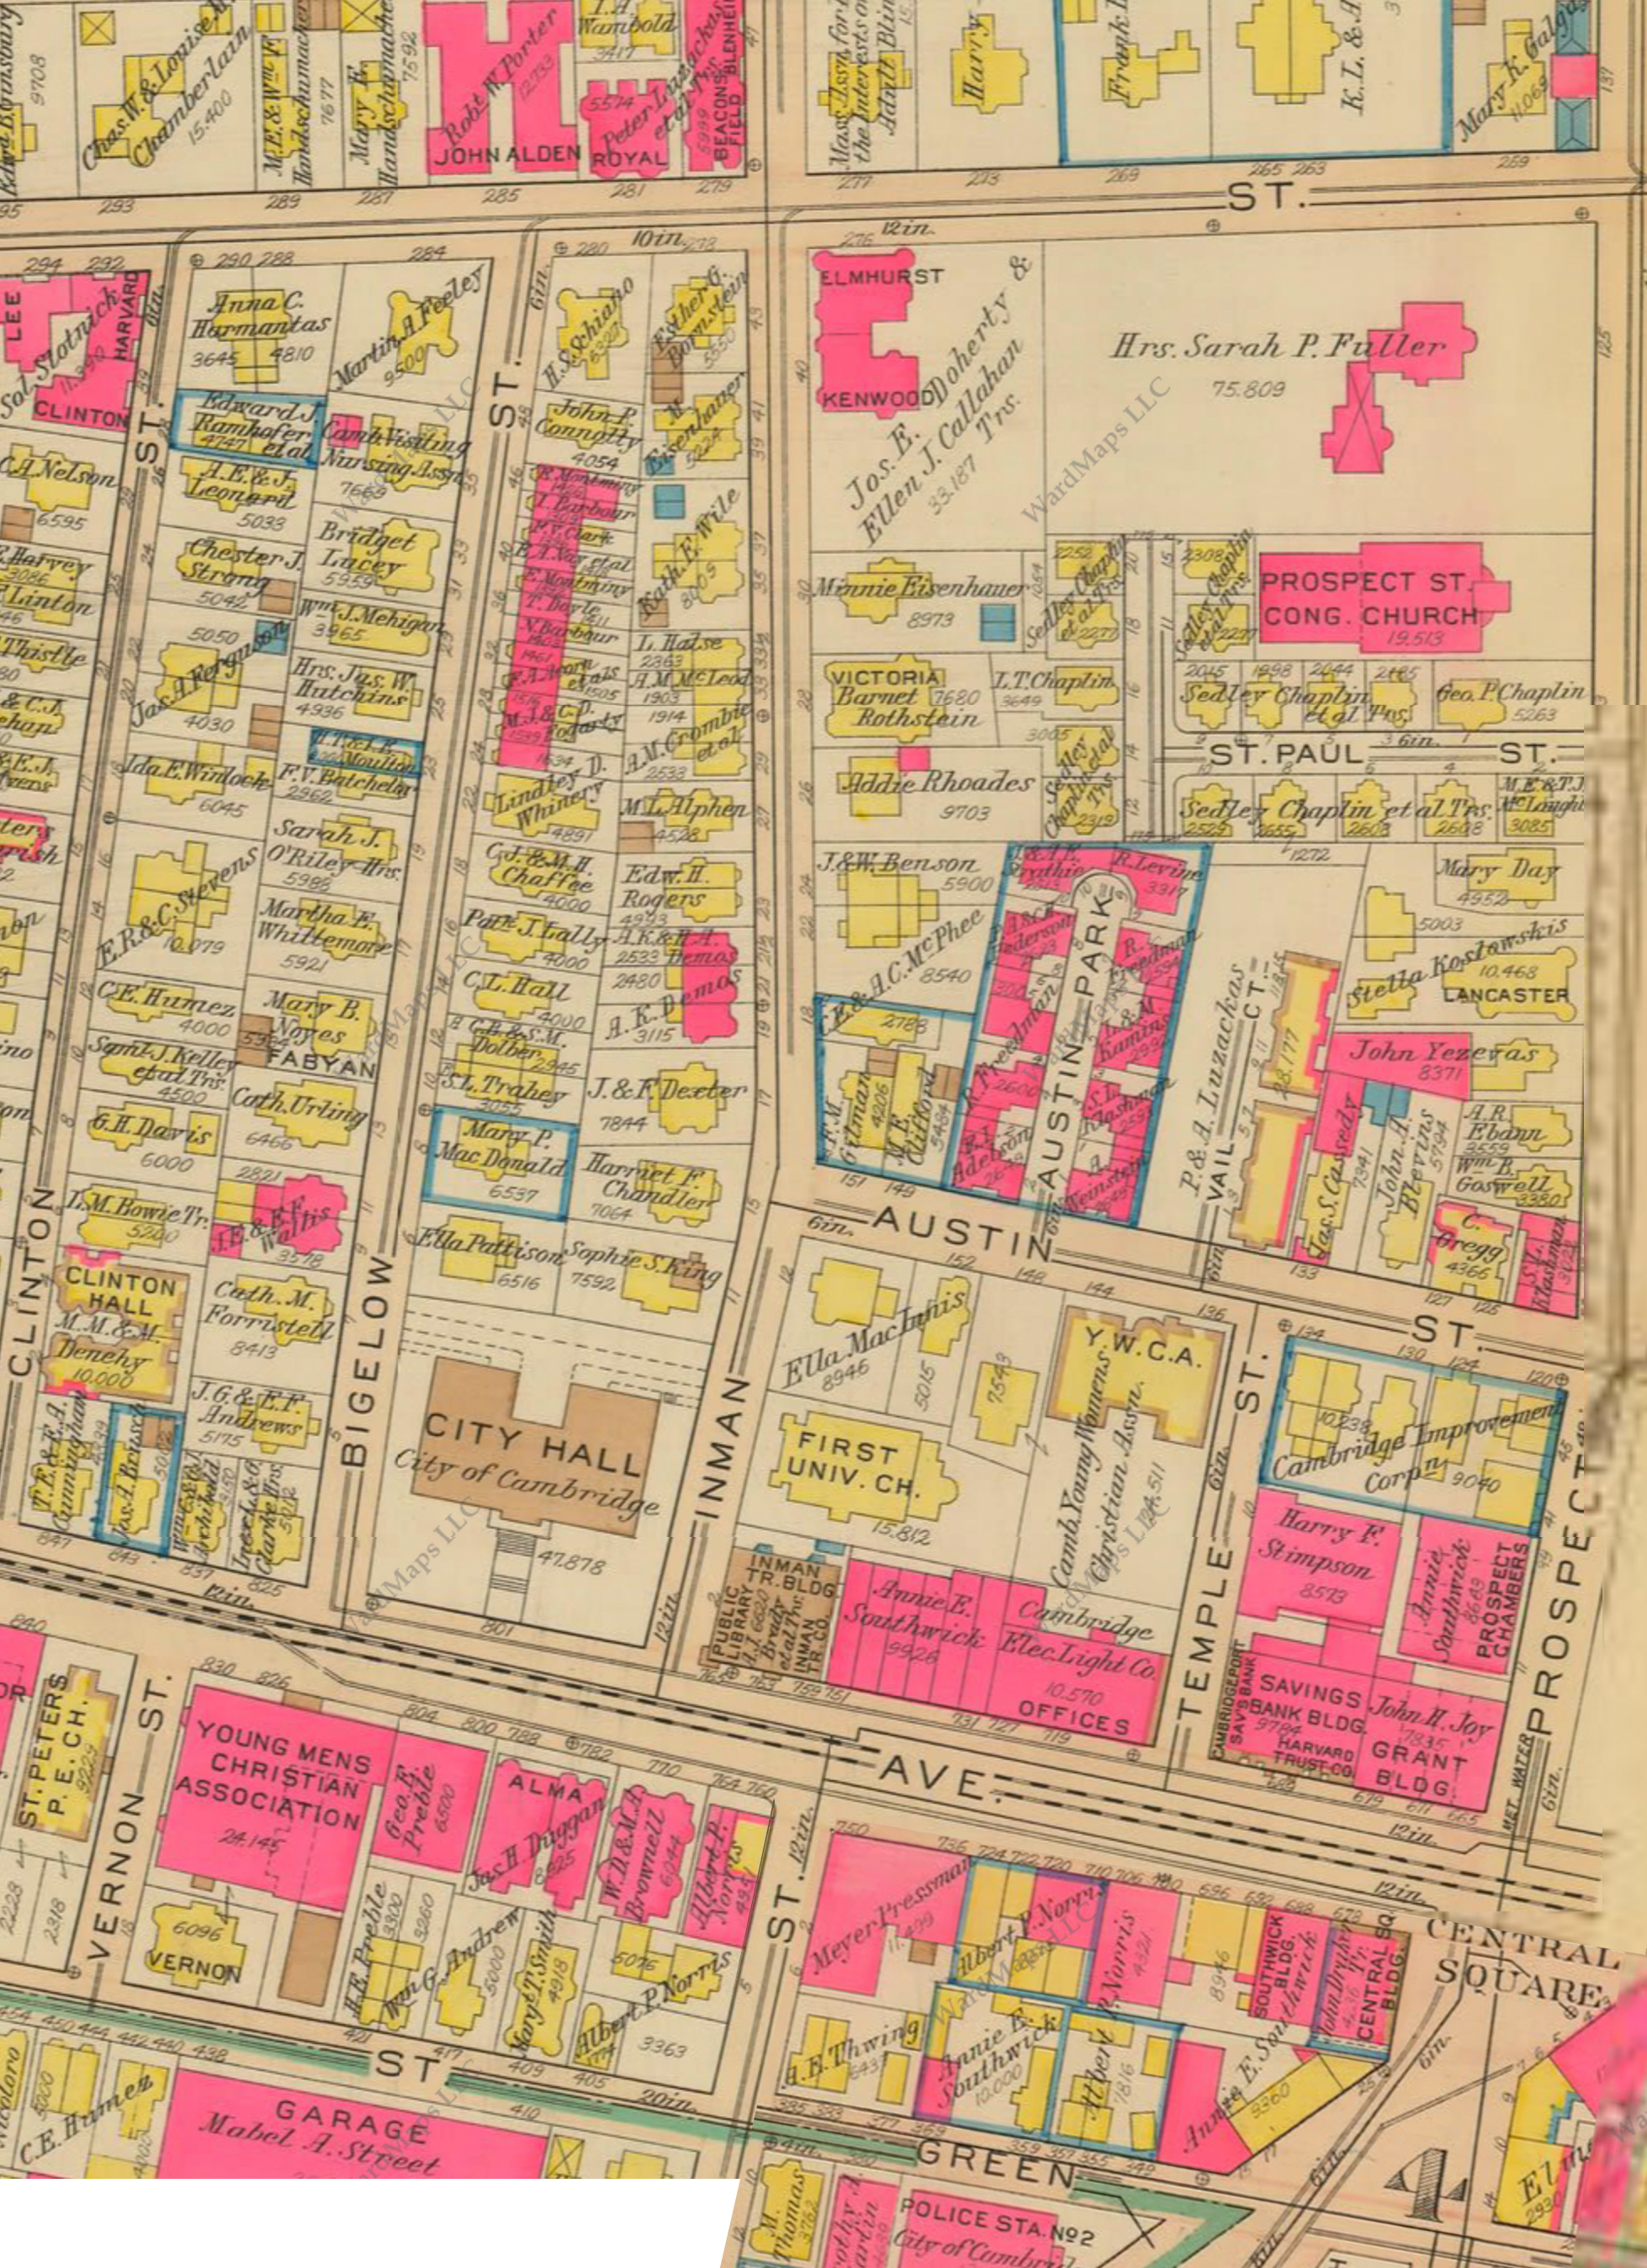 Figure 9: Map from 1930 Bromley Atlas. Shows an increase in density, both in residential and commercial areas.
 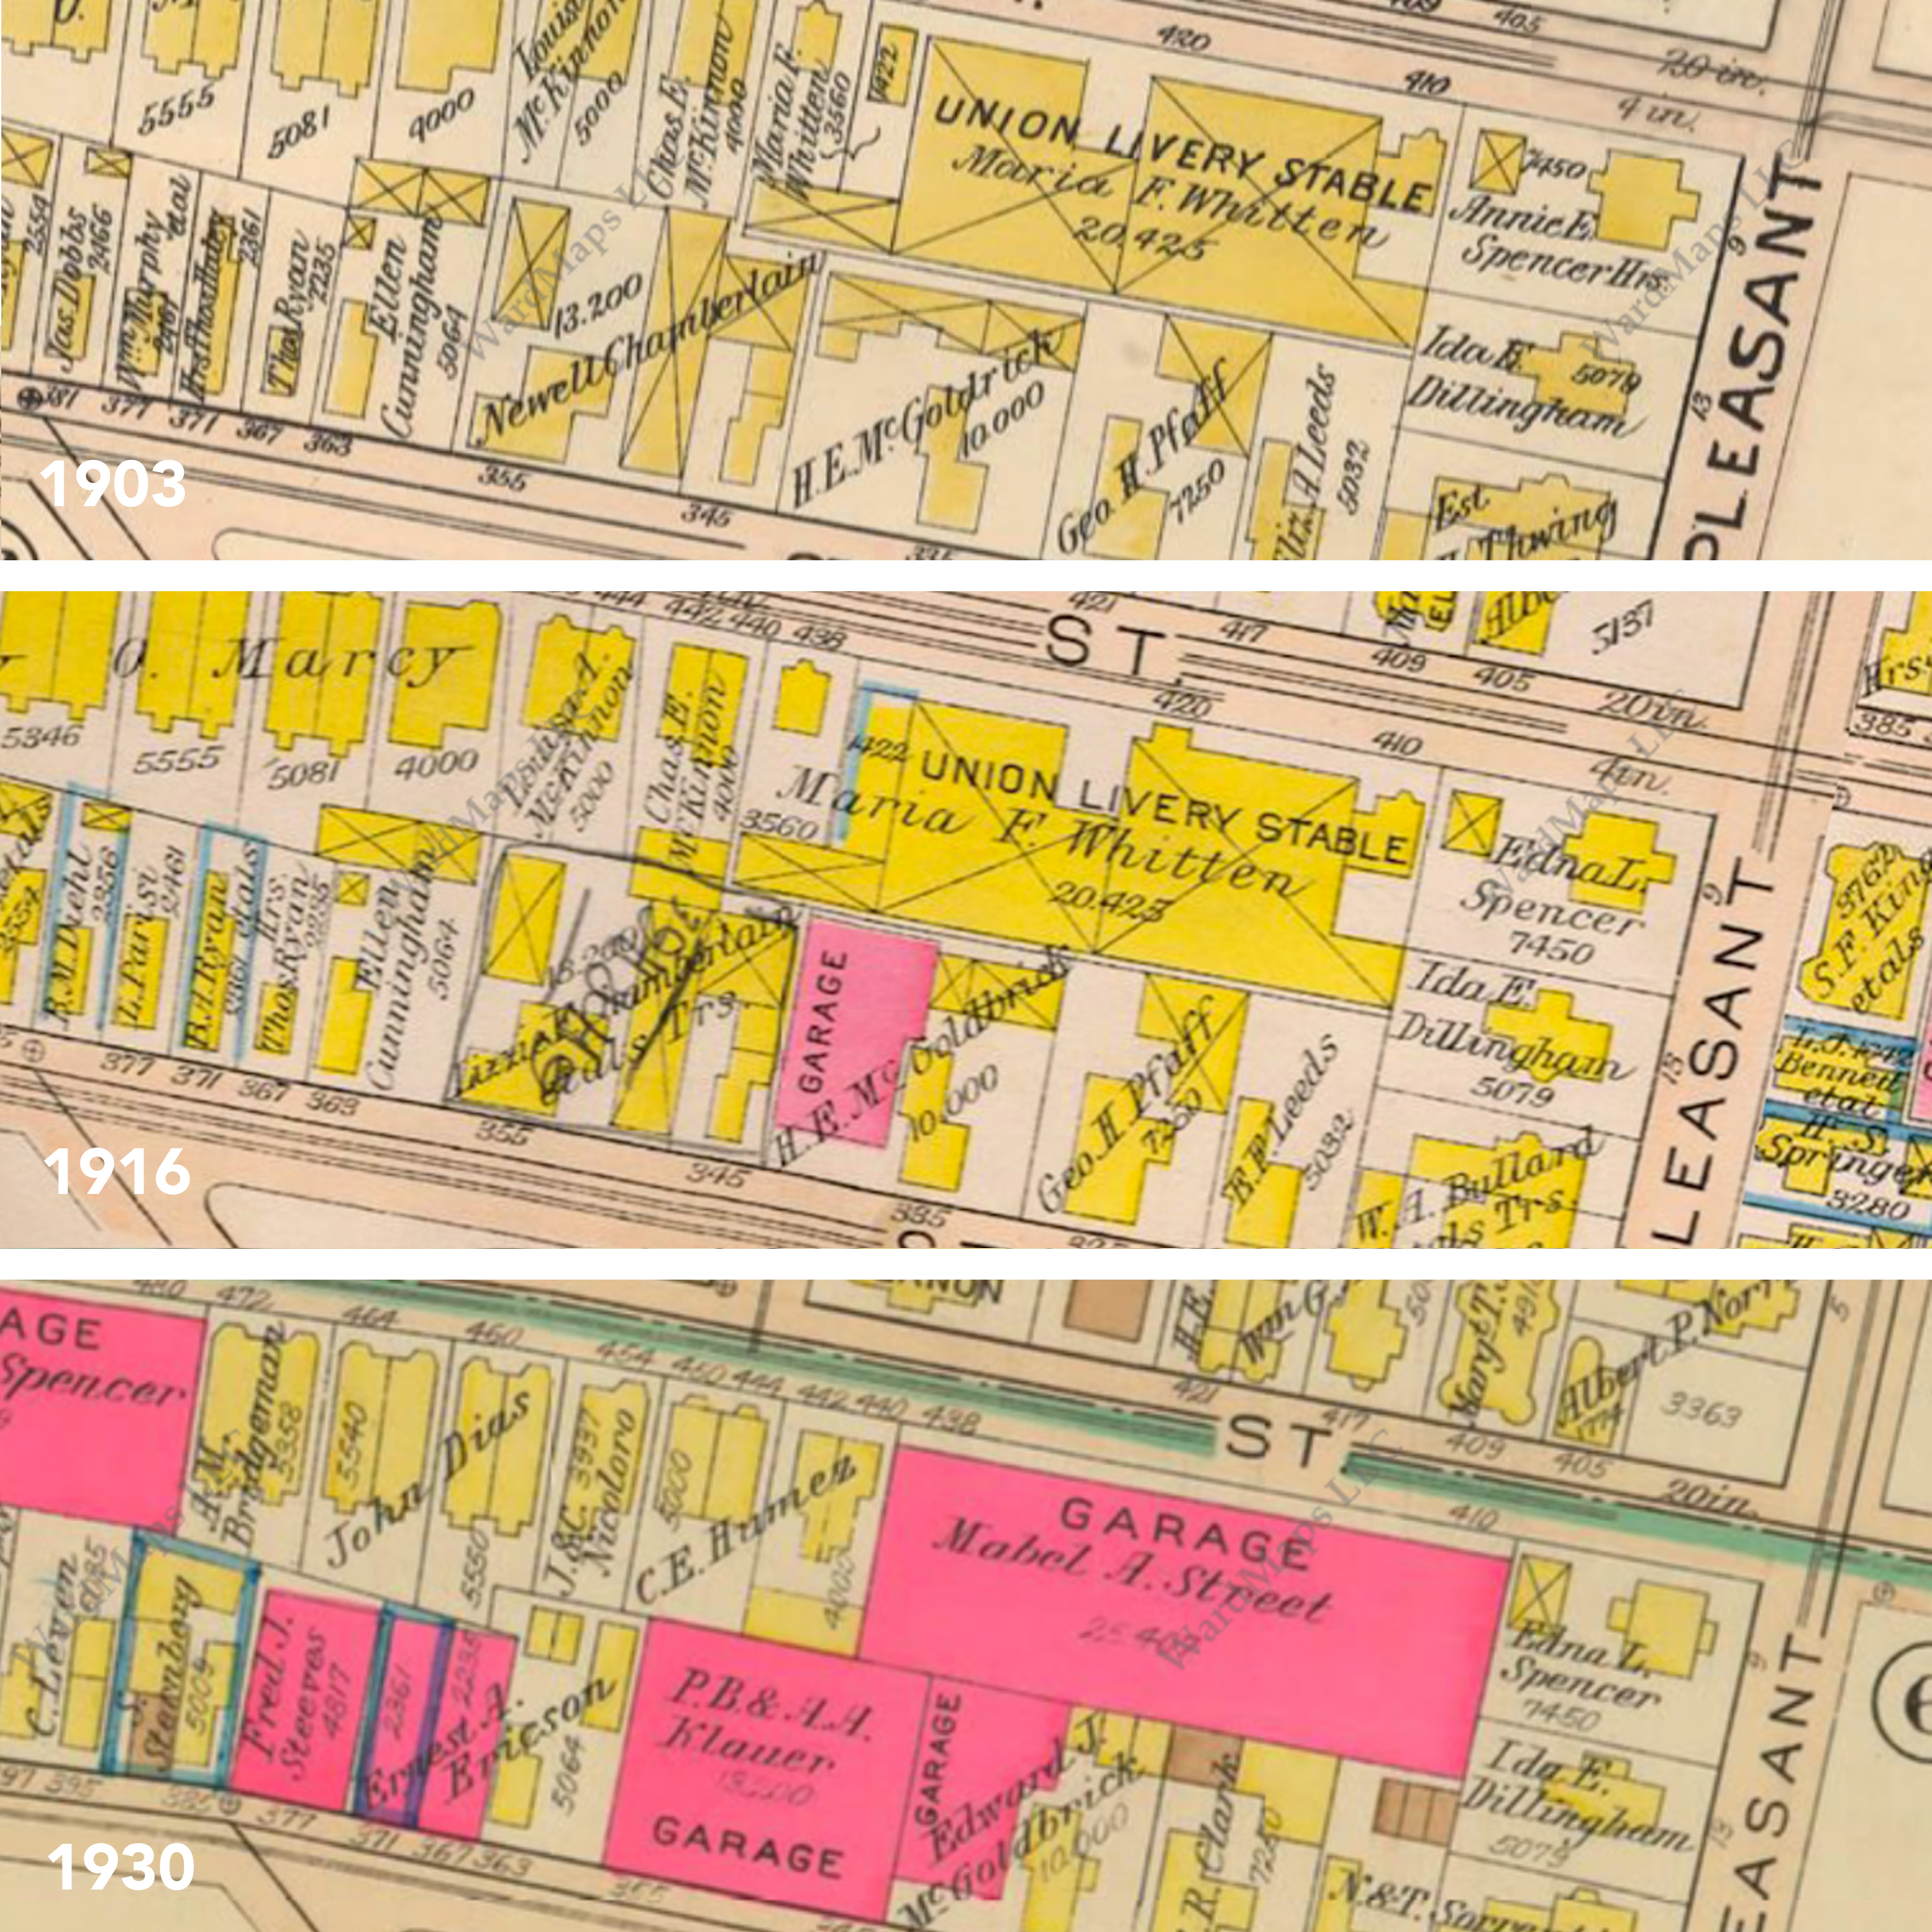 Figure 10: Comparing a single section of the Above Bromley maps in 1903, 1916, and 1930 shows the transition from horse-driven transportation methods to the automobile in the early 20th century.
 ___
___
___
___
___
With property values outside of Boston likely being cheaper than within the city, these transit systems allowed Cambridge as a whole to expanded more residentially rather than commercially while accessing jobs in the more commercial-oriented Boston, a key factor in its early identity as a commuter suburb (Jackson, 21).
The rapid changes in transportation systems are indicative of larger changes in technology and industry that were happening all across different sectors of the Cambridge economy. In 1900 Central Square had many small-scale single story local shops and businesses. There was a locksmith, plumber, laundry, printer, carpenter, general supply stores, a bank and insurance company, as seen in the 1900 Sanborn Map (Figure 11). These are the kinds of commercial businesses necessary for a town center by by the 1930s the businesses in the area expanded beyond necessity and became more suggestive of an downtown business/commercial zone in a city than a suburb. In the 1934 Sanborn map (Figure 12), this is shown as the banks and insurance company buildings become larger and more prominent, taller office buildings come into the area, and large regional businesses like the Cambridge Gas Light Company take a prominent position among the rest.
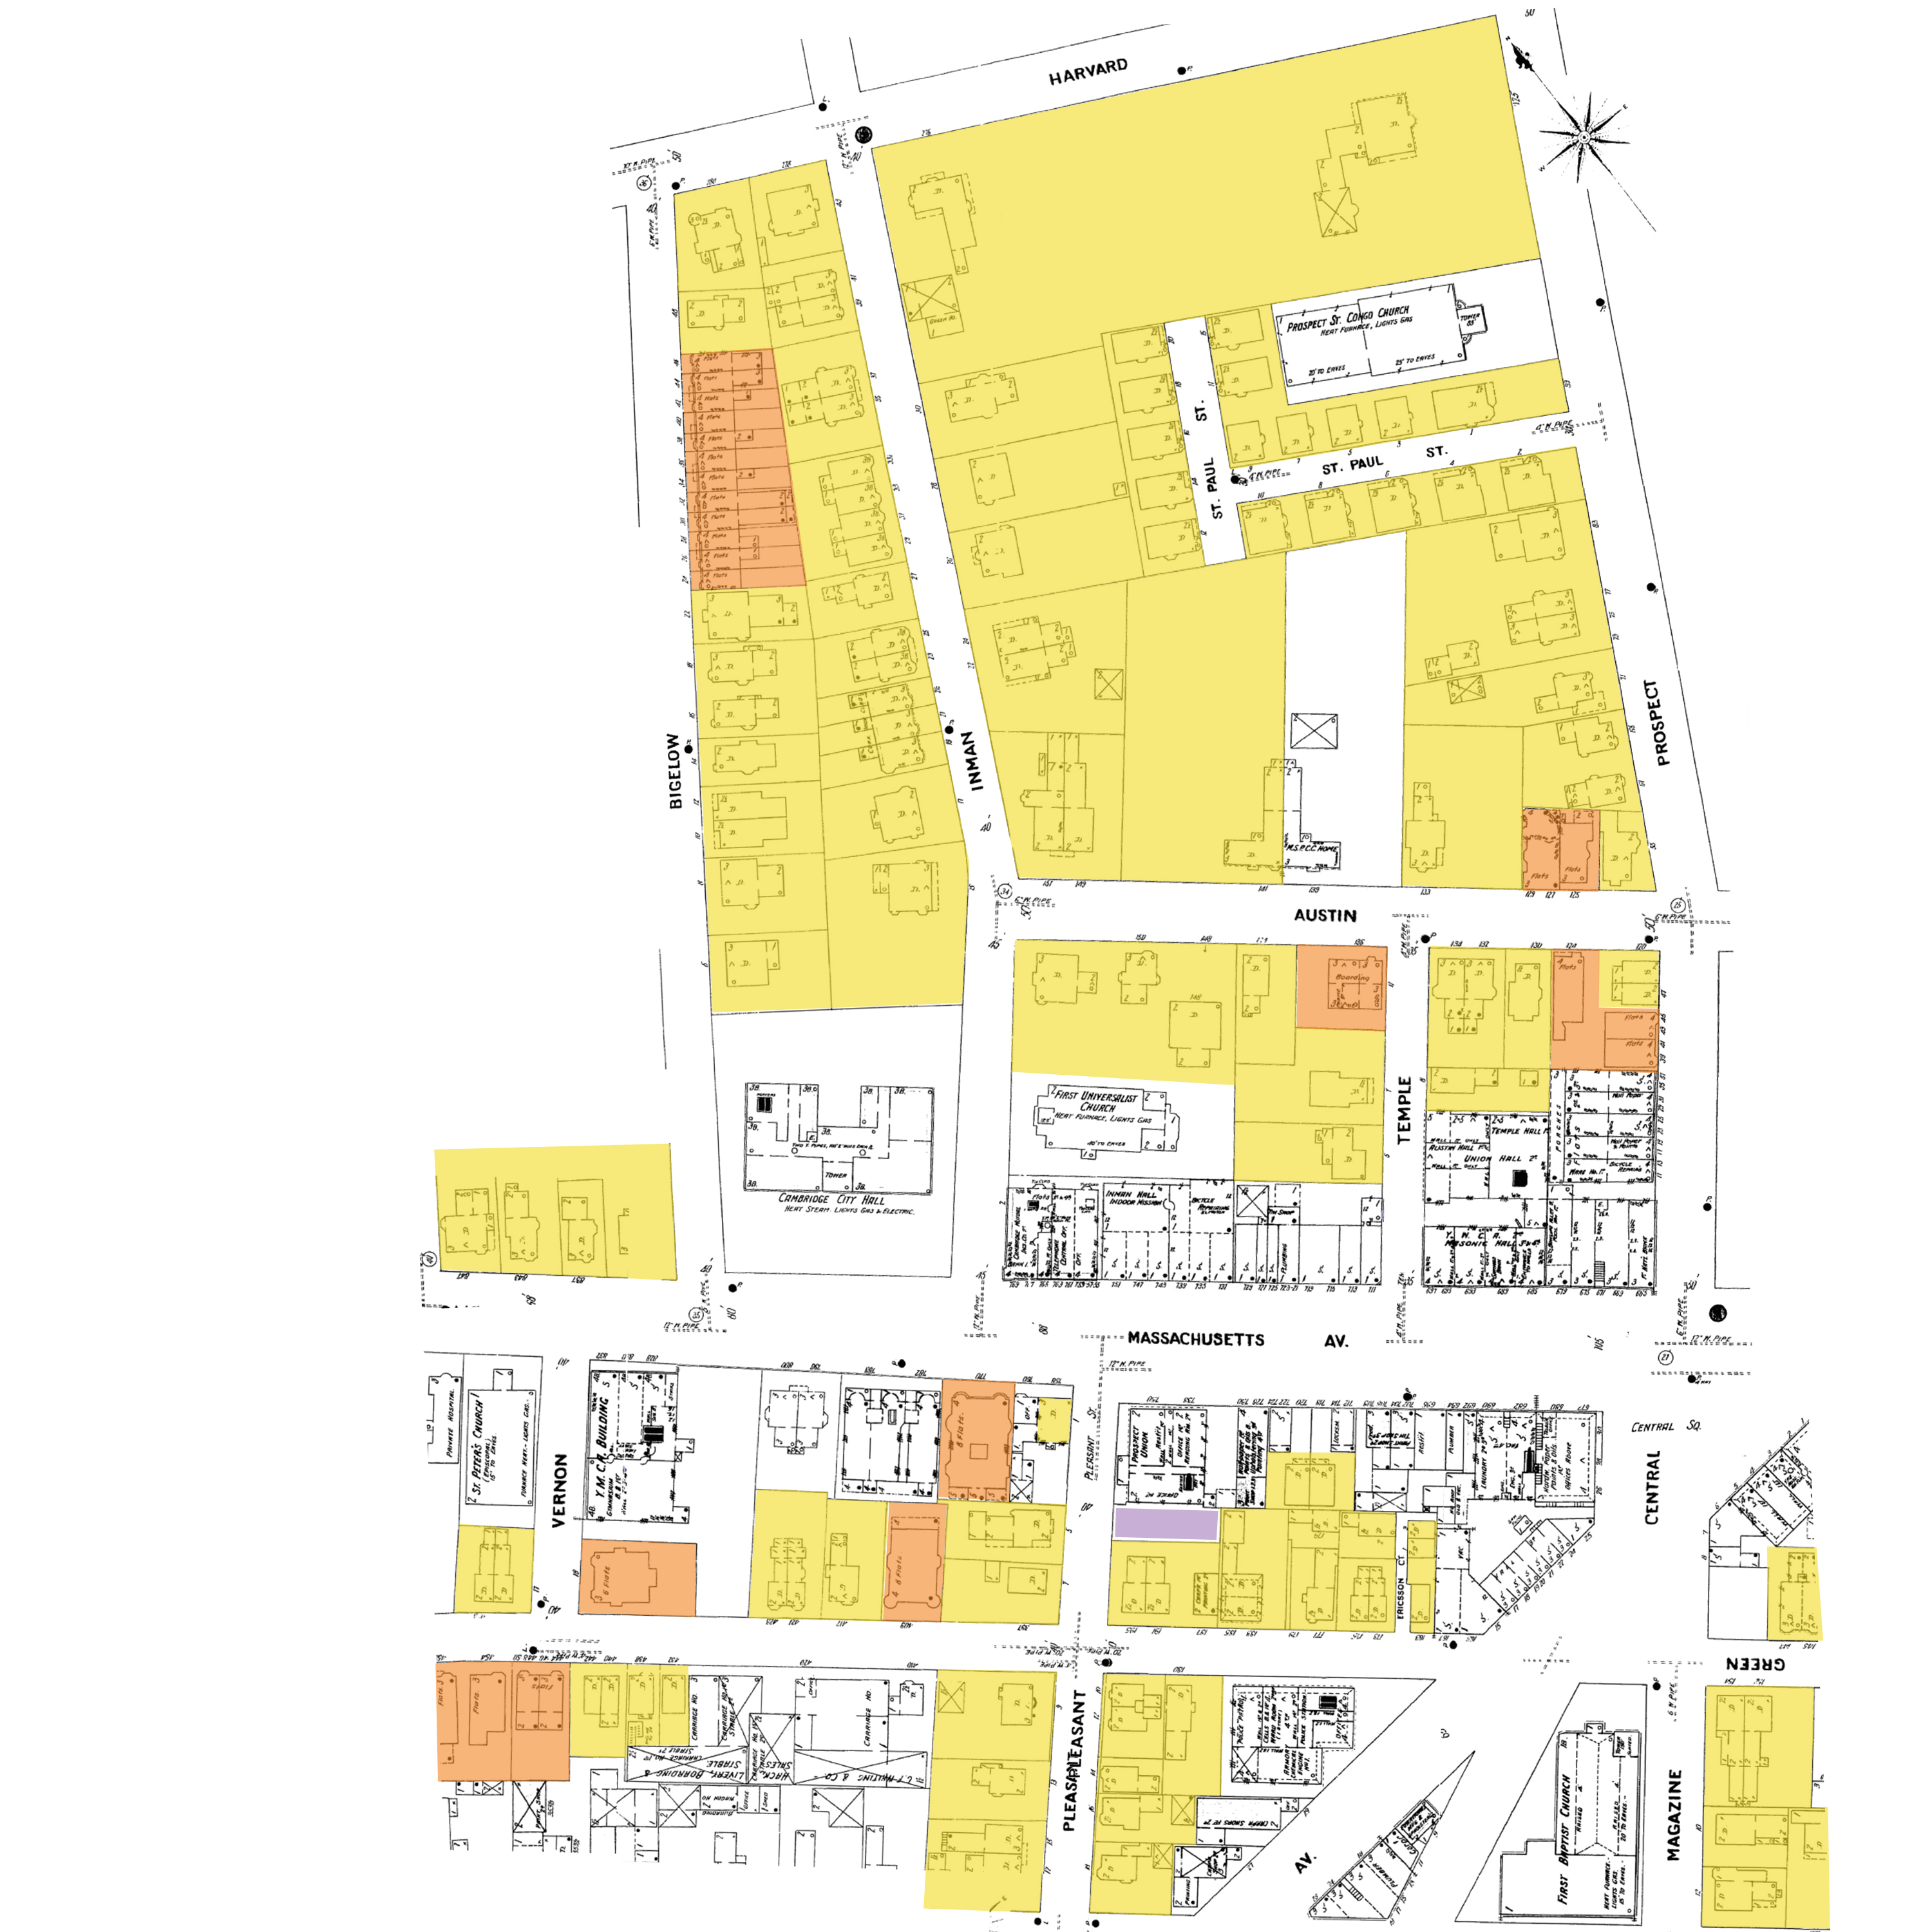 Figure 11: Map of site in 1900 from a Sanborn Atlas. Yellow represents properties with single-family dwellings. Orange represents properties with flats, apartments, rooms, etc. Purple represents both parking lots and entire plots of land that are not developed.
 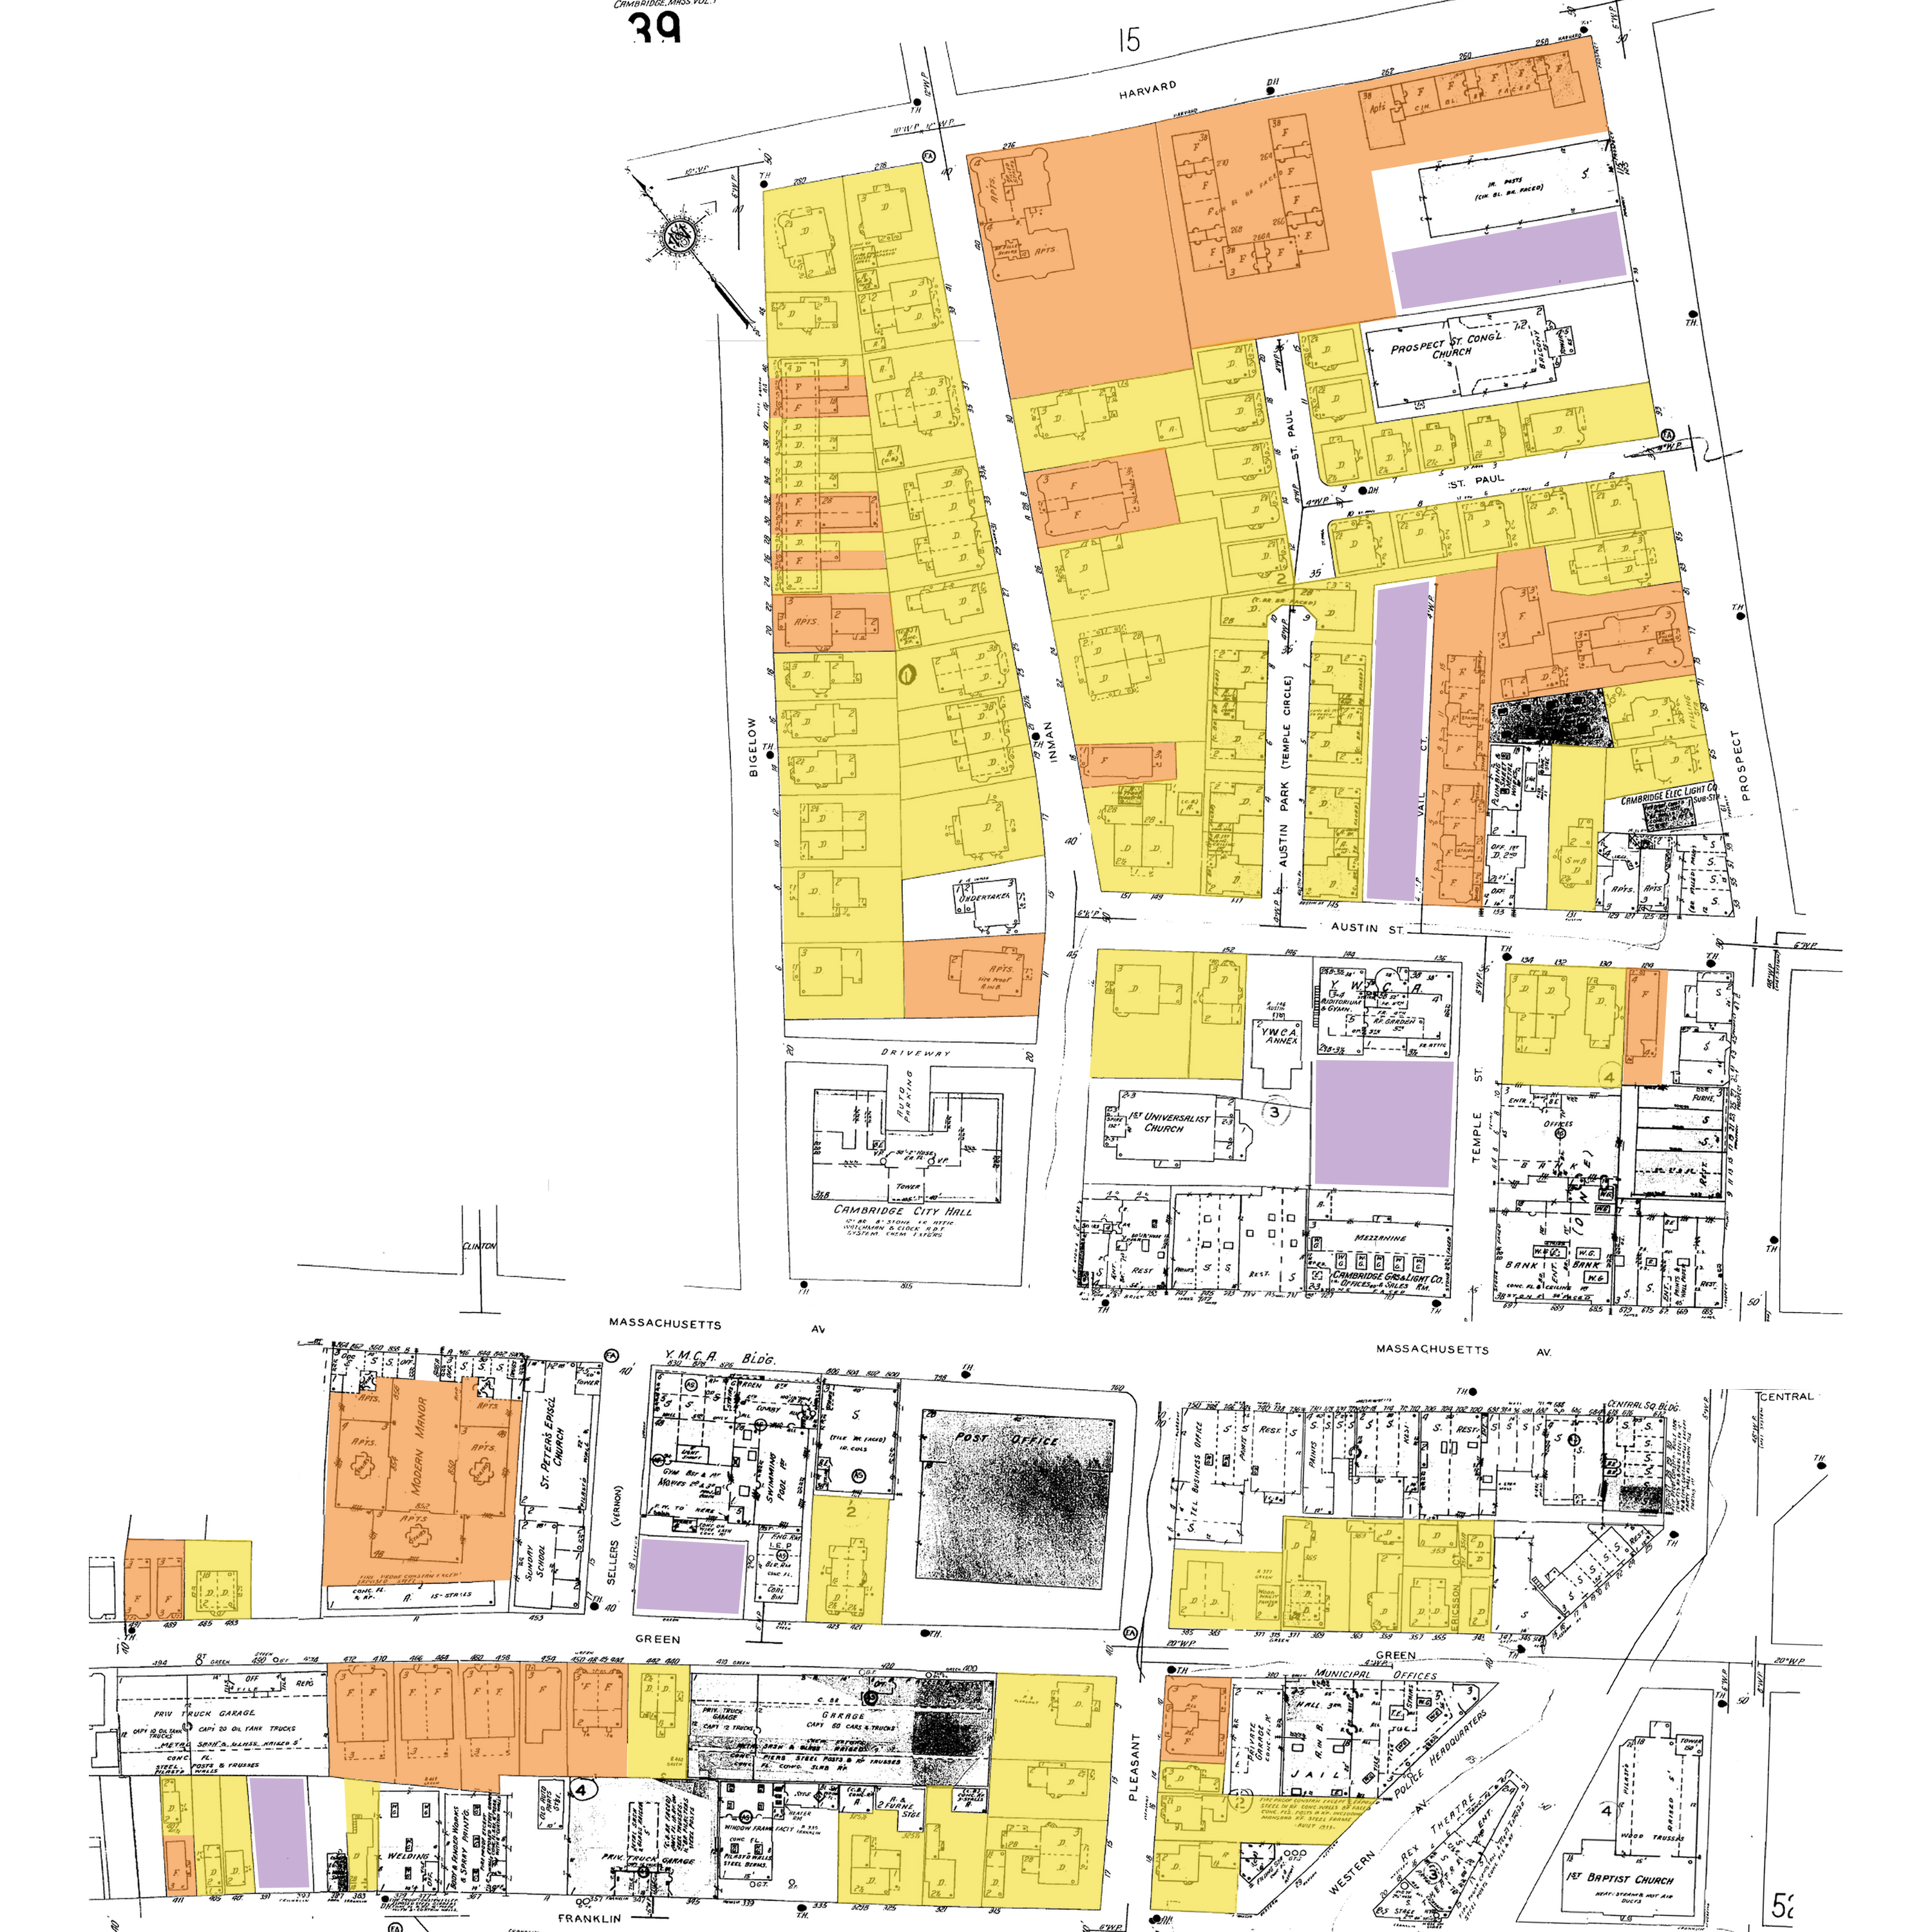 Figure 12: A 1934 Sanborn atlas. Color change shows an increase in parking lots/empty spaces and an increase in housing density in the area.
 Growing and Changing Populations
At the time of Cambridge’s incorporation the city’s population was 12,500. About 50 years later in 1900, that number grew to about 92,000 (Census Data). Starting in the mid 20th Century, thousands of immigrants from Europe moved to Boston and Cambridge (Waymarking). On my site this change can be seen, not only an increase in the number of residences, but also in the names of property owners that change over time. In the 1886 pretty much all the property owners on my site have English surnames such as Davis, Holmes, Tilton, Folger, Jones, Fuller and Bayley (Figure 5). However, by 1930 the names of the property owners become significantly more diverse with Irish and Scottish names such as O’Riley, Mac Donald and Mac Innis, and Eastern European names such as Luzackas, Yezevas, and Koslowski (Figure 9). It is likely that many moved to the Cambridge Port area to work in the local factories that lie just outside by site, by the charles river, broad canal, and railroad tracks. This influx of immigrants from around the world spurred the construction of new houses as well as clubs and churches of all different denominations.
These changes can be seen best in the residential neighborhood that surrounds the commercial area on Front Street/Mass Ave. While the land was fairly developed as early as 1873 (Figure 5) with a mixture of single family homes, duplexes, rowhouses, and some slightly larger estates, density in the area increased fairly steadily throughout the next half century. In the 19th century, with few exceptions, most properties in my site are owned by individual owners and not rented out. This trend is broken however, when by 1900 Saint Paul Street is constructed and what was once a very large single family property gets turning into seventeen single family dwellings on a new inlet off Prospect Street (Figure 11). These homes are not much smaller than the average home on Inman and Bigelow Streets, but the increased density is indicative of increased property values as more people move try to move to the central square area. This trend continues and by the 1930s, even within the same block, two more similar inlets are constructed off Austin Street, Austin Park with larger single-family dwellings similar and Vail Court with more cramped stacked flats, as well as three larger multiple-story apartment buildings on Harvard Street, as seen on the 1934 Sanborn map (Figure 12).
It is hard to tell what internal or external factors caused such a change. It is possible that as Cambridge grew, it became less of a suburban compromise between town and country and this newly increased urbanity in the Central Square area was not been appealing to the families with large lots who may have decided to move to more suburban areas and sell their land. Alternatively, the Great Depression starting in 1929 could have hit these land owning families hard and forced them to sell their properties which were then developed into more affordable lower-income homes.
A Faded Downtown
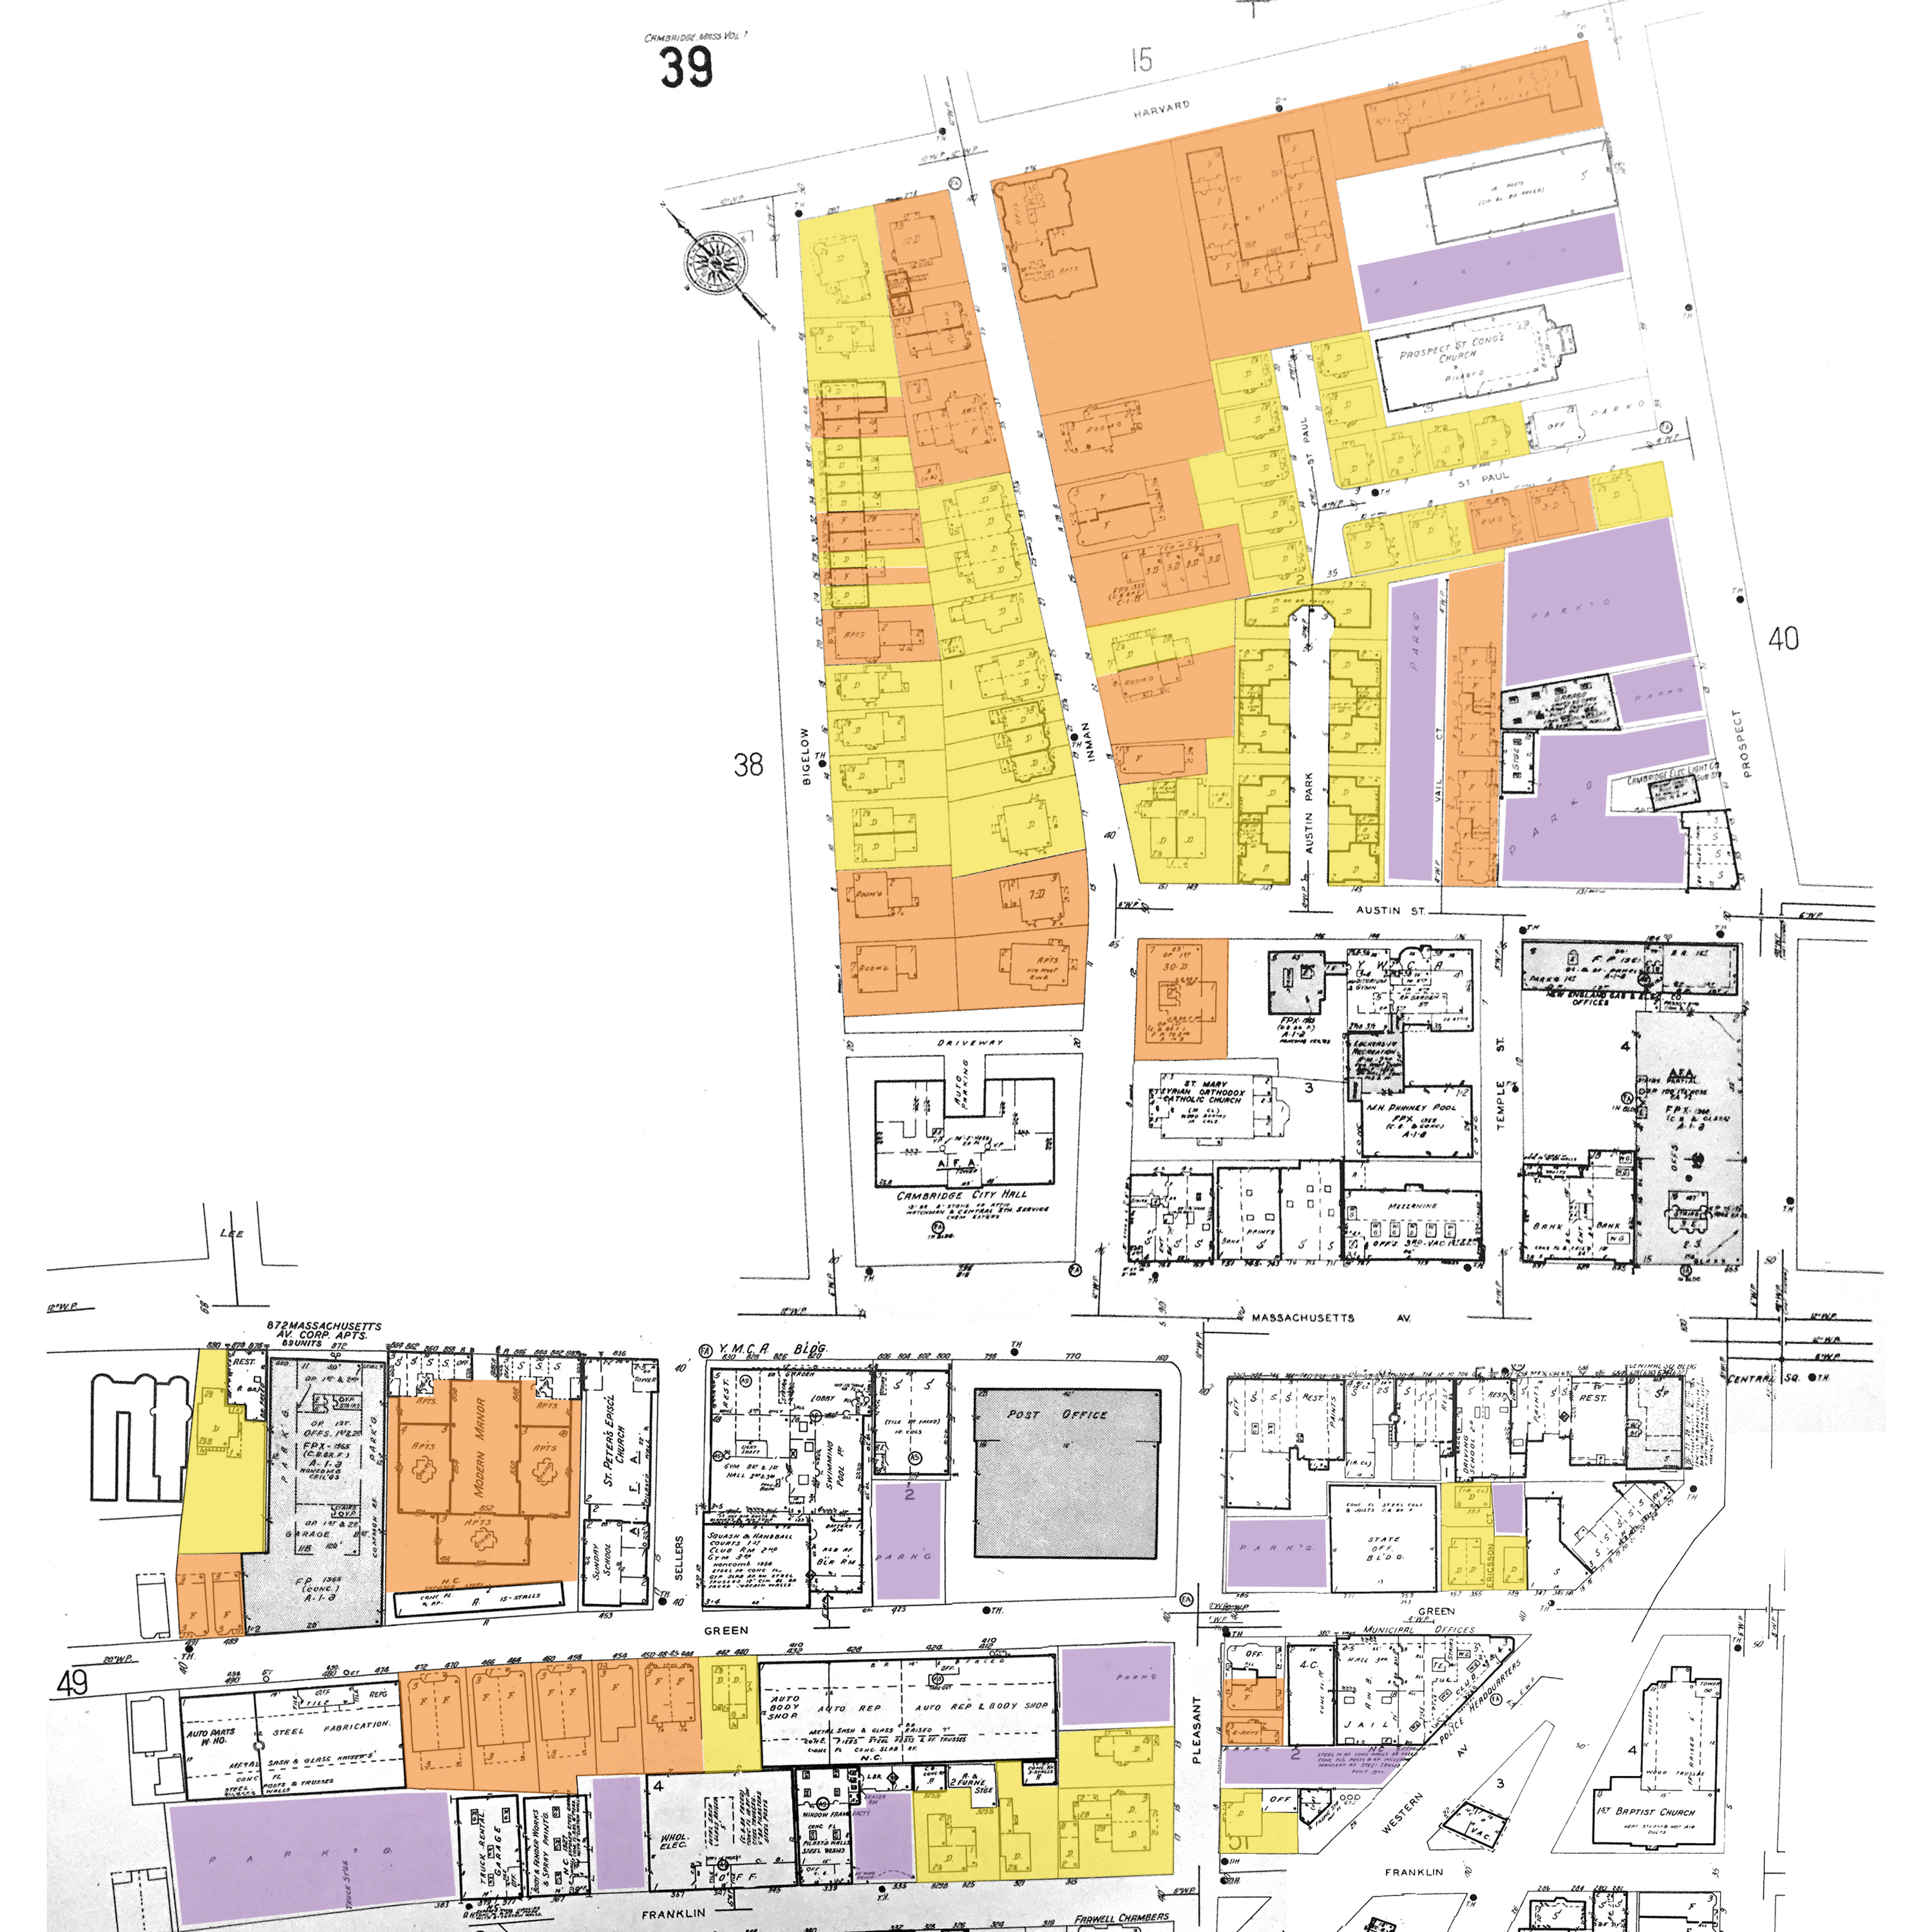 Figure 13: 1970 Sanborn Atlas shows little growth in the last 50 years but an increase in lots and density.
 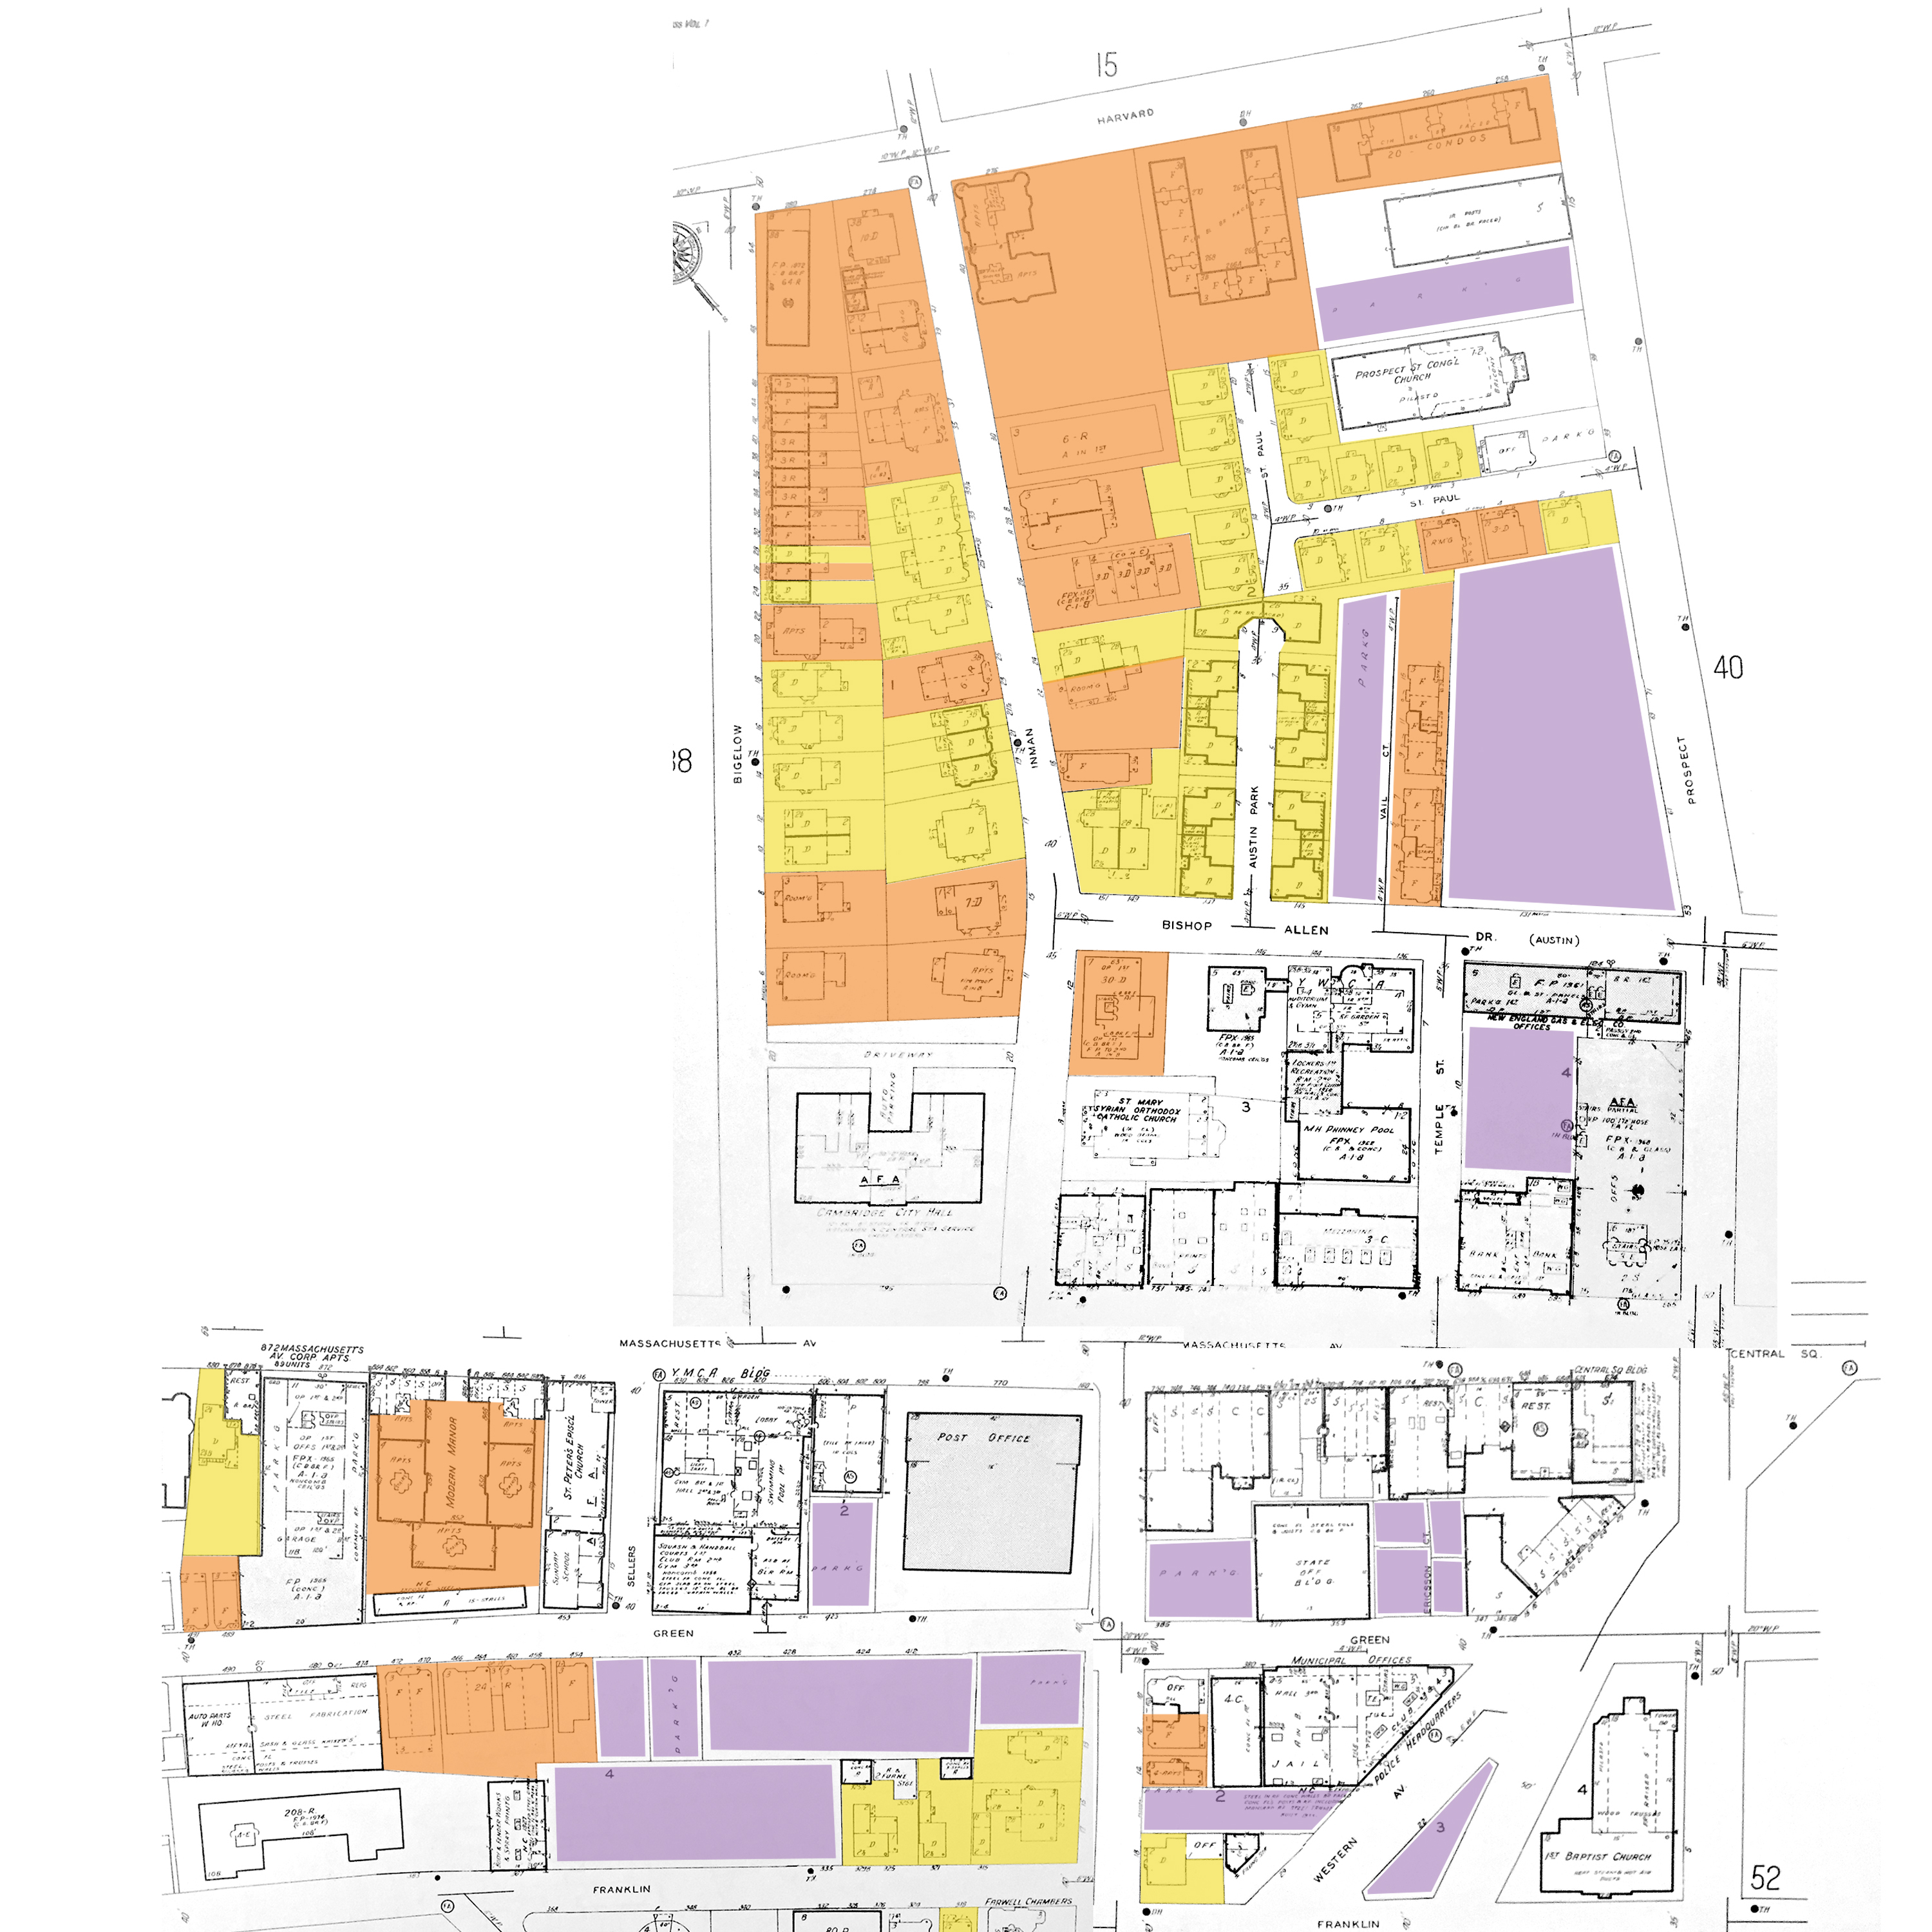 Figure 14: 1988 Sanborn Atlas shows even more lots in the neighborhood as buildings are demolished and not replaced.
 Between 1830s and 1970s there was very little change on my site. When comparing the 1934 and 1970 Sanborn maps, it seems that, with the exception of a couple larger buildings replacing some older houses and shops along Prospect Street, there was no major construction in this fifty-year time period. In fact, the most significant trend in the area is the demolishing of older buildings and lots that never got rebuilt on so that there is a significant increase in empty lots and parking lots. The Rex theater on Western and River street turned into an empty lot and many of the homes and apartments, especially on Prospect Street, were demolished and made into parking lots. Furthermore, in the 18 years between 1970 and 1988 nothing new was constructed on my site, as the 1988 Sanborn map shows, and even more building were demolished and more parking lot space was created. This trend, at least in part, likely has to do with the increased importance of the automobile in the latter part of the 20th century as between 1950 and 1980, the American population increased by 50 percent while the number of automobiles increased by 200 percent (Jackson, 246). But even still property development is generally more lucrative than a parking lot and this trend implies that property values in the area are decreasing significantly. Furthermore, another present trend at this time is the conversion of single dwelling homes into multiple apartments or rooms, something that seems to be happening both before and after 1970.
Between 1934 and 1988 there was the Great Depression as well as serious recessions in the 1970s and early 1980s. During the great depression it was common for property owners to reduce the height of multiple-story buildings in order to reduce their property tax burden. This phenomenon happened in parts of central square, leaving the Square less architecturally unified (7, 18). Furthermore, following World War II there was a general trend across the country of people moving out of cities and into suburbs and many industries that previously offered employment during the war declined. The combination of these factors could have lead Central Square into an economic decline with vacant lots, houses, offices, and storefronts.
Central Square Today
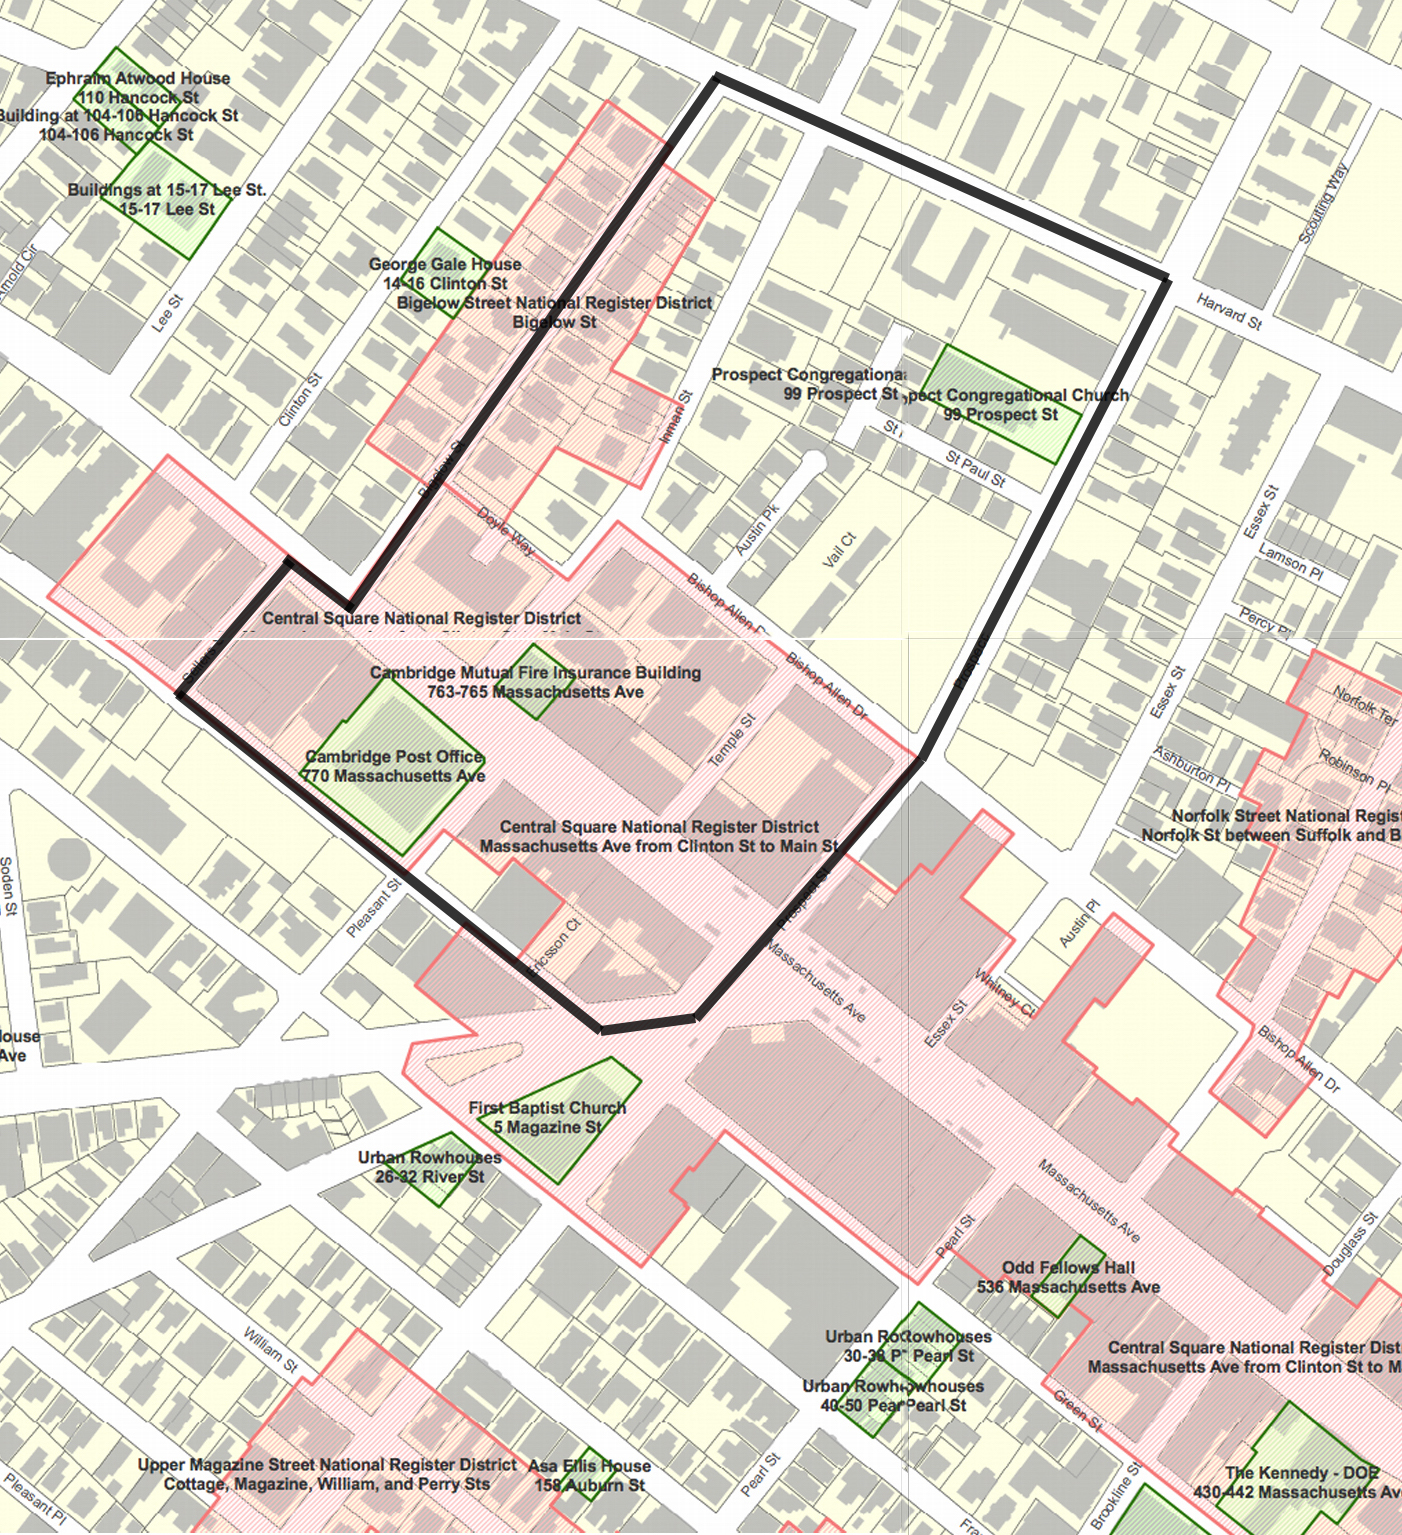 Figure 15: Map of historic zoned areas and buildings in the Central Square area and within my site.
 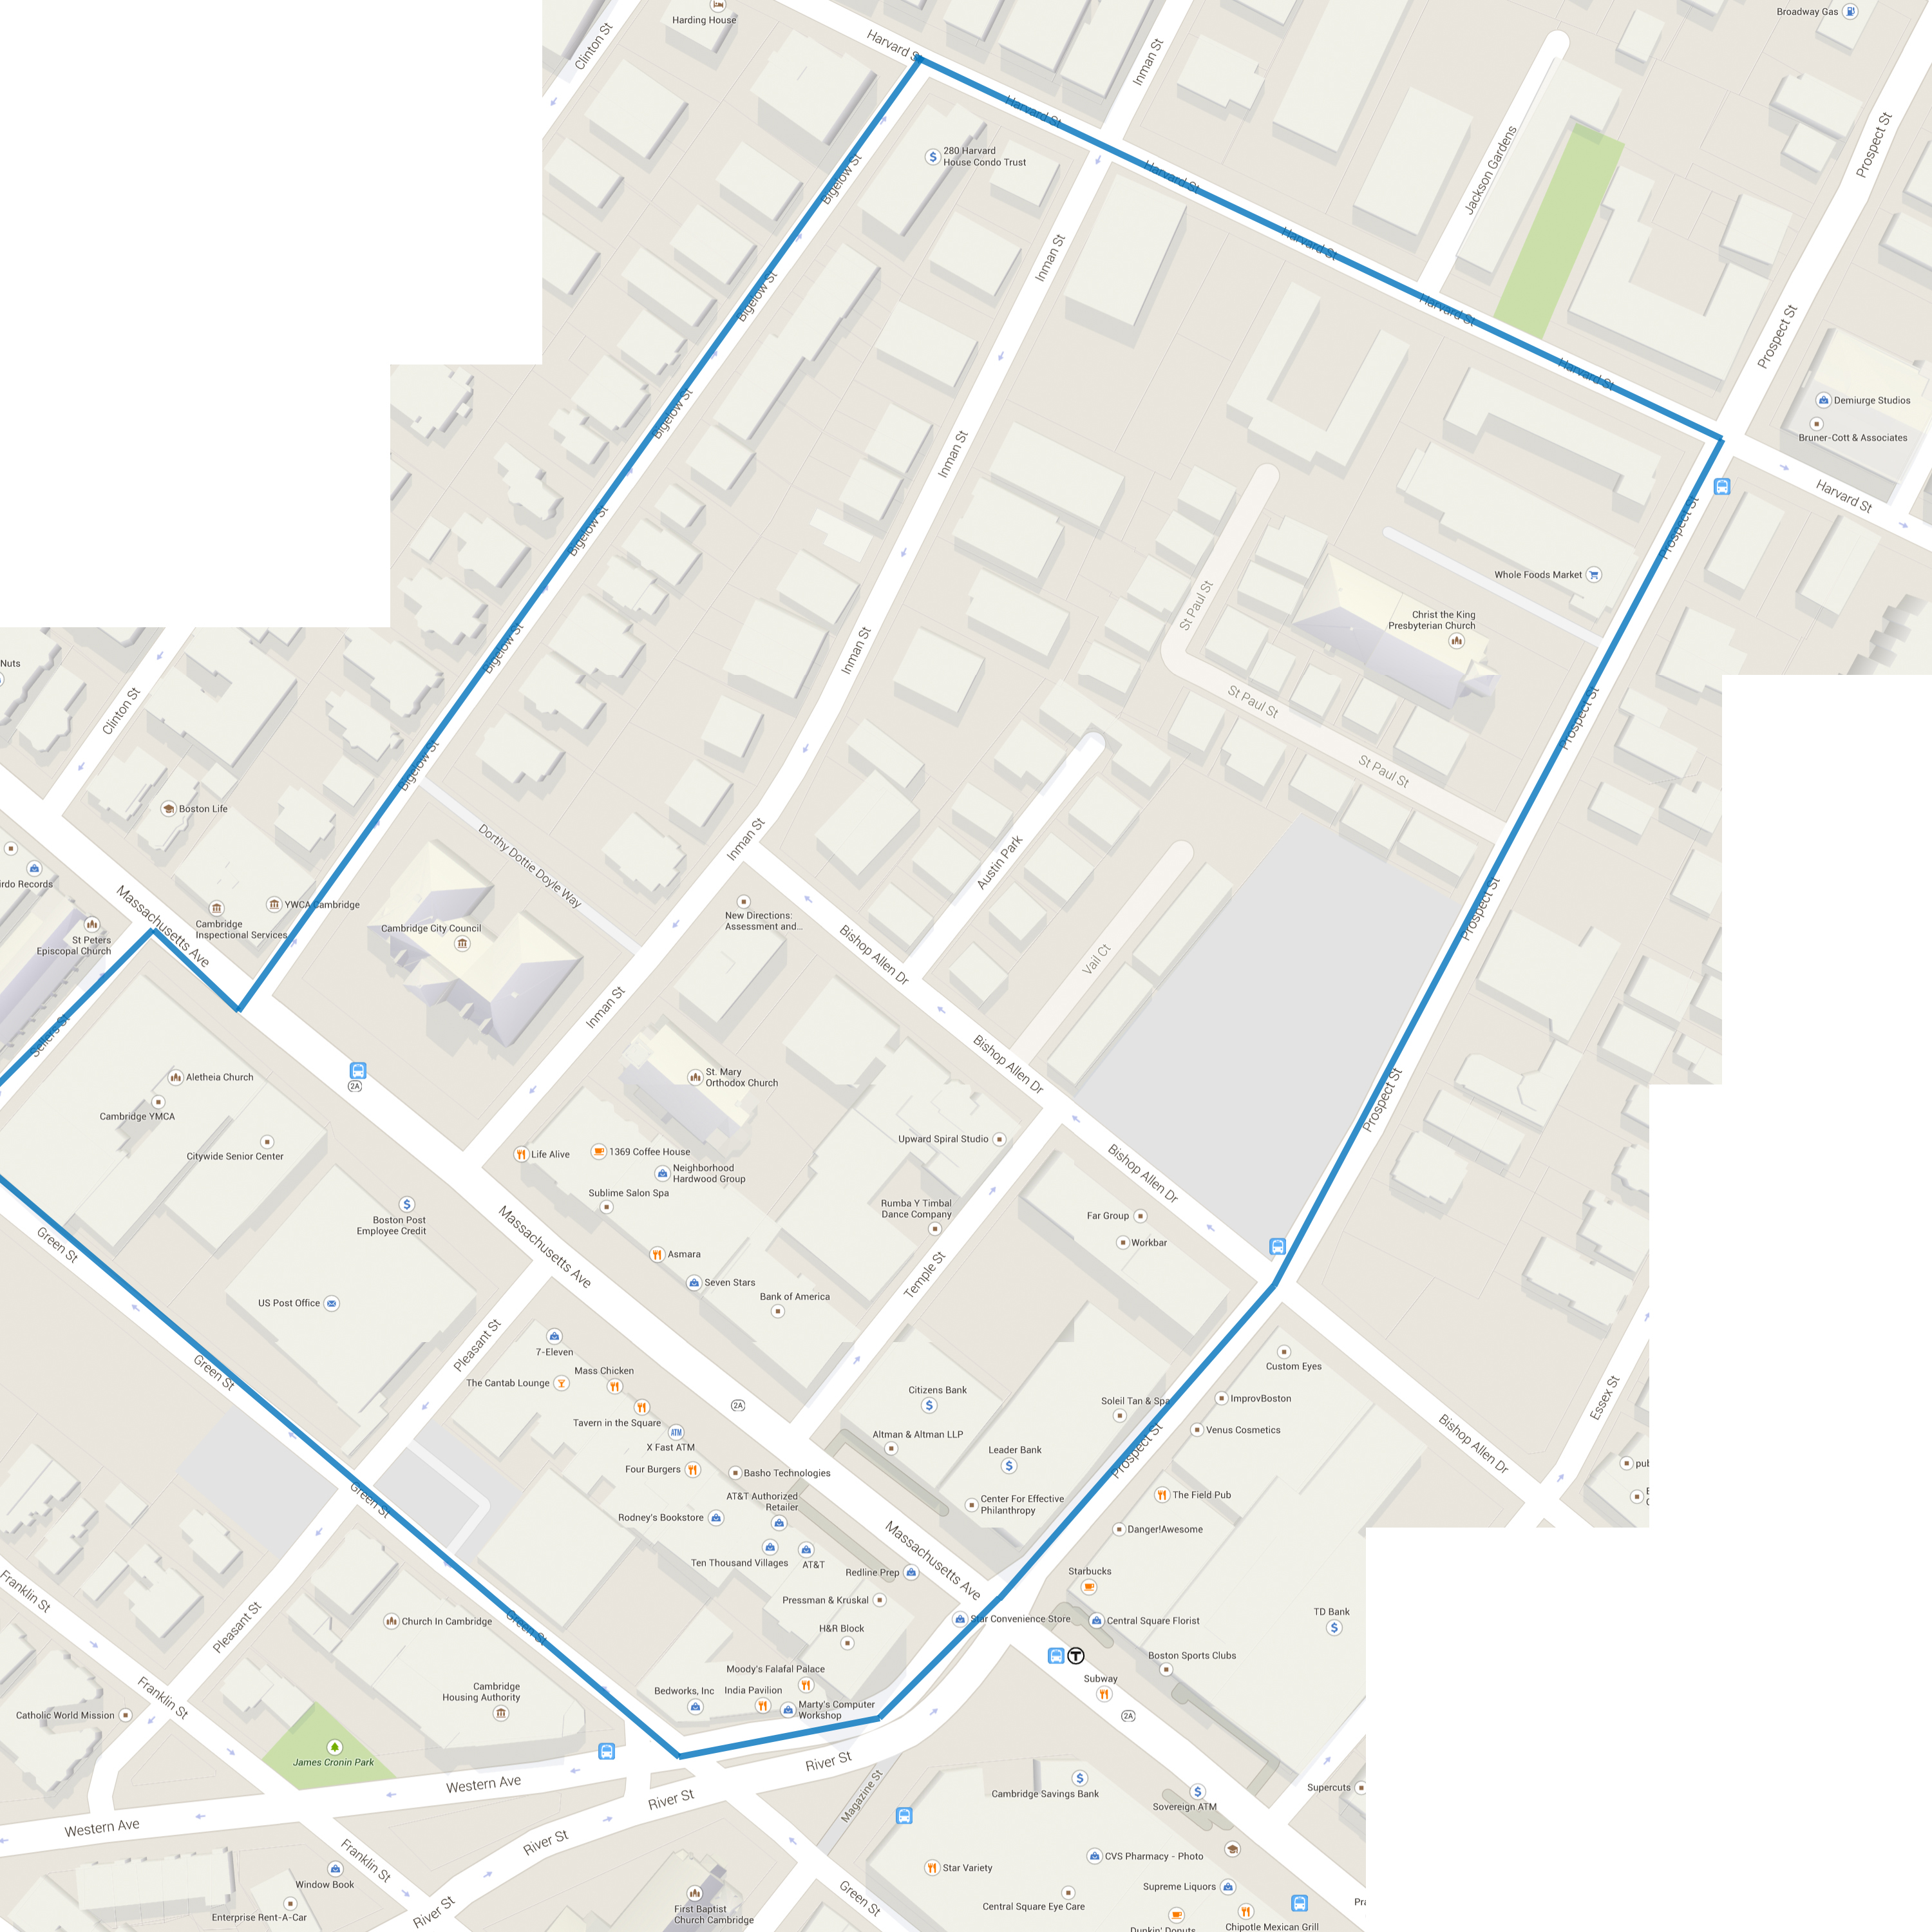 Figure 16: 2015 map of my site from google maps with many thriving shops, restaurants, and businesses along and around Massachusetts Avenue.
 ___
Today both the Central Square District and the City Hall District, as well as multiple individual buildings within my site such as the post office, are listed on the national Register of Historic Places and thereby protected from drastic changes (Sullivan). Central Square was also designated an official cultural district by the State of Massachusetts in 2012 (Mass Cultural Districts). The rise and decline of cities over time is natural. Despite the decline in population and value in the later part of the 20th century, in the 21st century people are flocking to live in urban center’s once again and Central Square is developing, and gentrifying, rapidly once again.
Although the are has gone through some ups and downs, the core of the district has stayed remarkably similar over time. Many of the things that make Central Square beloved to the people of Cambridge can be traced back to its routes––from the beautifully ornate historic churches and institutional buildings in the area that were the first keystones in the area, to the street layout that derives from the need to connect the original settlements while avoiding certain natural geographic features, to the delicious ethnic restaurants that are synonymous to many with the square that likely stem from the diverse immigrant population in the area.
Today Central Square is valued for its diverse restaurants, theater and arts scene, locally-owned businesses, newly blooming tech industry, and historic appeal. It remains a place that many people commute to, from, and through on a daily basis and serves to not only unite Old Cambridge and Boston, but also acts as the midpoint between the two main institutions that have come to define the city of Cambridge, Harvard and MIT.
.
.
.
.
Sources
1. "Cambridgeport Historical Markers." Waymarking.com. Groundspeak, Inc., Web. 2015.
2. "Cultural Districts." Mass Cultural Council. State of Massachusetts. Web. 2015.
3. Central Square Advisory Committee. "Executive Summary: Letter From the Central Square Advisory Committee." Cambridgema.gov. City of Cambridge, 2012. Web.
4. Jackson, Kenneth T. Crabgrass Frontier: The Suburbanization of the United States. New York: Oxford UP, 1985. Print.
5. "Population and Census Data: Cambridge." Cambridge Community Development Department. City of Cambridge, n.d. Web. 10 Apr. 2015.
6. Sullivan, Charles. "Atlas of Properties Listed on the National Register of Historic Places, Cambridge, MA." National Register of Historic Places (n.d.): n. pag. Web.
7. "Timeline." Once and Future City. Massachusetts Institute of Technology, n.d. Web. 2015.
Graphics
Figure 1: Batchelder, Samuel F. "Cambridge & Vicinity in Revolutionary Times." WardMaps LLC. Cambridge Historical Society. Showing Cambridge Circa 1777.
Figure 2: Hales, J. G. "Plan of Cambridge 1830." WardMaps LLC. Cambridge Historical Society. Showing Old Cambridge, Cambridgeport, and East Cambridge.
Figure 3: Chase, J.G. "Map of the City of Cambridge for 1865." WardMaps LLC. Cambridge Historical Society. Showing Central Square Area.
Figure 4: "Atlas of the City of Cambridge, Middlesex Co., Massachusetts.1873" WardMaps LLC. G. M. Hopkins & Co. Showing Central Square Area Circa 1873.
Figure 5: "Atlas of the City of Cambridge, Middlesex Co., Massachusetts.1873" WardMaps LLC. G. M. Hopkins & Co. Showing Central Square Area Circa 1886.
Figure 6: "Cambridge 1877 - Antique Map." WardMaps LLC. Franklin View Co.
Figure 7: "Atlas of The City of Cambridge Massachusetts." WardMaps LLC. G.W. Bromley and Co. Showing Central Square Area Circa 1903.
Figure 8: "Atlas of The City of Cambridge Massachusetts." WardMaps LLC. G.W. Bromley and Co. Showing Central Square Area Circa 1916.
Figure 9: "Atlas of The City of Cambridge Massachusetts." WardMaps LLC. G.W. Bromley and Co. Showing Central Square Area Circa 1930.
Figure 10: (see figure 7, 8, & 9)
Figure 11: "Atlas of Cambridge, Massachusetts." Digital Sanborn Maps. Sanborn Company, Showing Central Square Area Circa 1900.
Figure 12: "Atlas of Cambridge, Massachusetts." Digital Sanborn Maps. Sanborn Company. Showing Central Square Area Circa 1934.
Figure 13: "Atlas of Cambridge, Massachusetts." Massachusetts Institute of Technology. Sanborn Company. Showing Central Square Area Circa 1970.
Figure 14: "Atlas of Cambridge, Massachusetts." Massachusetts Institute of Technology. Sanborn Company. Showing Central Square Area Circa 1988.
Figure 15: "Atlas of Properties Listed on the National Register of Historic Places, Cambridge, MA." National Register of Historic Places.
Figure 16: “Cambridge, Massachusetts.” Map. Google Maps. Google, April 2015.