i. introduction
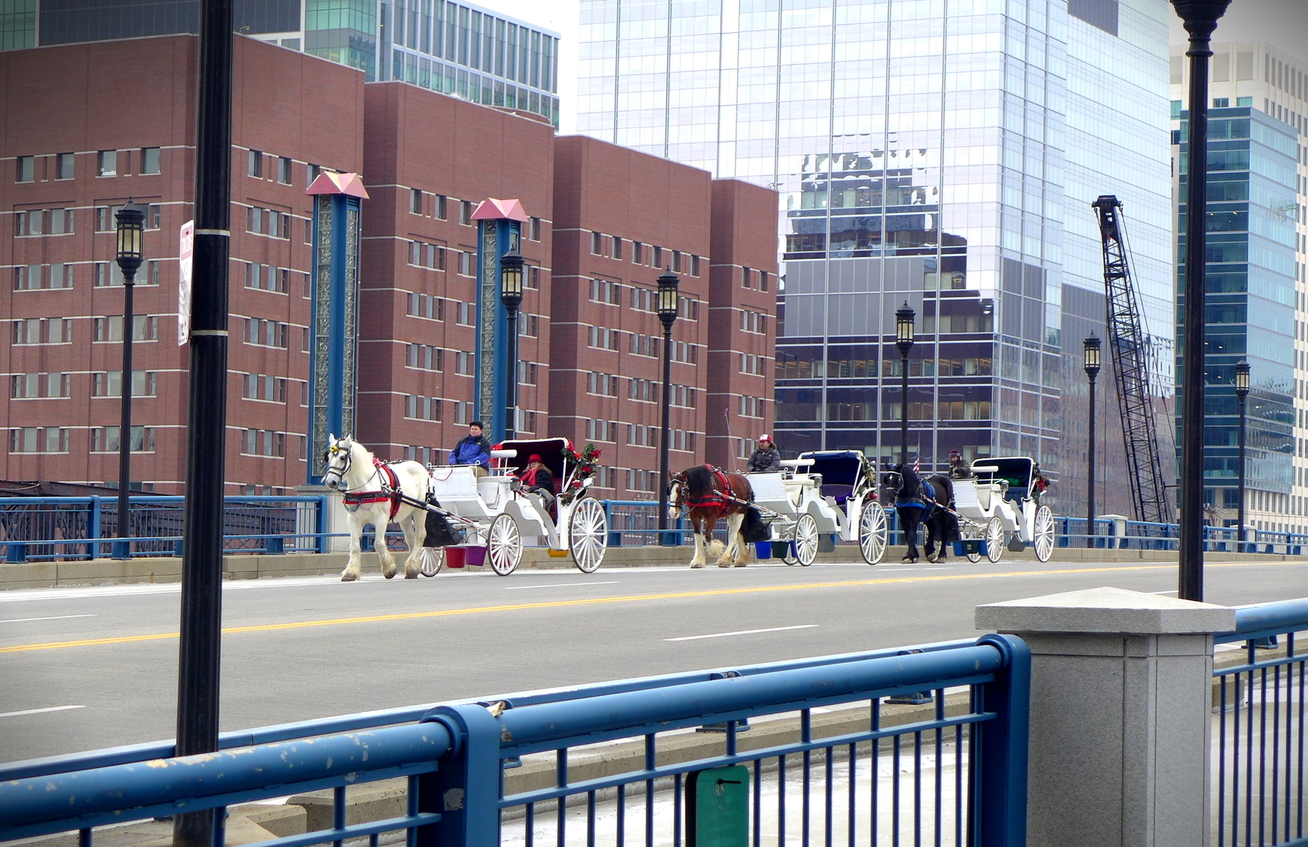 Figure 1: horse and cart on Seaport Boulevard
 ii. water & wharves
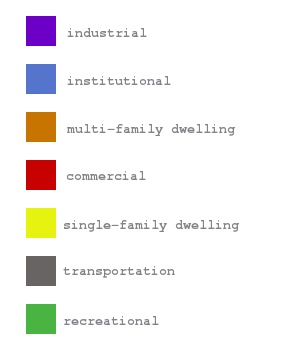 international land-use colour key
 My site's story begins in the early 19th century, when the eastern side was still a tidal mudflat (but not for long). The 1835 map portrays the west separated from the eastern tidal lands by a voluminous Fort Point Channel.
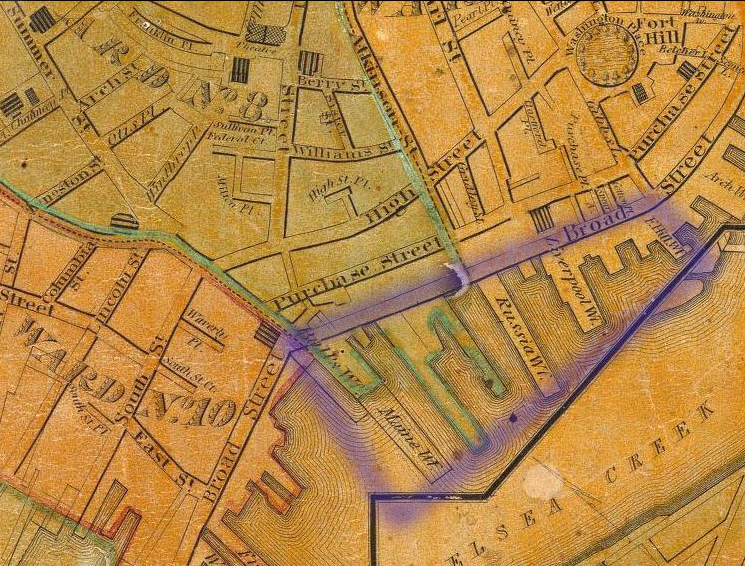 Figure 2: Plan of Boston, 1835. Map. In Boston, Massachusetts. George G. Smith, Engraver. 1835. Print.
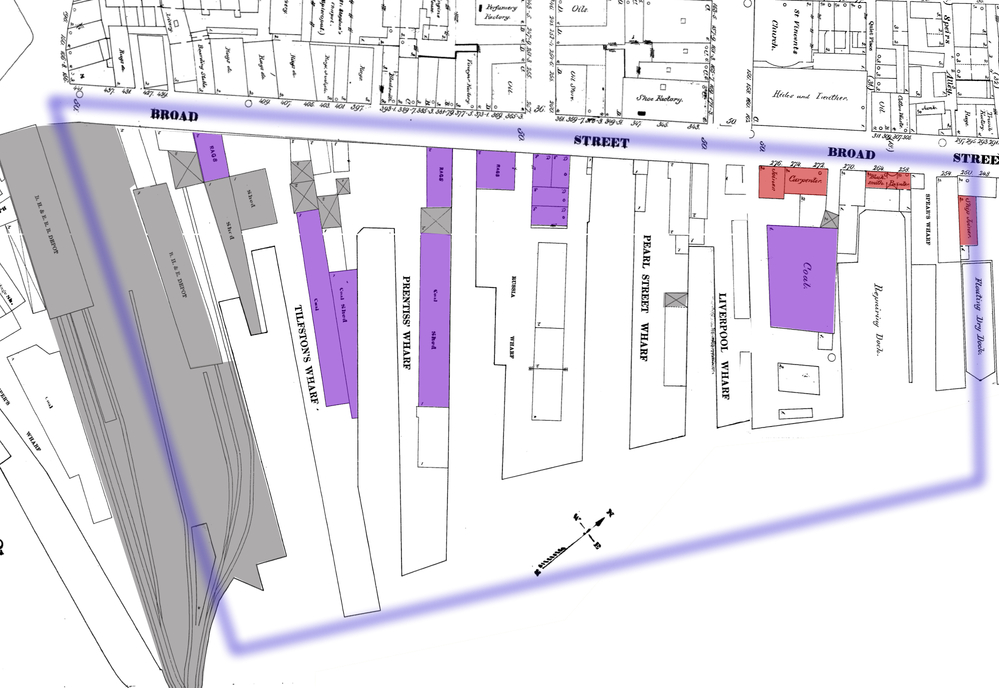 Figure 3: Sanborn Map Company. Boston Volume 1, 1867. Map. In Boston, Massachusetts. Sanborn Map Company. 1867. Print.
 In 1867, the wharves on my site were used for fishing, ship building, and coal. Though much of the site was still undeveloped and unused, the many wharves suggest a prosperous maritime trade. Of course, land transport is also a natural factor in industry. Ships bring materials into port that require on-land transportation after processing. There were many stables in the area in 1867. I believe the stables explain the presence of some of small services in the area such as a blacksmith to make horseshoes. But horses and carts were only so efficient. More importantly, the 1867 map displays the beginnings of an expansive railroad terminal that will later become South Station. The ships brought coal and lumber, which they deposited at the wharves. The coal went on to fuel and be transported by the developing freight rails and the lumber was made into more ships.
iii. filled land & rails
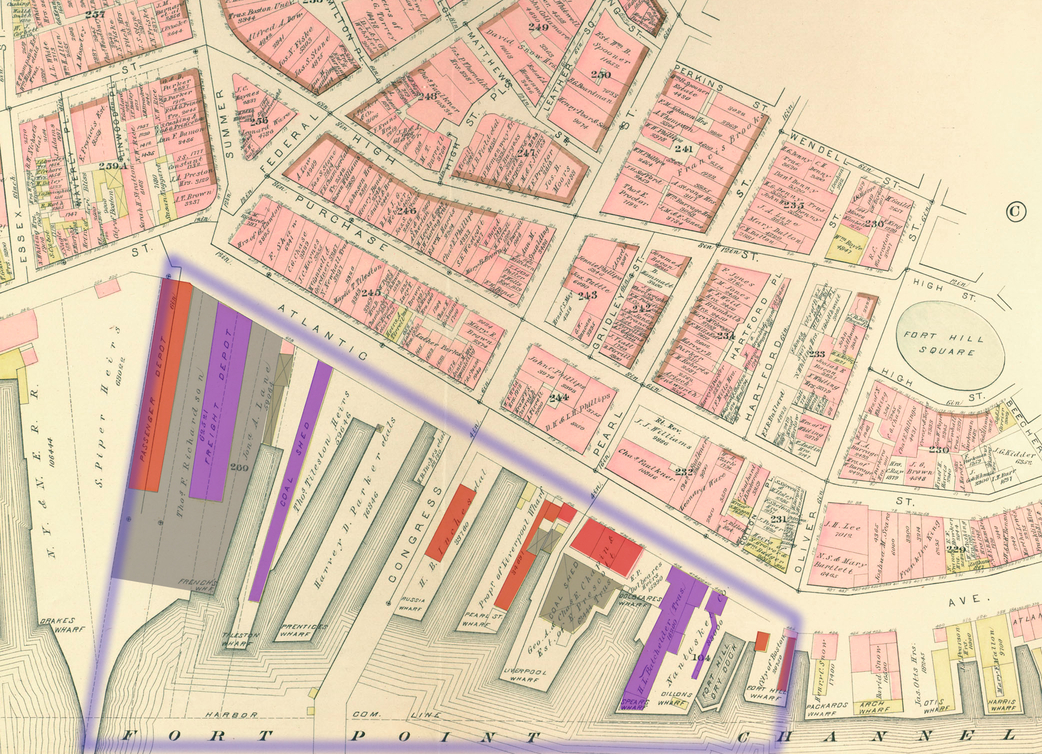 Figure 4: Atlas of the City of Boston, Boston Proper and Back Bay, from Actual Surveys and Official Plans, 1883. Map. In Boston, Massachusetts. G. W. Bromely & Co. 1883. Print.
 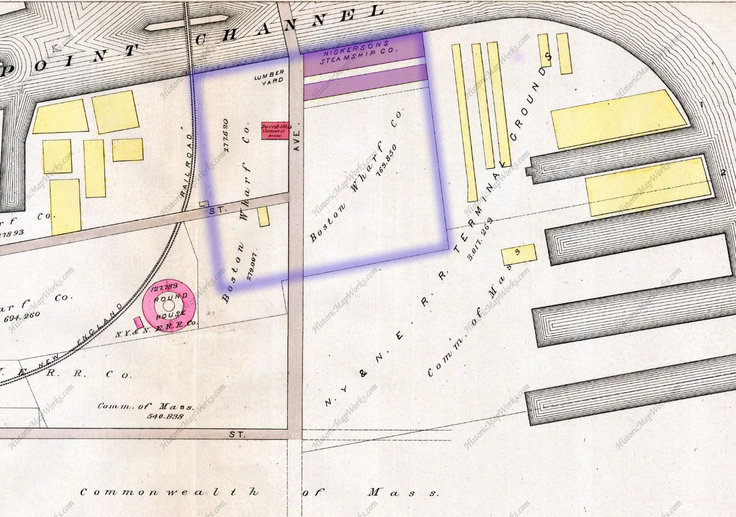 Figure 5: South Boston Combine Final, 1884. Map. In Boston, Massachusetts. The Boston Atlas. 1884. Print.
Probably, as the wharves grew more prosperous, the west needed room to expand. I assume that's why the 1884 map evidences that the Boston Wharf Company owned most of the east side. Most of the wharves on the west side were owned privately by English-sounding patrons like H. B. Inches and Chapin & Prescott. Since the Boston Wharf Company didn't own the west side, I wonder if perhaps the company was founded in order to handle the expansion of wharves around Fort Point. The Boston Wharf Company was likely developed earnest about capitalizing on the growth of wharves as a result of filling in the east. I notice that Fort Hill has become “Fort Hill Square” in the 1883 map. I conjecture that with the changing political scene and technology, Fort Point no longer required a its defensive fort from colonial times. Instead, the hill was razed and I imagine the stone was used to fill some of the east side.
In the 1880's, business continued to develop on both sides of the channel. The 1884 map of the east shows a barren layout with few streets and only a couple of industrial enterprises. At that time, the east had opened just a handful of new industries in steamships, lumber, and sugar refining. The 1883 Bromley map of the west shows that more of the western wharves were in use than in 1867, still mostly for processing of lumber and coal. The Congress St. Bridge has clearly been built, connecting the east to the west. I observe that the only wharf that was not being used was directly adjacent to the bridge on its west side. Perhaps it was difficult for ships to navigate under the bridge and into port immediately. I believe this marks an early example of how one form of transportation interacts with another. Here we see the waterways being impeded by land travel, which will end up shaping the commercial and social structure of Fort Point.
iv. new business
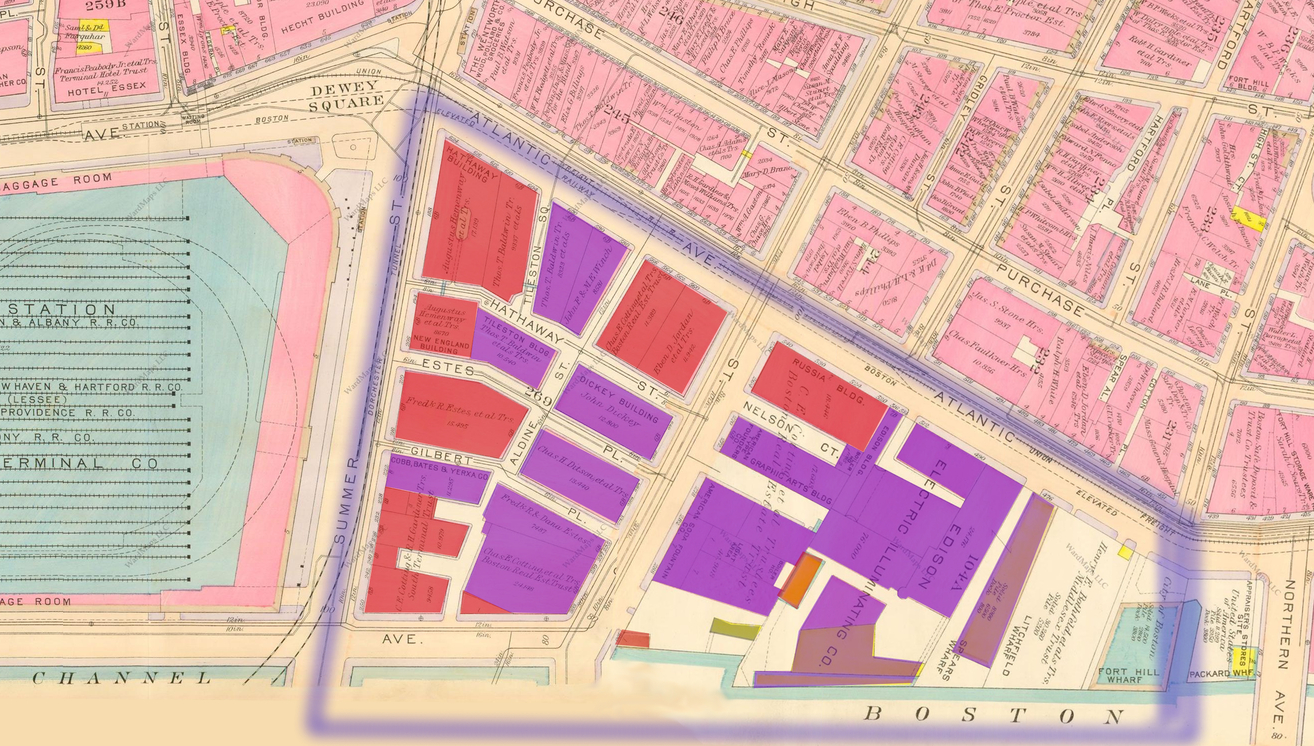 Figure 6: Atlas of the City of Boston, Boston Proper and Back Bay, from Actual Surveys and Official Plans, 1917. Map. In Boston, Massachusetts. G. W. Bromely & Co. 1917. Print.
By the turn of the century, South Station grew from the west's railroad terminals. It consolidated the many freight lines with passenger lines in a grand new station. Now, workers could commute, bringing in people from all over Boston to work in industry. The growth of the railroad actually began to thwart the wharves. By around 1917, both sides of the channel underwent a rapid change. They became entirely settled, many new streets had been laid, and more buildings constructed. Bridges and railroad tracks now ran conveniently between the west and east sides.
 Figure 7: Atlas of the City of Boston, South Boston, from Actual Surveys and Offical Plans, 1919. Map. In Boston, Massachusetts. G. W. Bromely & Co. 1919. Print.
 Unexpectedly, all of the wharves on the west side had been filled in. I assume that the narrowed Fort Point Channel with many overhead bridges became difficult for commercial ships to navigate. If we look to the east of my boundaries, we see that many new wharves were built on the filled in land. The east was at first built to extend the wharves' prosperity, but the newly-filled east side eventually led to relocation of the wharves. With yet another example of the interaction between different modes of transportation, we're beginning to see a theme of the closely rooted connection between transportation and the redevelopment of industrial areas.
Back within the boundaries of my site, we see that both sides of the channel have become dense and industrial. The 1919 map shows that the east is home to many new warehouses and factories. The 1917 map of the west is far denser than previous maps and much new industry and commerce has settled in the area. Reflecting modern technology, both sides have opened electrical buildings owned by the Edison Company. Apart from this, industry on either side is mostly non-intersecting. The west still processed coal and opened many paper businesses. The east acquired glass, plow, and brewing warehouses. During this time, we see a trend of more land-oriented industry coming to Fort Point, which relies more than ever on trains for resources.
v. becomes old business
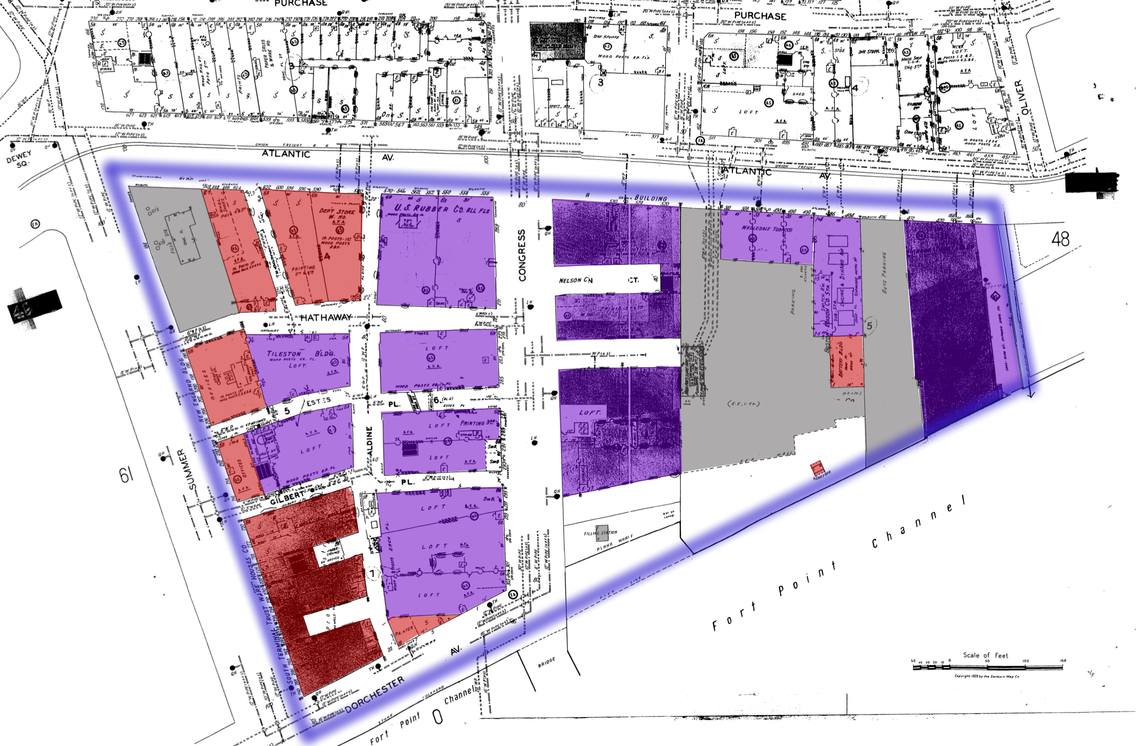 Figure 8: Sanborn Map Company. Boston Volume 1S, 1951. Map. In Boston, Massachusetts. Sanborn Map Company. 1951. Print.
 The arrival of the car brought a natural, gradual change to Fort Point. By 1950, there wasn't a stable in sight. Some buildings were even demolished to make room for parking lots. Jackson explains that the car, “even in its primitive form before World War I, could do four times the work of a horse-drawn wagon which took up the same street space” (Jackson, 183). I think it's clear that manufacturing work requires the use of modernity's most effective transportation measures. Hence the addition of the car was an absolute necessity, worth tearing a few warehouses to the ground.
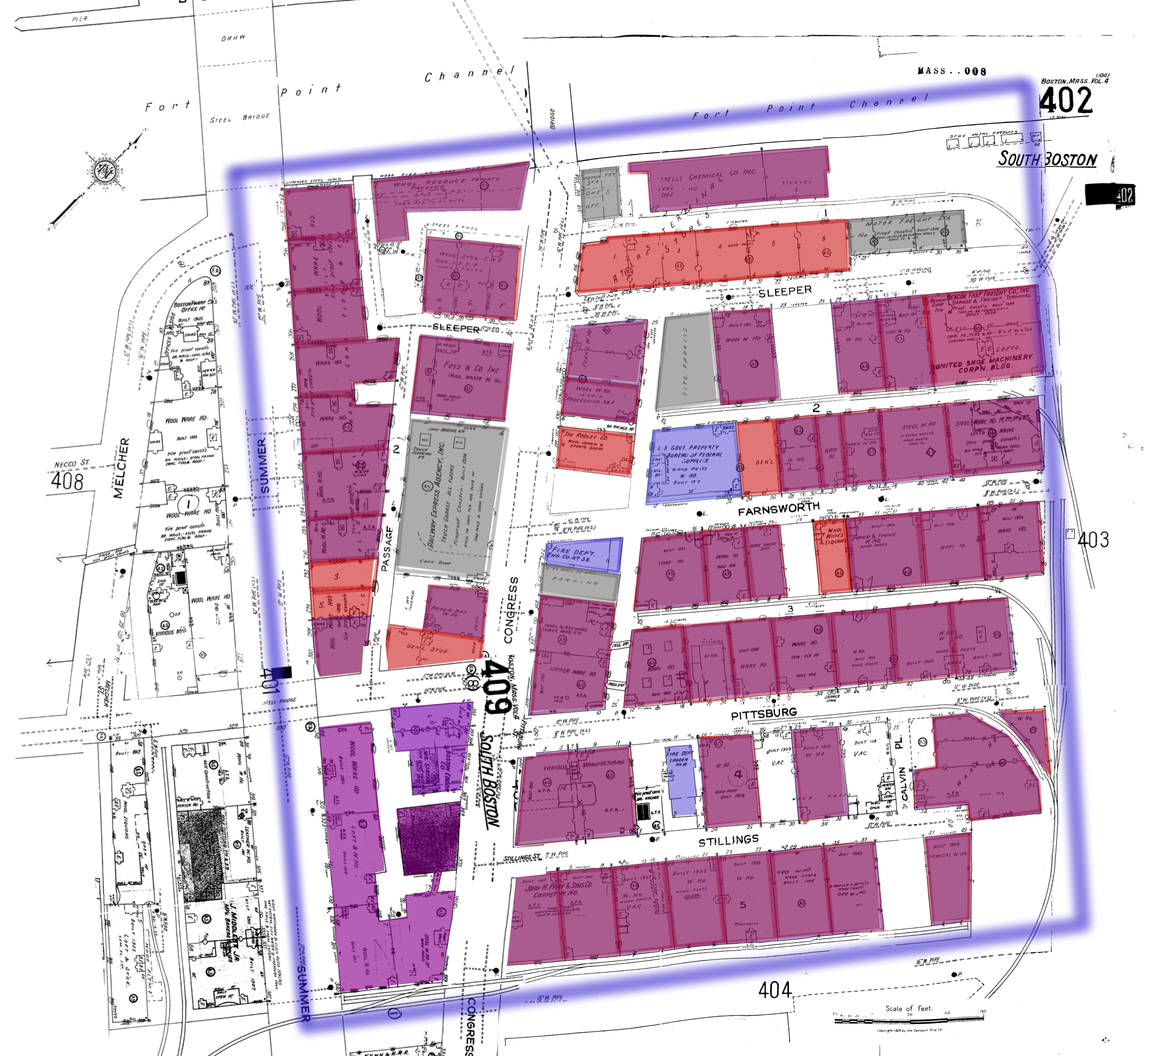 Figure 9: Sanborn Map Company. Boston Volume 4, 1950. Map. In Boston, Massachusetts. Sanborn Map Company. 1950. Print.
In addition to the assimilation of cars, many new businesses swarmed to both sides. Of course, these maps reflect the time after WWII when America had come out of its depression. I imagine it was a time of new industrial pursuits and of great technological advances, which turned the tables for industry at that time. The east side opened a few stone, leather, and chemical industries – maintaining its industrial land use from 30 years before. The west, on the other hand, experienced a slight commercial shift from the manufacturing scene the addition of a department store and some demolition to make room for parking. The 1950 map of the east portrays a frontier of wool warehouses that had opened up. Seeing no sign of sheep in the immediate vicinity, I assume that the wool was imported via boat. The 1951 map shows that a couple of wool factories opened in the west. Wool never dominated the economy of the west as it did in the east. This marked a return to the original wharf-reliant commerce of 19th century Fort Point.
vi. innovation
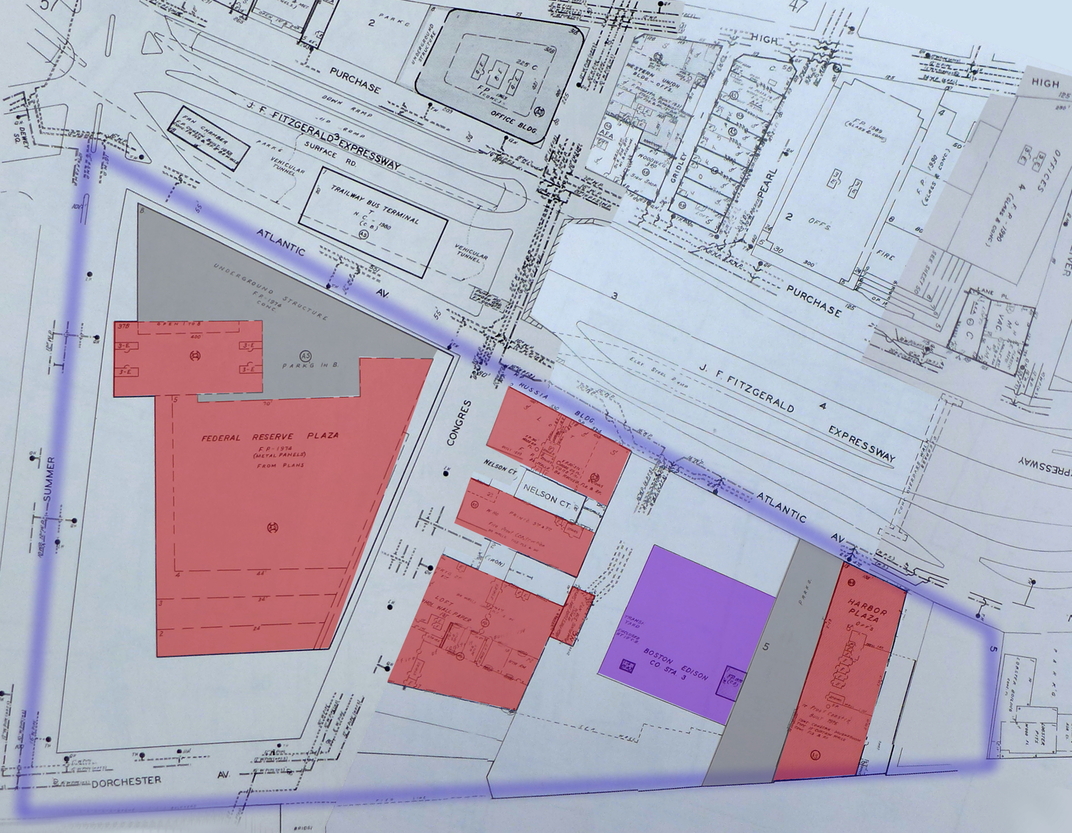 Figure 10: Sanborn Map Company. Boston Volume 1S, 1992. Map. In Boston, Massachusetts. Sanborn Map Company. 1992. Print.
 In the late 20th century the commercial focus grew further and further from traditional maritime warehouses. The railroad, however, was still a prominent feature of the area for its commuter and freight purposes. Warner relates that, in the late 20th century, manufacture altered its focus to electronics and the city shifted to finance and services, which once again restored the wealth of the city (Warner, 6). We can see from the 1992 Sanborn maps of both sides of the channel that Warner's explanation seems spot-on, especially for the west side, where most of the factories had been demolished and replaced by the towering Federal Reserve Bank. Although the Edison plant remained, the rest of the west shifted from an industrial to a commercial economy after 1951. The east, however, appeared not to catch the same wave of prosperity.
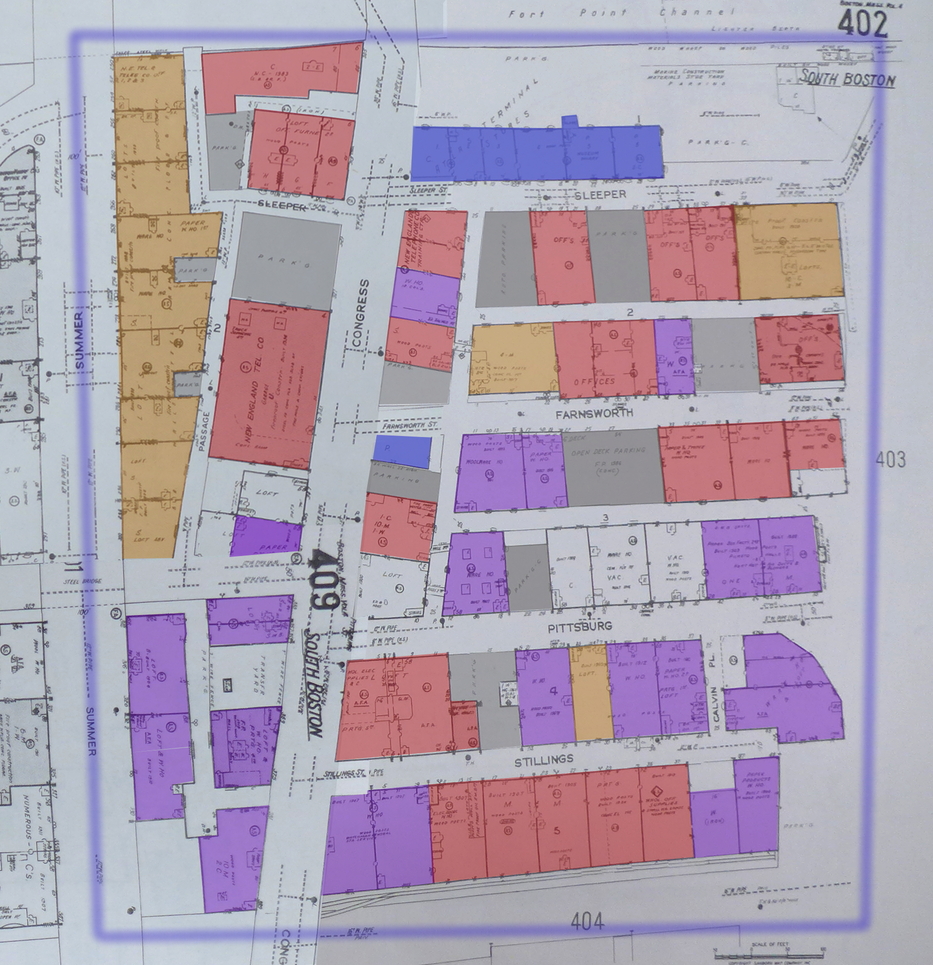 Figure 11: Sanborn Map Company. Boston Volume 4, 1992. Map. In Boston, Massachusetts. Sanborn Map Company. 1992. Print.
Instead, little of the east's layout had changed. Most of the wool warehouses appear to have gone out of business and became apartments or offices. I presume the advent of synthetic fabrics after 1950 conveyed the doom of the wool industry on a mass-scale. Although I cannot be certain, the huge investment in wool may have bankrupted the Boston Wharf Company, as the company looks to have left the picture by 1992.
Looking over the Sanborn map from 1992, I notice one addition that I find particularly striking: the Children's Museum. The last time I visited my site, the museum, located on the waterfront between Congress and Seaport, flew a banner that pronounced “celebrating 100 years”. I was very confused, because I knew that Fort Point was recently a mecca of manufacture. Why would a Children's Museum be built amidst this industrial world? But then I read the small print, and discovered that the museum had moved from Jamaica Plain in about 1980. I extrapolated that the placement of the museum might have been part of a government project to convert the area. Perhaps public works took it upon themselves to rezone the east side in an effort to redefine Fort Point. This may explain the seemingly unfitting titles, “Waterfront” and “Innovation District,” that the east has adopted. In any case, this sudden redevelopment project appears to be gradually working as more families and small businesses arrive in the area.
In this final period of redevelopment, the west side once again shot up beyond the east in wealth. Today the west appears modern and prosperous. Its shining concrete towers cast shadows on the worn brick warehouses of the east. But not so long ago both sides were basically in the same financial state. I think the east side simply made a bad investment in wool, from which it only began to recover in the past 20 years. Now the east is making a comeback – many upmarket shops and restaurants opened, Zipcar moved in, the ICA brought culture to the area.
vii. conclusion
References:
Jackson, Kenneth T. Crabgrass Frontier: The Suburbanization of the United States. New York: Oxford UP, 1985. Print.
Warner, Sam B. Jr., Mapping Boston, MIT Press, Cambridge Massachusetts, 1962.