After the initial development of an area, every subsequent resident leaves some form of trace on the land. This can be seen in any city by the layout of the streets, their names, the houses and institutions that exist in the area, and even the infrastructure. However, in some cases, pre-existing cities have to rebuild from scratch a previously populated area, for example after a fire or natural cataclysm. This particular area in Area IV presents an odd combination of both instances: while maintaining a street pattern that results from its long history in the area, it has somehow scrounged itself from its industrial past to present an almost solely residential area. As was studied previously, the area was once a mix of residential, commercial, and industrial land uses. Nowadays, to find such diversity one really has to look past the typical residential architecture to find stores and restaurants, and past the commercial building façades to see homes inside. From observing this site, there have been two apparent trends that stand out: either the previous land use has had an effect on the present land use, be it residential to commercial or vice versa, or the previous residents and communities that once inhabited the area have had an impact on how the area looks today.
With the development of any residential neighborhood, businesses serving the evolving community will follow. This is especially true in this section of the old Cambridgeport, which by finding itself at the tail end of the Broad Canal and within commuting distance of Boston provided prime real estate for both industrial land uses and residences. The southern part of the site once hosted a series of industries representative of their times (as was studied in a previous work and can be found in "Site Through Time"), which correlates with its proximity to the canal and the subsequent railroad and other forms of land transportation. Thus, the study of the remaining traces of the past industries is interesting, since they were essential in the development of the surrounding area.
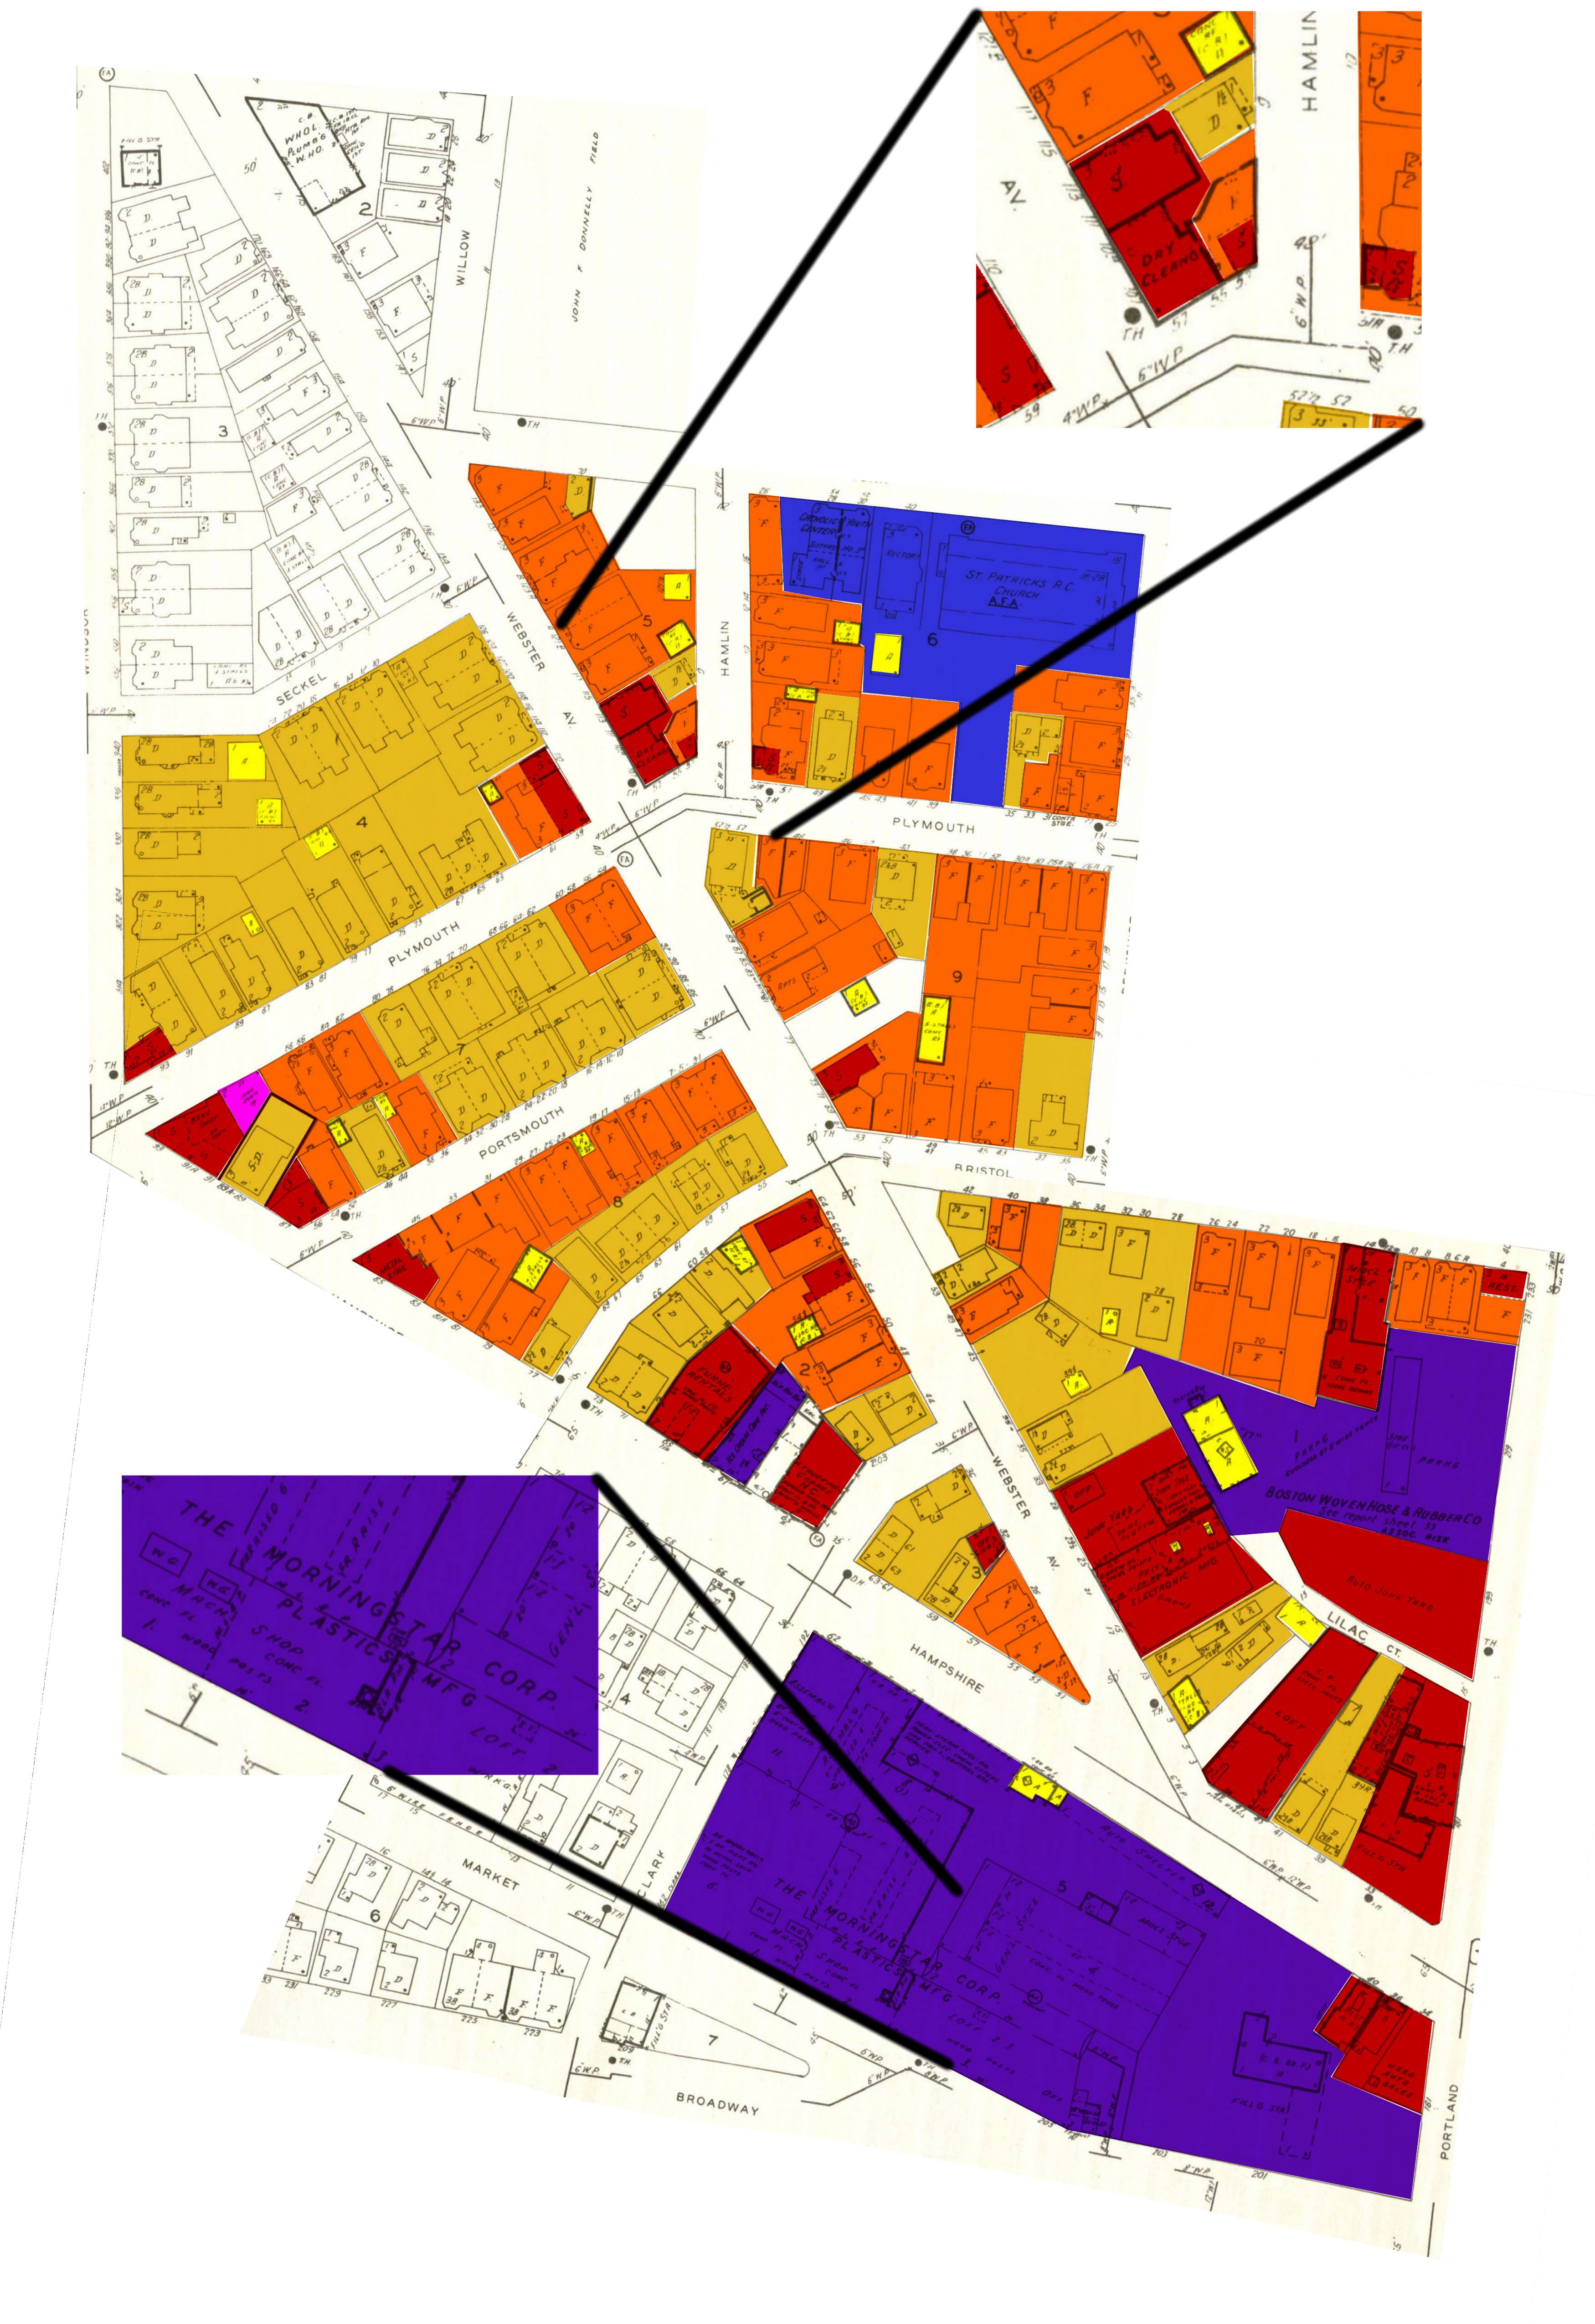
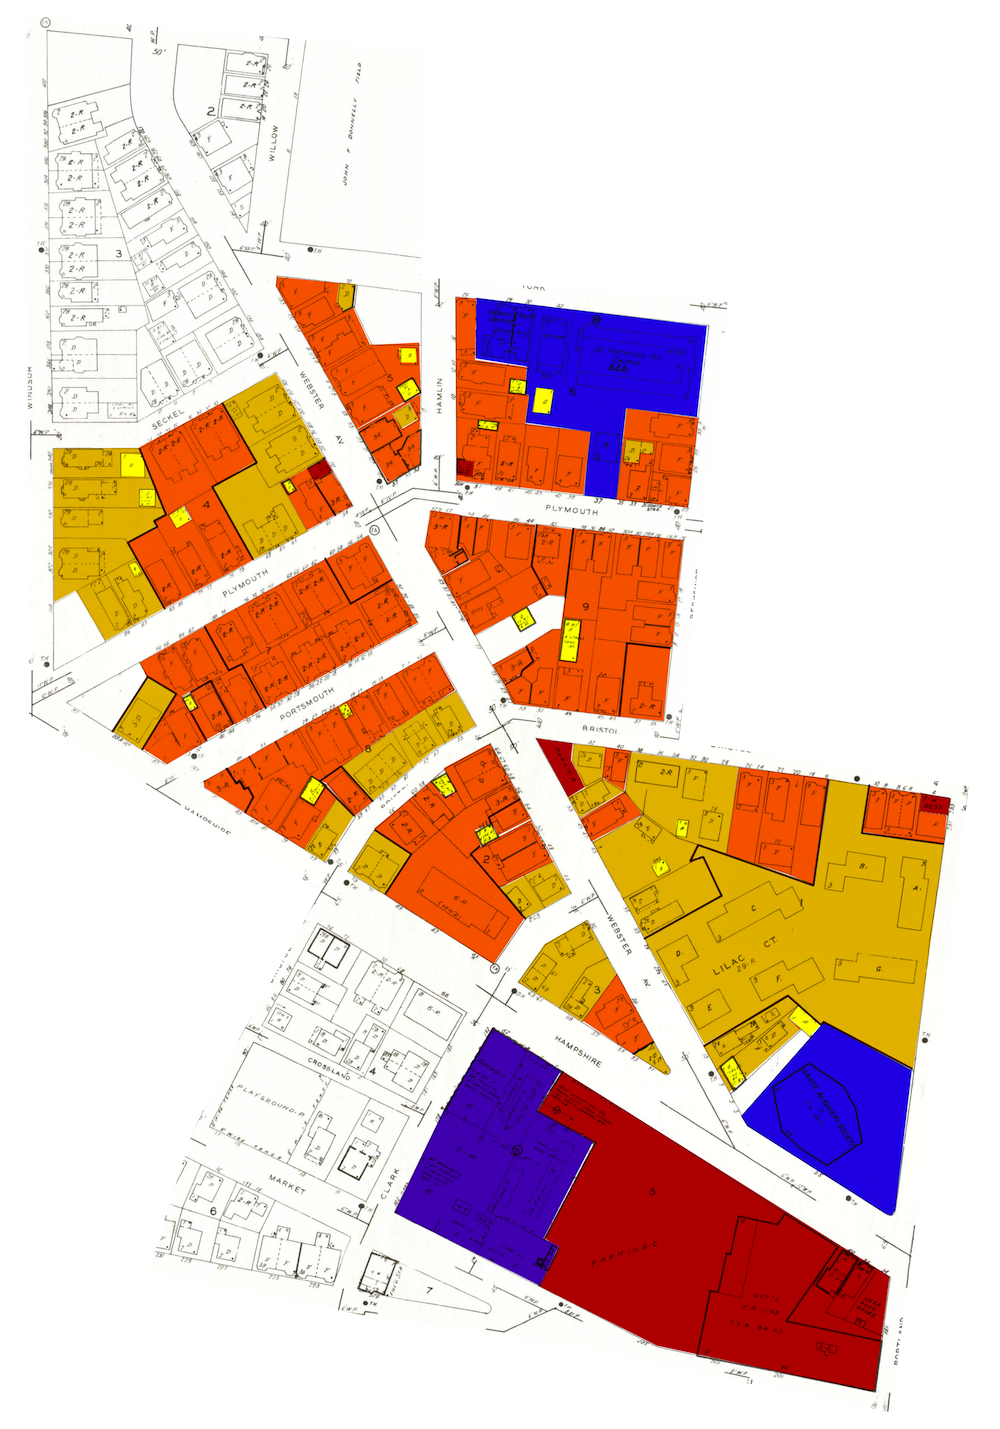
When walking about this subset of blocks today, the abundance of residential homes throughout the area is remarkable, especially in comparison with the maps during the past century where there was always a mixture of commercial and residential land uses. Indeed, from 1970 to 1996, it is notable how the businesses were slowly faded out of the area (as can be seen in Fig. 1) over the course of 30 years. Previous industries such as plastic companies or dry cleaners no longer had a place in the contemporary neighborhood. Whether this is a reflection of the economic downturn during the 1980s or a result of the development of Kendall Square, resulting in a need for residences for the workers attracted to the area in the near proximity, can be left up for debate. Overall, most of the industrial buildings built prior to 1950s seem to have been torn down and replaced with duplexes or housing complexes, or at least renovated to seem as new in comparison. As can be seen on Fig. 2, this new layer of homes prioritizes the omnipresence of the car, modifying the traditional design of the stoop and its associated social aspect. These newer additions indicate to a past being torn down and being built upon, increasing the tension of this area's past being forgotten.
However, there are still some examples of contention between land uses that do not seem to call on the tearing down of the past. Many present-day businesses have turned to remodeling ground floors of formerly residential quarters (as seen on Fig. 3), and have used this aspect of their business to increase their homely charm. One example of extensive reconstruction to change the land use of a site without changing its outwards appearance is St. Patrick’s Church: during the 1980s it had several landings included in its main building and converted its annexed buildings such that affordable housing could be provided to residents in the area. [1] Several older buildings have also been transformed into housing. As can be seen on Fig. 4 (on the left), one could argue that the wall used to be the entrance to the corner store that was housed in the building until at least 1981 because of the presence of the ledge, as an entrance step. Another building that has this trace is the building on Fig. 4 (on the right), with three entrances from when it was a dry cleaners, store, and residence all in one. Finally, there is also one whose presence as a store can be seen from the offset with the surrounding buildings, but its status as store is debatable. There does seem to be some character to the area because of a painting screwed into the tree right in front of the store, almost as an effort to beautify the area.
Other buildings have simply remained constant throughout the ages, even as the surrounding area continued to morph with the changing times (as seen in Fig. 5). Having the massively modern research laboratories of Mitsubishi Electric as the backdrop to Emma's, a restaurant that has been serving pizzas to the neighborhood since its arrival in the area during the 1980s, summarizes the current status quo. This is especially true since there will now be construction on the open lot right next to it for mixed uses. The building housing the restaurant has had its use since the 1930s. It is truly impressive how such a small squat building has remained a beacon representing the Italian heritage of the neighborhood in light of exterior forces changing the face of the area.
As a whole, it seems as if the nature of land usage left not many visible traces on the land today. One can keenly observe this with a small monument tucked away between two biotech research labs, which can be seen in Fig. 6: set up as a public art piece with lighting but lacking a descriptive plate, one can only guess from its gears, metal material and rust content that it calls back to the automotive history of the site. This area was once greatly affected by the automotive industry, hosting numerous associated institutions such as parking garages, fill stations, auto junkyards, and tire production facilities. Nowadays, just like the fill station laid to waste right off the boundaries of the site (see Fig. 7), the importance of this history can only be hypothesized, especially while remnants such as this monument remain on off-the-road walkways to remain noticed only in passing.
As with any neighborhood in an old city, this area has gone through several different periods of development, and then again redevelopment in the subsequent decades. Through the years of renovations and reconstruction, certain indications of time periods have been blurred, especially in the contemporary building style, while certain houses still stand true to the time period in which they were built. As of such, visual indicators which were then compared to the maps of the different periods of time led to certain buildings being considered part of a architectural movement, as can be seen on Fig.8.
The majority of the area was developed by the end of the 19th century, and this has remained evident even today with certain residences being built in their contemporary architectural styles [2] still standing. The houses found to have central chimneys and numerous windows were associated with the Federal style, prominent at the end of the 19th century. Second Empire homes have the characteristic mansard roof, among other features. What is interesting of the homes here is the placement of the buildings of this architectural vein on the site: on the 1873 Hopkins map (as seen on Fig. 9), the three buildings along Windsor Street appear to be built (the ones along Plymouth Street shall be built on a later date), and their style has a clear correlation to the time period of the Second Empire. One could suppose that the houses were commissioned as a reminder of home, so by recent immigrants of the Old Country, or by residents that wanted to remain in style with the current trend. Queen Anne homes were also much in vogue at the end of the 19th century, so it is no surprise that they pop up around this area. One can especially assume this with the presence of a projected cricket field in surrounding area, since it shows a British influx of immigrants or at least an important British influence.
By the start of the 20th century, there was a growing concern for housing for the increasing number of residents in the Greater Boston area, which meant an increase in multi-family homes being built. Indeed, by 1880 there is the introduction of the triple-decker in Cambridge, a “horizontally-divided multi-family housing” option. [3] This can be distinguished from simple apartment buildings by their iconic three floors, elaborate top floor molding, and entrances with some form of detail (can be seen on Fig. 10). For the subsequent decades, distinguishing one building style from another is difficult because of the overlap in influences for the architects designing the residences. Buildings of this sort were denominated as “contemporary” if no clear date could be associated to them such as an engraving on its face, or if they seemed too “new” to be anything other, be it by design or by recent renovations and paint jobs. Buildings were denominated as “20th century” if they seemed to have been built around the 1920s (seen on Fig.10): this could be confirmed by the dates engraved on their faces and by their appearance on the Sanborn 1934 map, as compared to the 1916 one. By the amount of later date buildings, one can suppose to the impact of urban renewal in the area, underlying its ever changing nature.
At first glance, the block surrounding Lilac Ct. doesn’t seem like anything more than a housing complex. Its current appearance does not hint at its industrial past, and possibly less-wealthy former residents. Indeed, by 1930 (seen on Fig. 11), the land was divided into somewhat small plots, hosting single family homes for the likes of M. Freitad, John J. Flannery, and L & S Flannery, indicating a diverse community of immigrants. After all, after the Civil War, “Irish immigrants were joined by Italians and eastern Europeans Jews.” [4] Since they were probably workers at nearby factories, as was often the case of recent immigrants, one can also accord these residents another trend of the time: the less-well-off building their own homes using a balloon frame home. [5] If this was the case, then it is highly possible that the homes that were created weren’t as durable against the Bostonian weather, which could explain why the majority of plots were sold and converted into factories by 1970. The return of the Italian Cultural Center to the area and the rise in gentrification through the housing complex would seal the deal in the final development. For the convenience of the housing complex, even the orientation of Lilac Ct. was changed.
By accumulating all of these layers over different time periods, the site demonstrates how the area isn’t static. Furthermore, even established homes are subject to additions, from a porch to whole floors added on (can be seen on Fig.12). Each house that was developed is representative of a larger entity than simply the fancy of its owner: it represents the socio-economics desires of the class the owner is part of, the tendencies of the era and the architectural styles in fashion, and the overall prosperity of the site.
Many have passed through this particular subselection of blocks, and each have left a lasting impression of the overall development of the area. As Dolores Hayden put it in The Power of Place: Urban Landscapes as Public History, “ethnicity, as well as race, class, and gender, can be uncovered as a shaping force of American urban places, provided one looks at the production of social space carefully.” [6] In particular, there have been several waves of immigrants from different European countries, namely Ireland, Portugal, and Italy. The most important wave during the 19th century was the Irish arriving from the Potato famine, dramatically increasing the population of Boston since “By 1850 Boston had 35,000 Irish, by 1860 50,000, almost a third of the city’s population of 178,000.” [7] Thus by the end of the 19th century, there was possibly already several generations of Irish-Americans living in the area, with interest in building their community. As with any group of people, religion is a large part of their identity, and so to no surprise there was the establishment of a Catholic Church in 1909. [8] By 1991, however, it decided to become “affordable housing” for the area, which might indicate a decrease in parishioners, or simply an increase in need for housing in the area.
Another cultural indicator would be the presence of the Italian Cultural Center, since it is a site that celebrates Italian culture through reunions and classes. The location of the center is attributed to the Mayor Velluci, who helped acquire it. It could indicate the number of Italian residents in the area, who would want to have the center in close proximity. What’s interesting here is that the intersection of Hampshire St. and Portland Ave., the Center’s corner, is now named Velluci Sq. after the mayor.
In fact, all of the names of the squares in the area, which are in high density for such a small space, are a great indicator of who inhabited the neighboring blocks, since this can only be obtained by public interest and money. As can be seen in Fig. 13, there are three main groups of square names (all approximations of heritage): the Irish surnames, being Lowry, Sullivan, Callinan, Dolan Sqs; the Italian surnames, being Sarchioni, Frisoli, Suozzo, and Velluci Sqs; the Portuguese surnames, being Depina, Camara, Souza, Furtado, and Joaquim Sqs. Nowadays, the Portuguese neighborhood finds itself next to Donnelly Field and around Cambridge St. There seems to be a real community sense behind these names, since several of the plaques on the squares were even decorated with flowers. As Hayden said, “People make attachments to places that are critical to their well-being or distress,” [9] demonstrating the importance of place for these individuals and their communities.
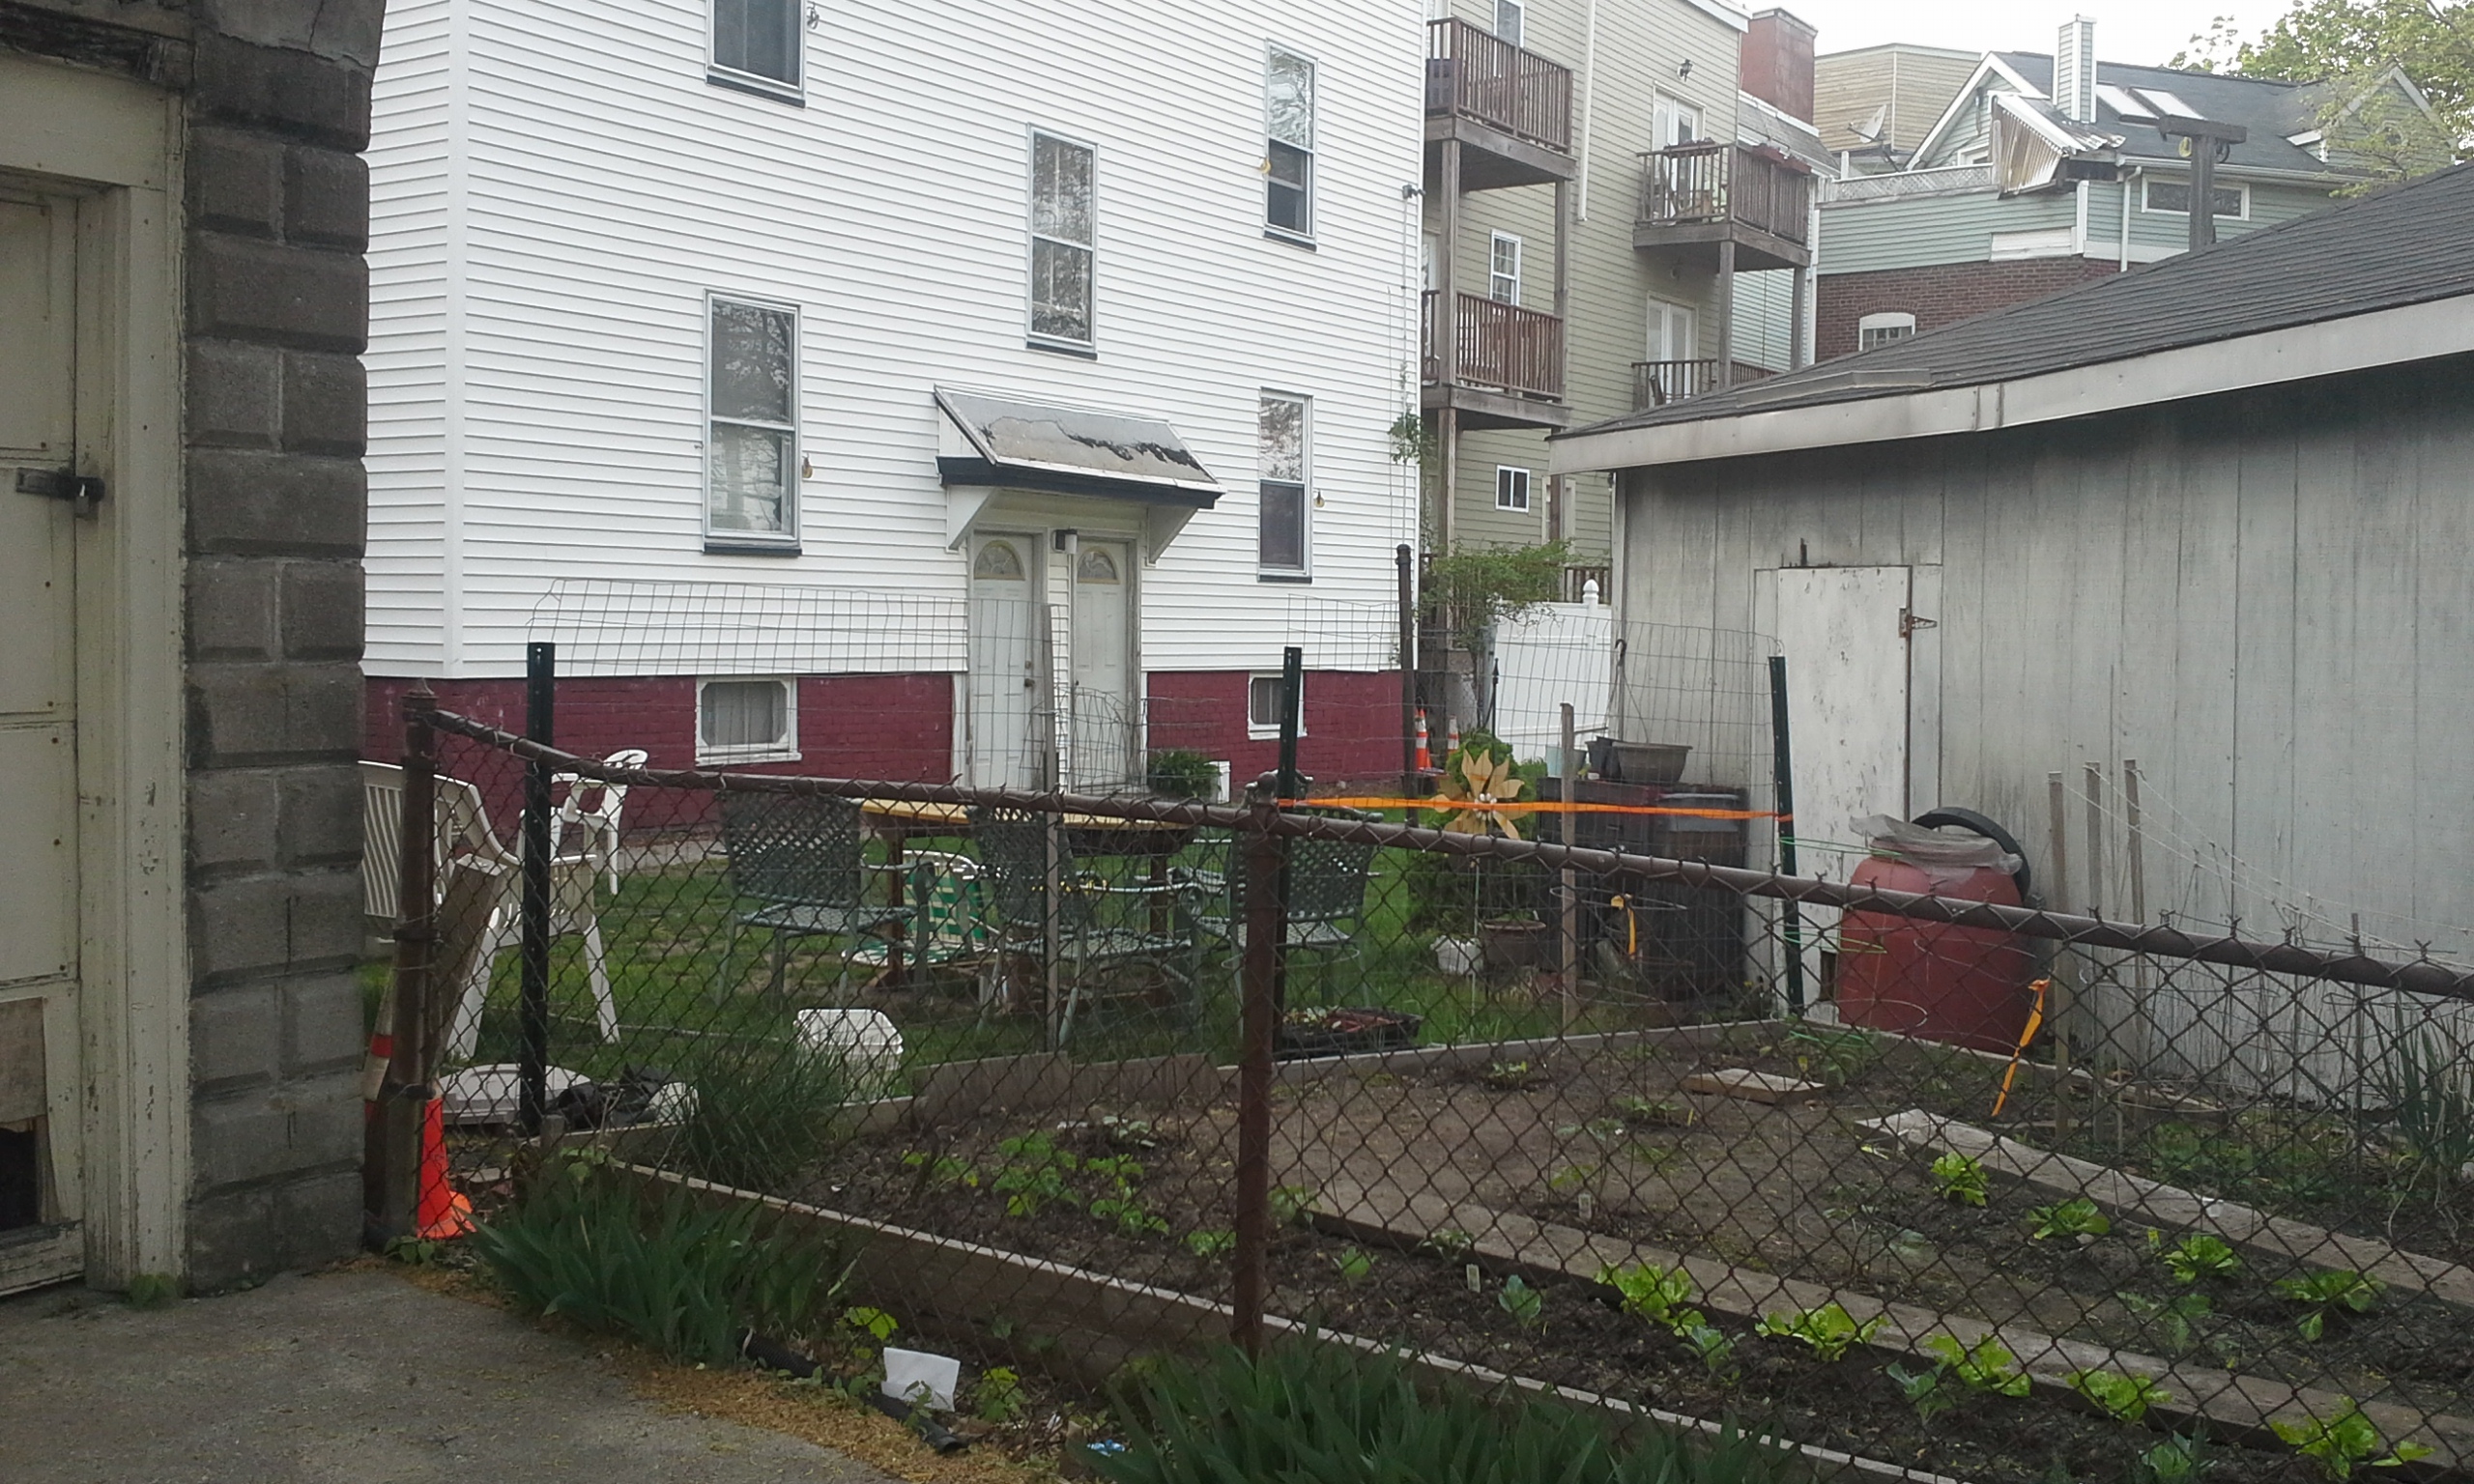
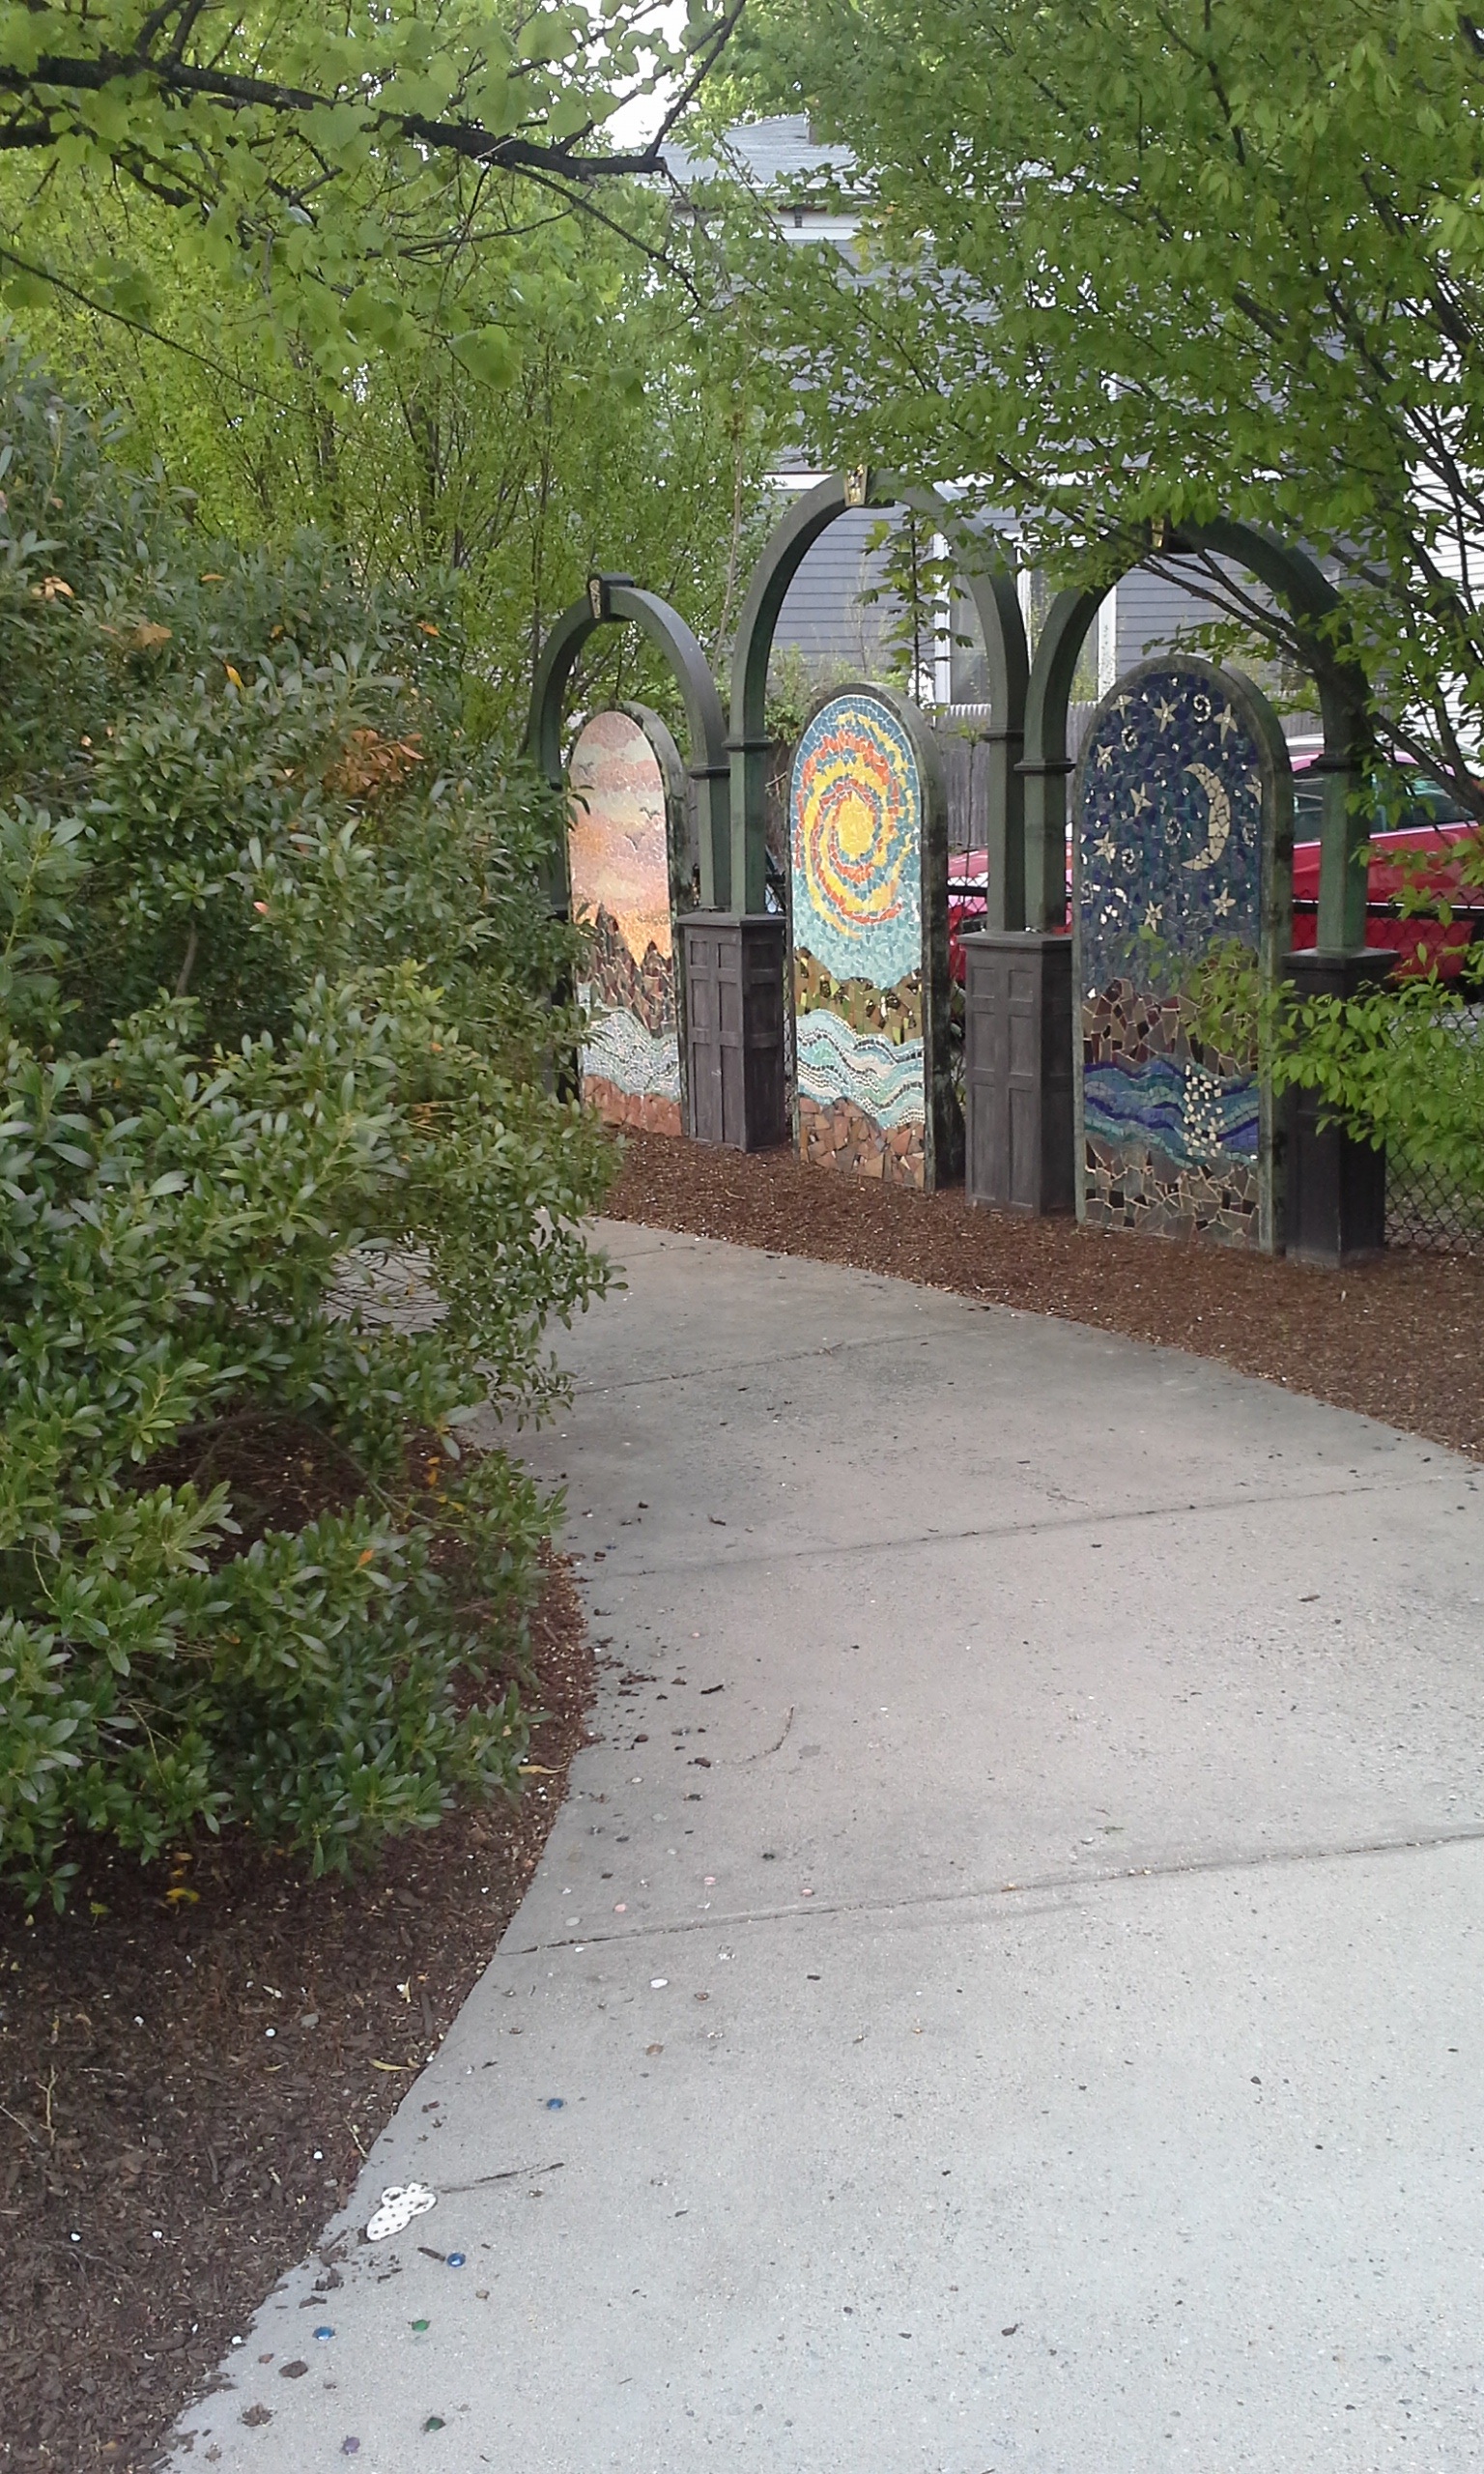
Identifying the lasting trends as a result of the cultures inhabiting the area is a subtle affair. For example, in the case of Philadelphia, according to Hayden, “Italian immigrants and their descendants made their presence felt through masonry, confectionery, window dressing, and street festival design." [10] On the present day site, this hasn’t been so much the case, apart from two instances of religious figures being depicted alongside a doorway. There is, however, an overwhelming sense of community throughout the area. The majority of homes have decorated entrances, and there even seems to be a community garden on a small plot of land in between buildings and sheds, with a set of chairs and tables in the surrounding lawn (as seen on Fig.14). Even the park that was built on the former land of a corner store, a trace of the economic hardships of the 1980s, is decorated and maintained (as seen on Fig. 15). These small pockets of Nature are important since, according to Carl Sauer, “combination of natural and man-made elements that comprises, at any given time, the essential character of a place.” [11] Signs of rougher times are exemplified by the sole surviving corner store, which has bars over its broken window, fixed with tape, whereas the surrounding residences do not.
All in all, the traces and trends of development for this site are difficult to identify without knowledge of the historical and social development of the area. What could seem like a flat neighborhood by the sole presence of pristine house indicates a recent period of renewal and the influx of money and new residents in the neighborhood. What seems like a new paint job shows the upkeep of decades old homes, representative of the time period in which they were built. What could simply be a local restaurant is the result of the heritage of generations of residents, who still maintain their traditions alive today. Finally, what could be called a gentrifying neighborhood, a clash of old and new, two worlds at odds, is just another step in the long process of renovation that has followed this area since the start of its development.
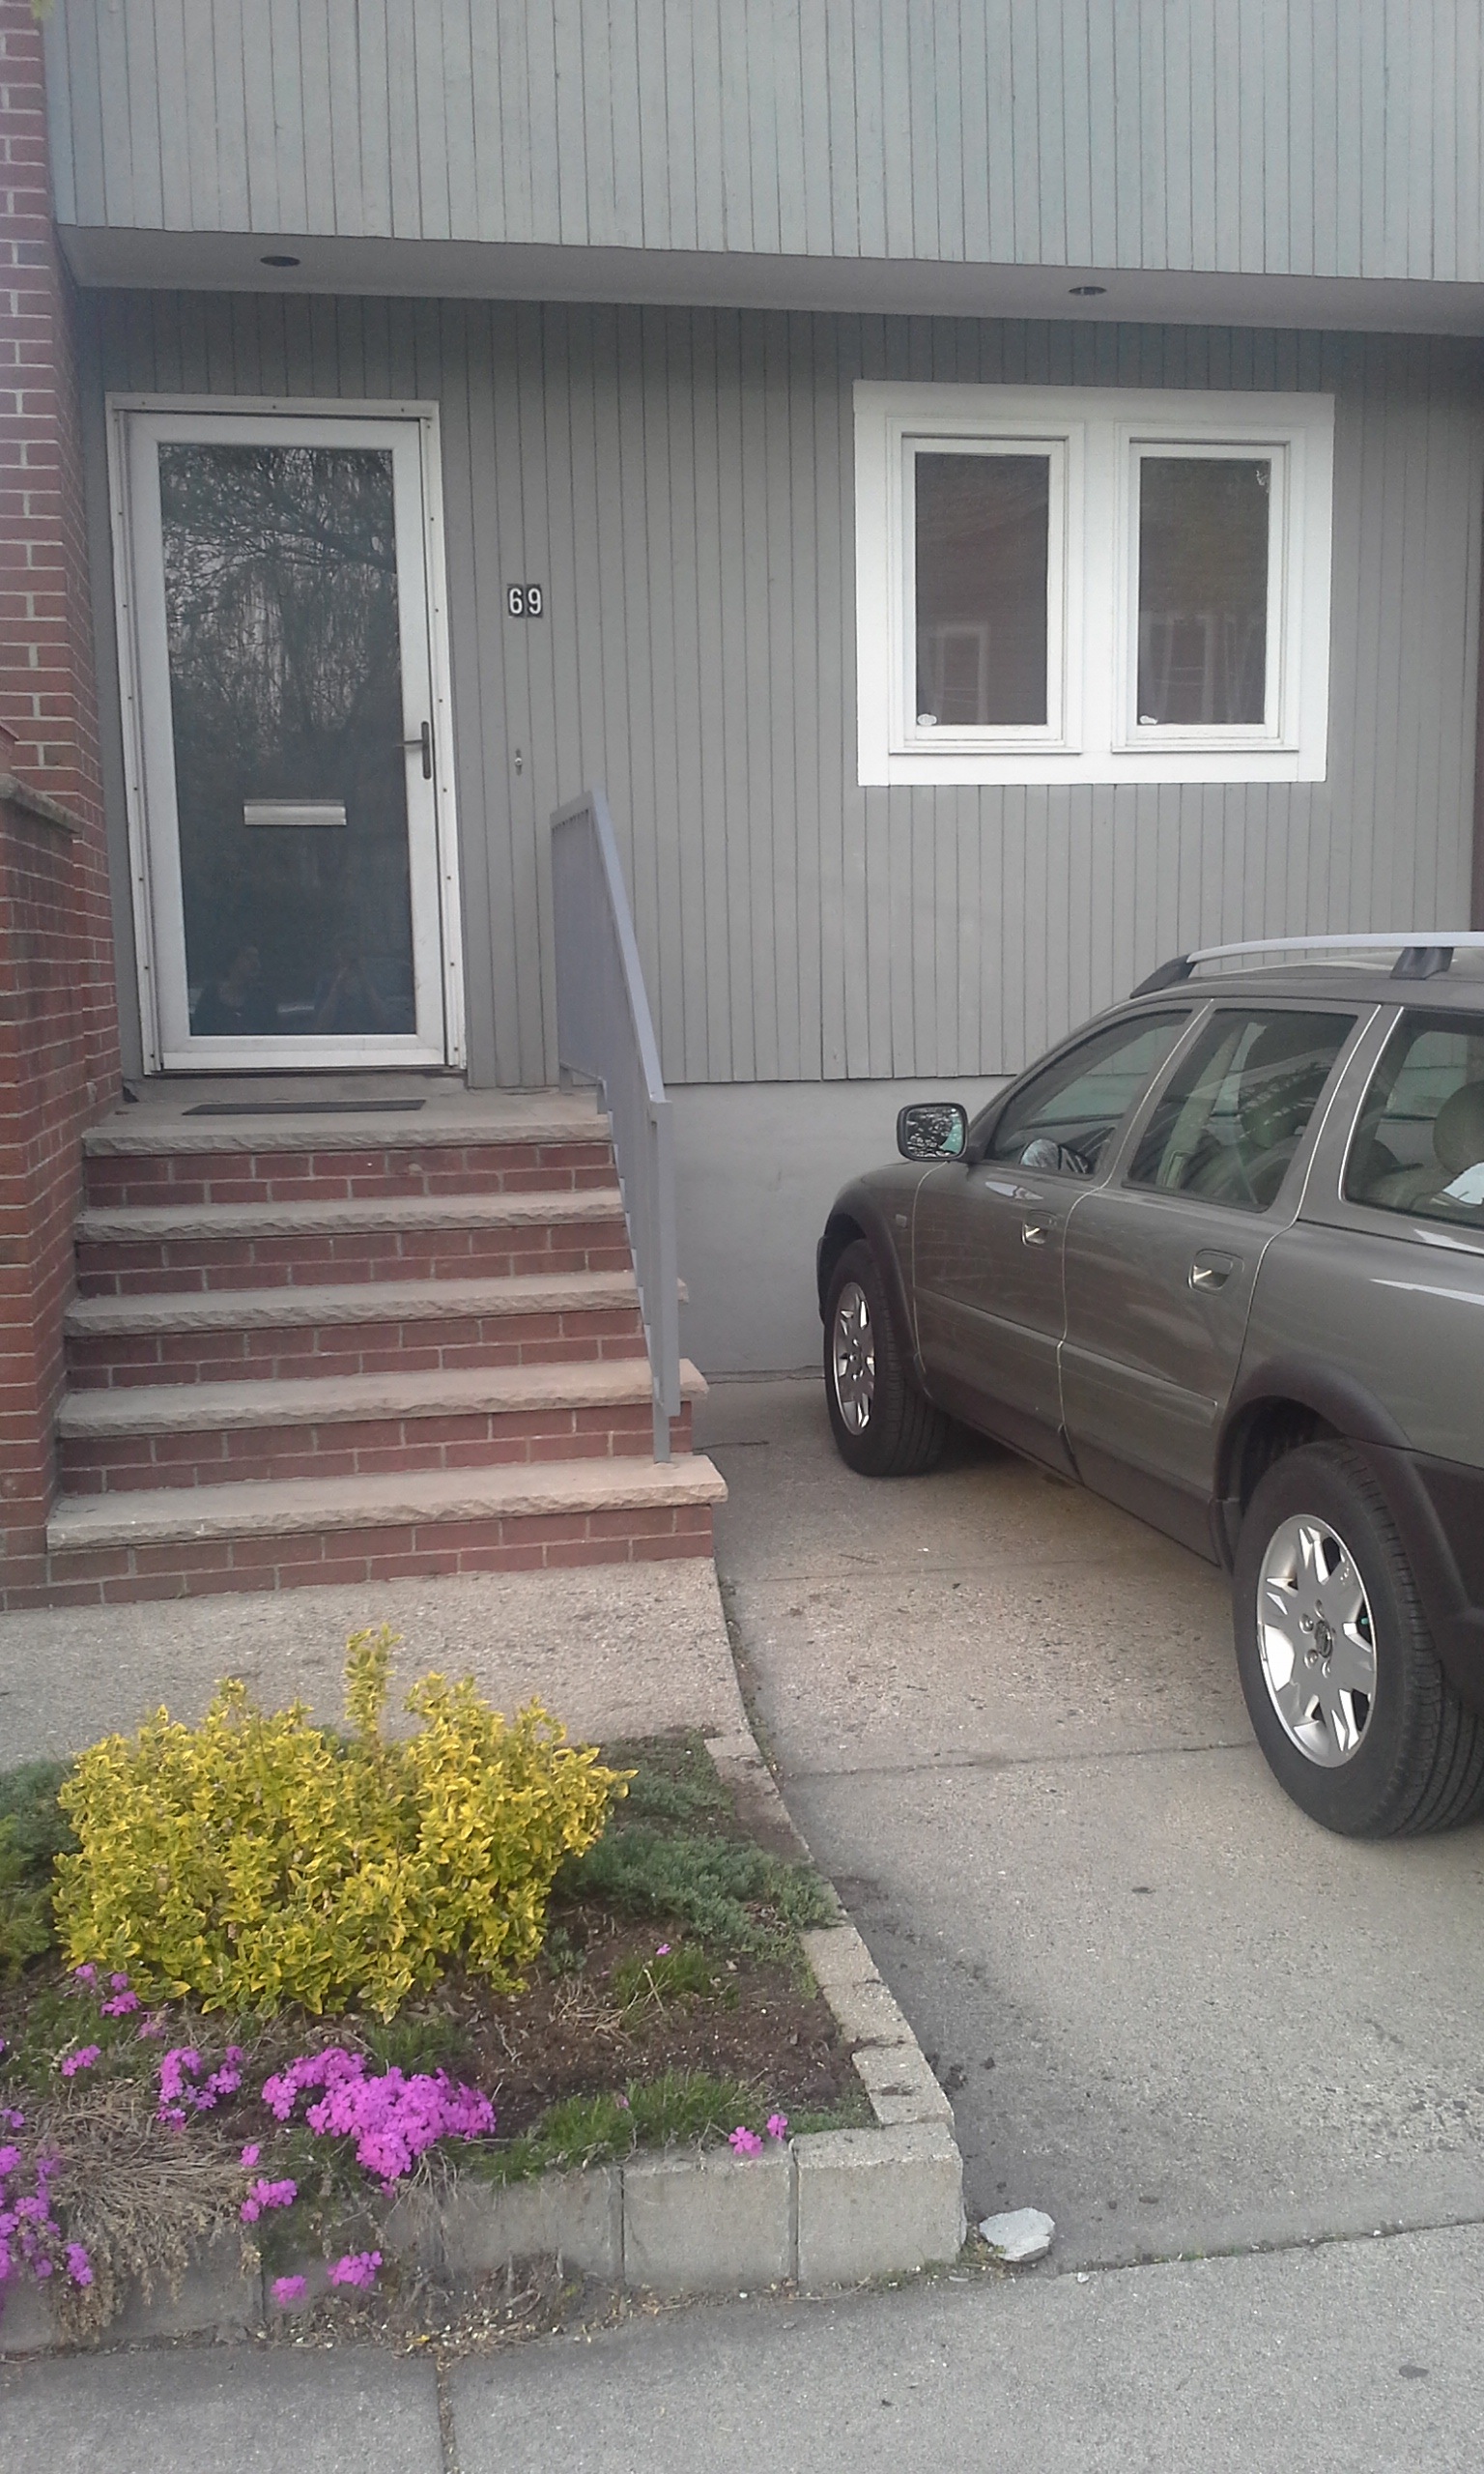 Figure 2: Homes that have replaced the older factories. Note the reconstruction leaving way for driveways, showing the omnipresence of the car.
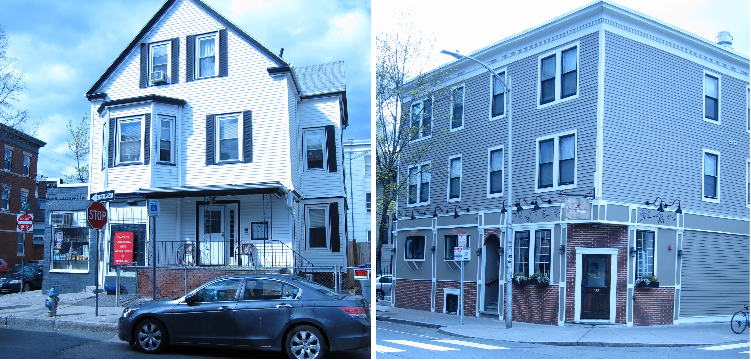 Figure 3: Commercial localities in renovated homes: on the left a neighborhood grocery store ;on the right a restaurant; both have been present in residences since the early 20th century
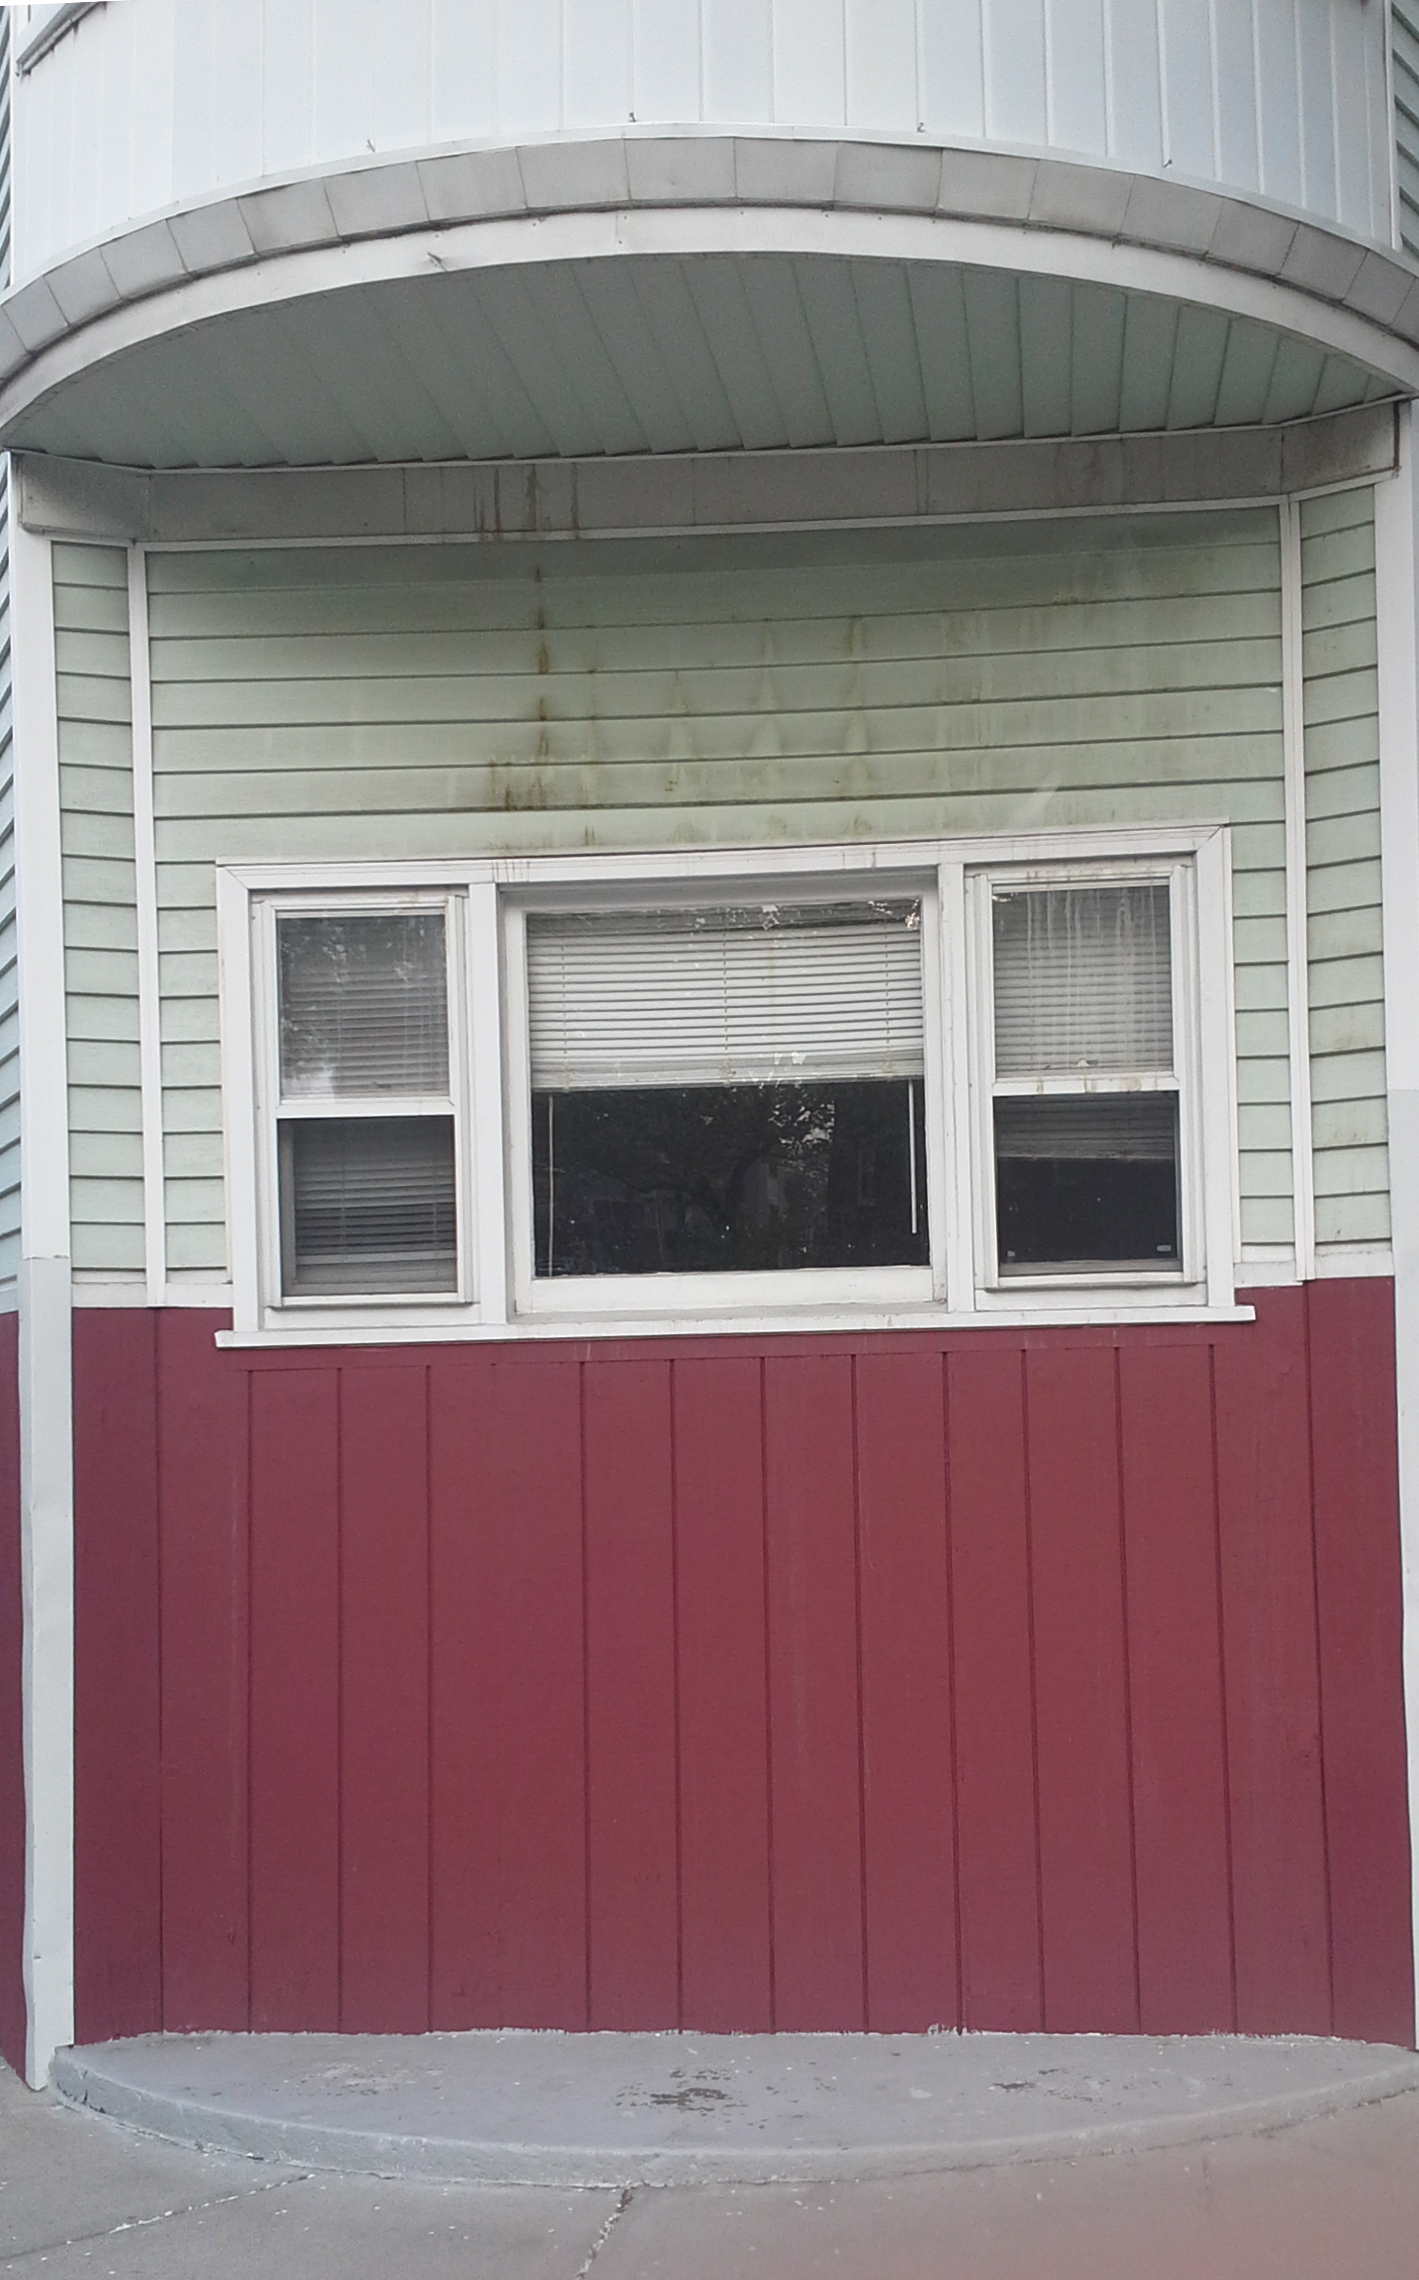
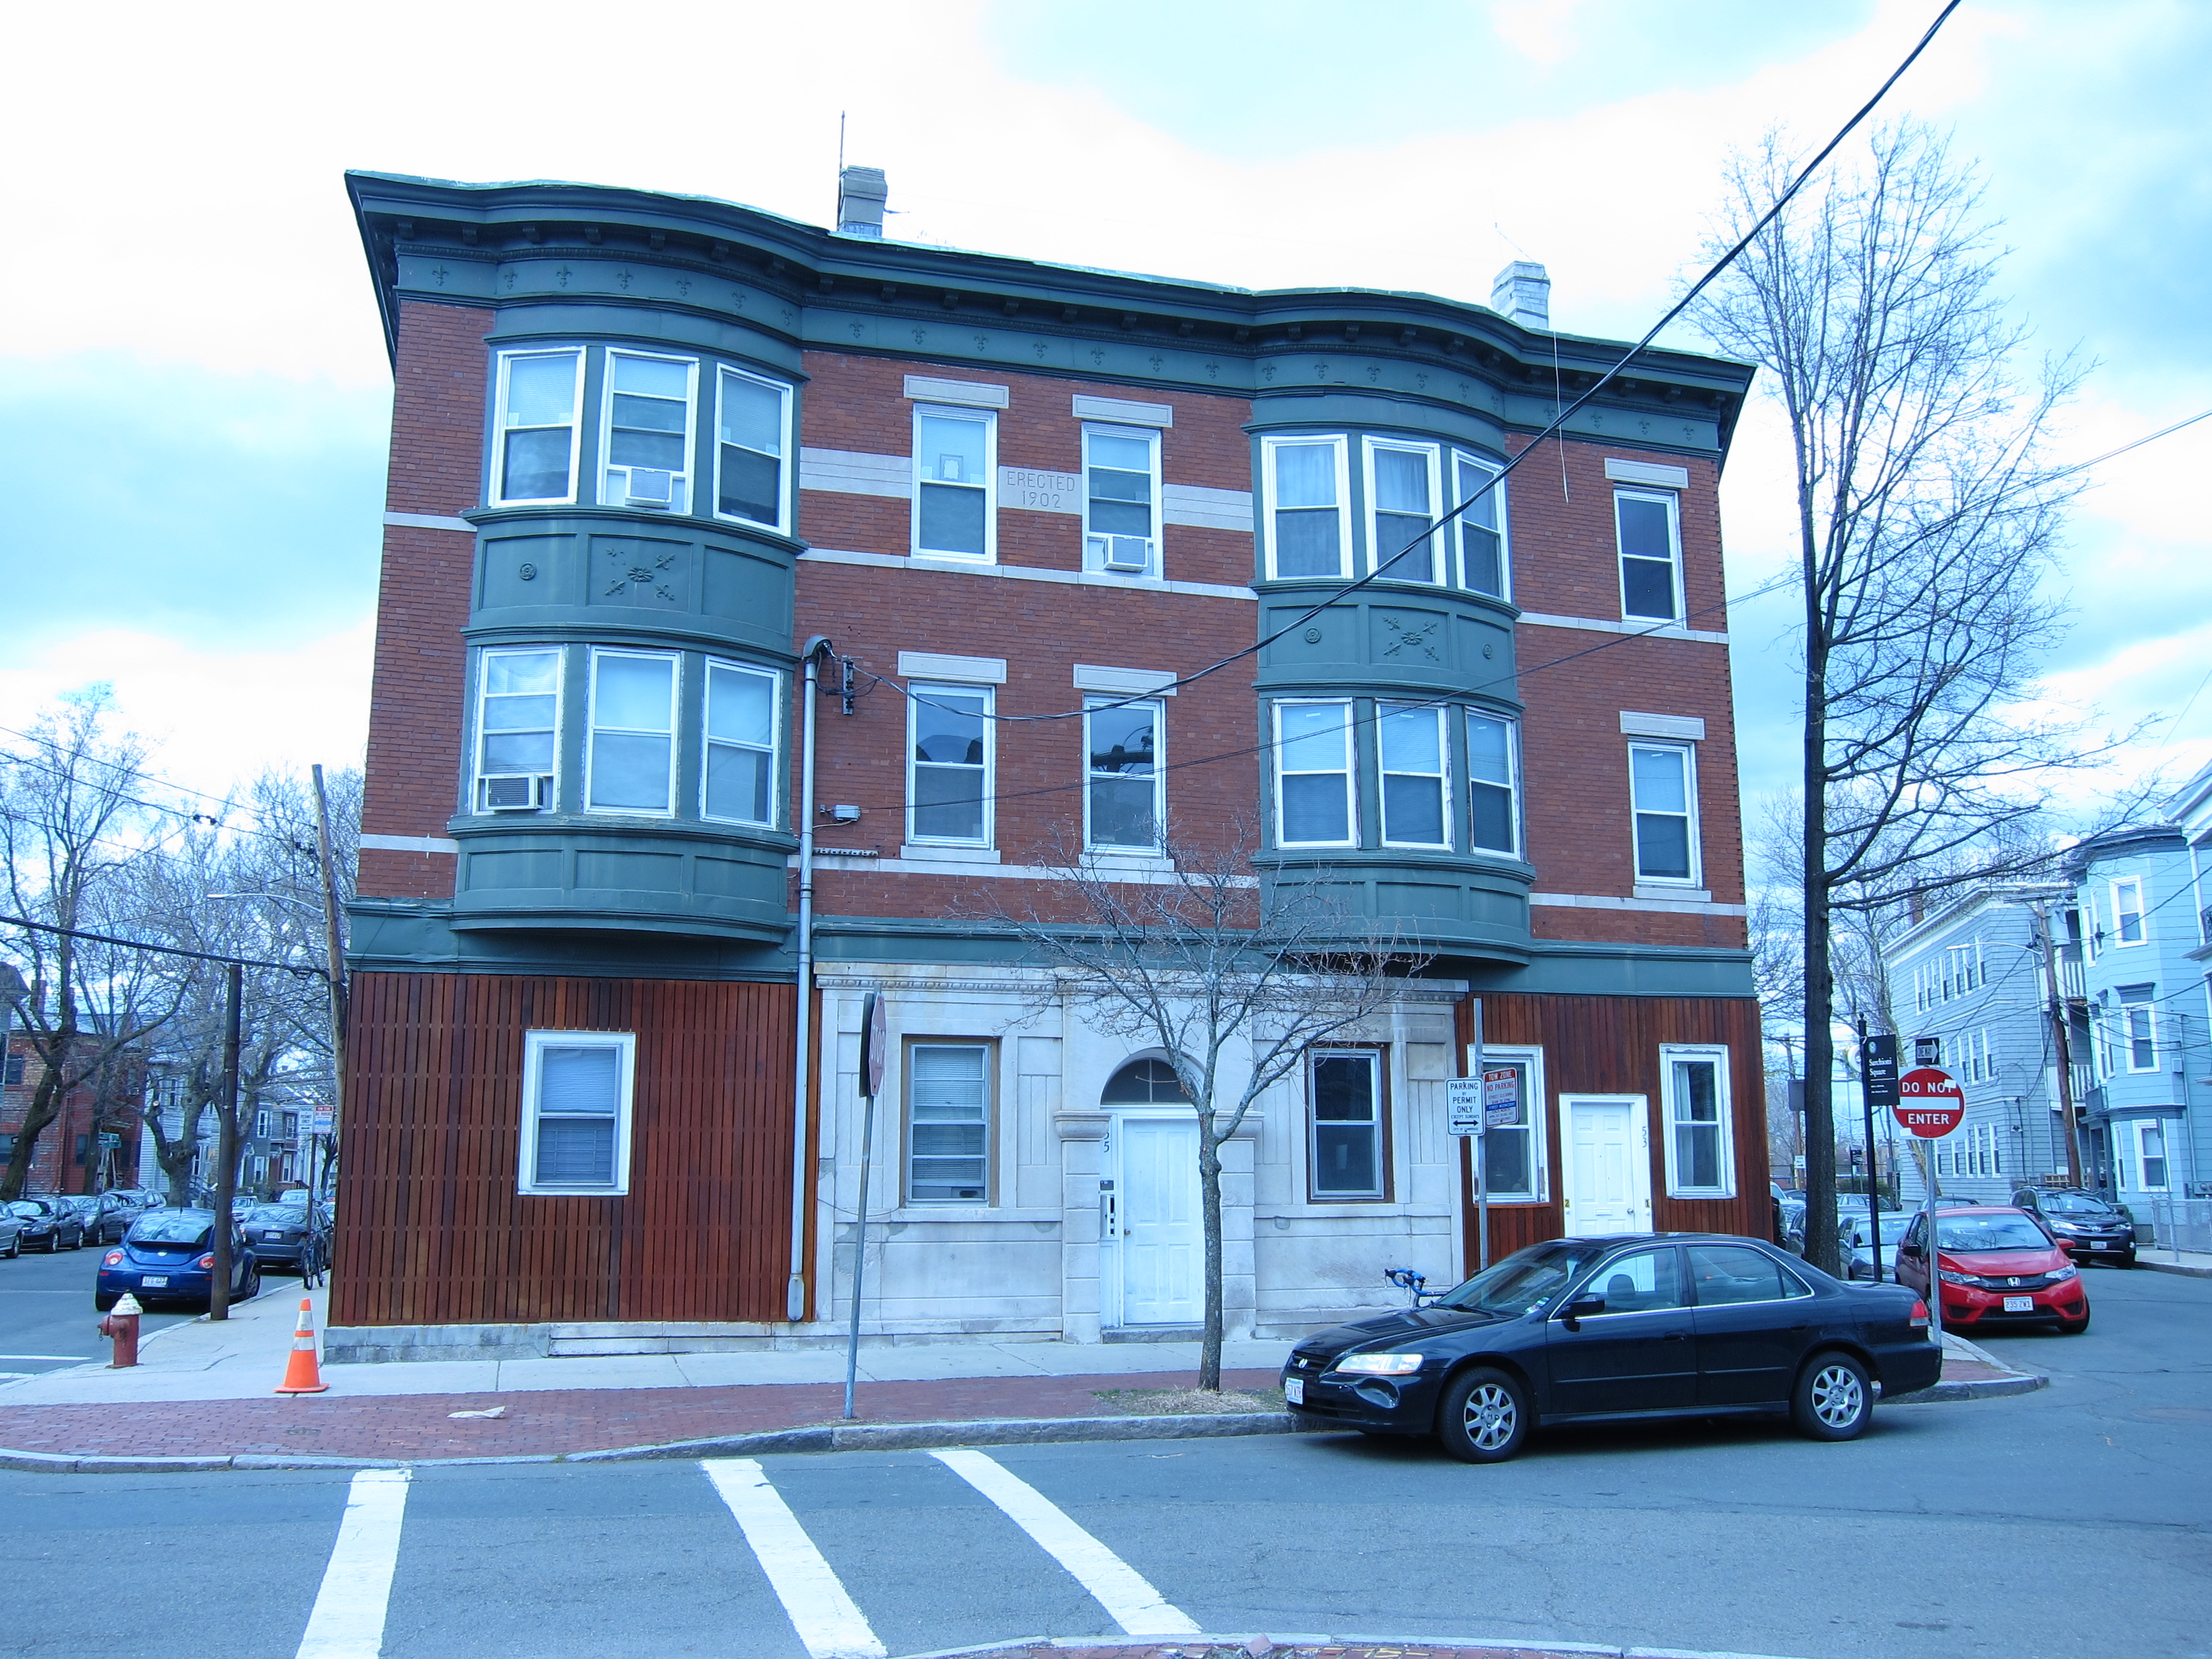
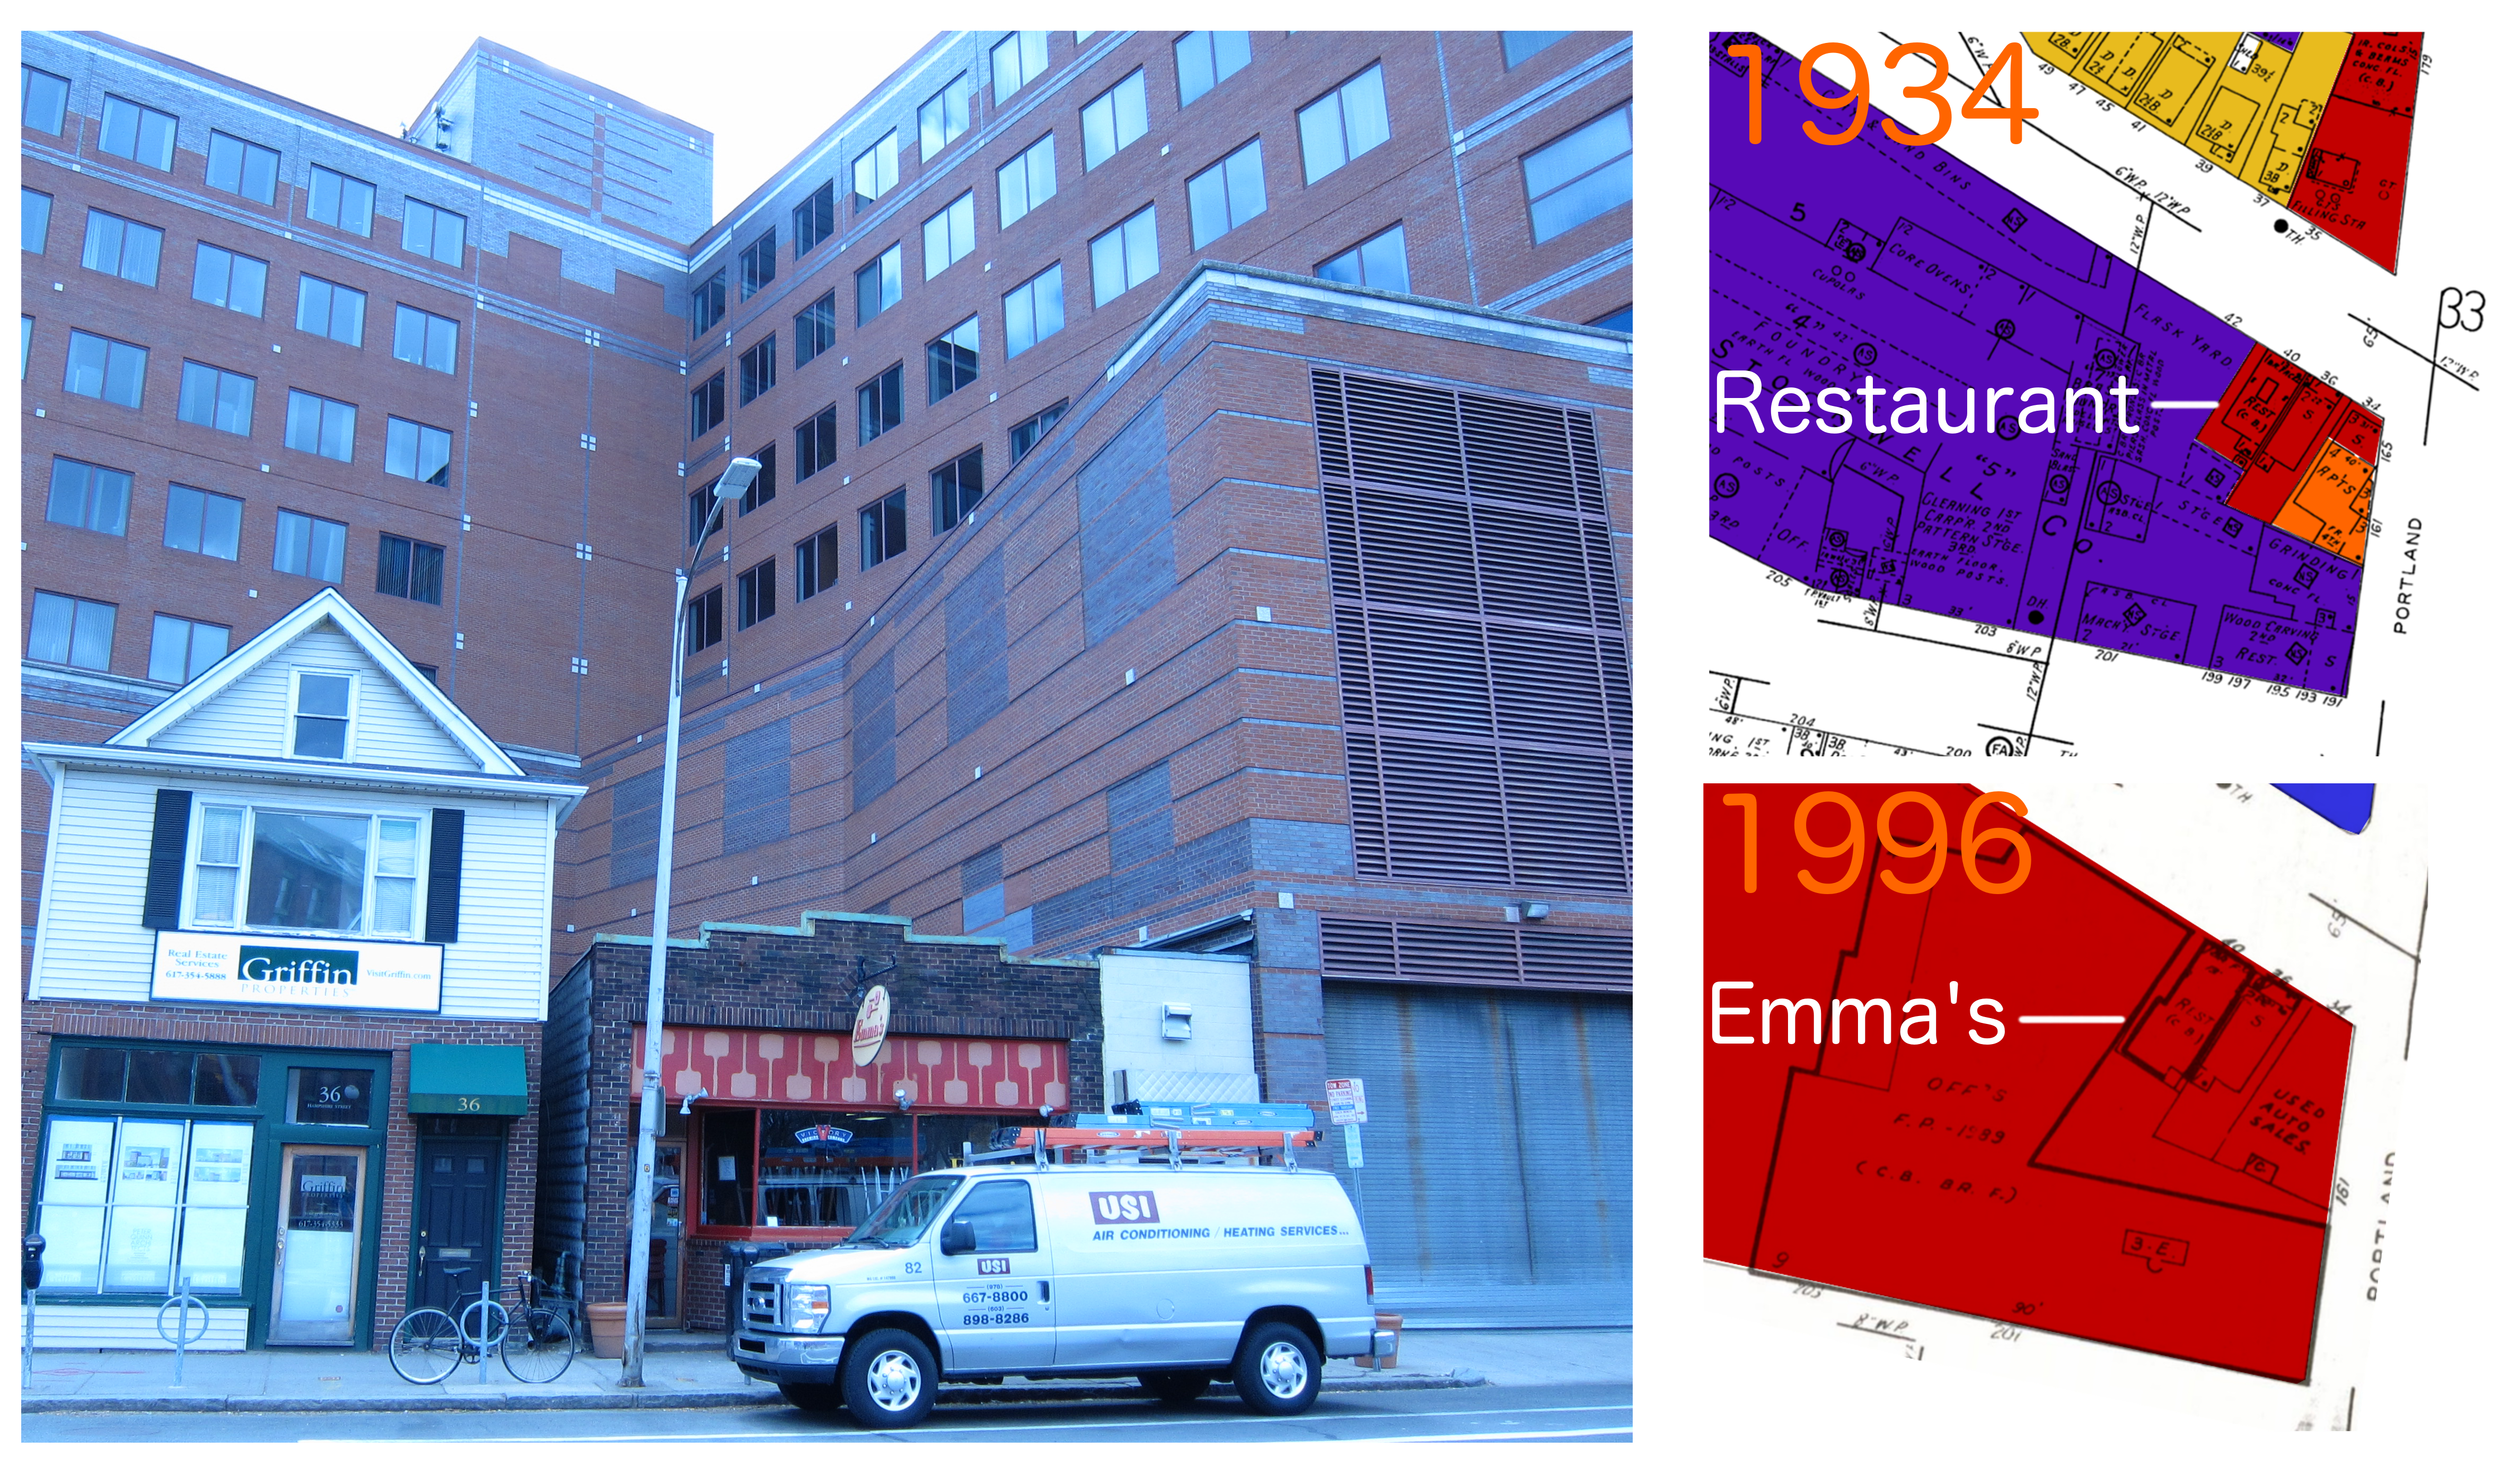 Figure 5: The superposition of different eras of commercial land use. In the foreground, Emma’s, a pizza joint present since the 1934 and realty firm. In the background, the biotech company headquarters that was established in the area only in the last 10 years. Sanborn maps show the evolution of the surrounding buildings while Emma's building has remained a restaurant for the past 80 years.
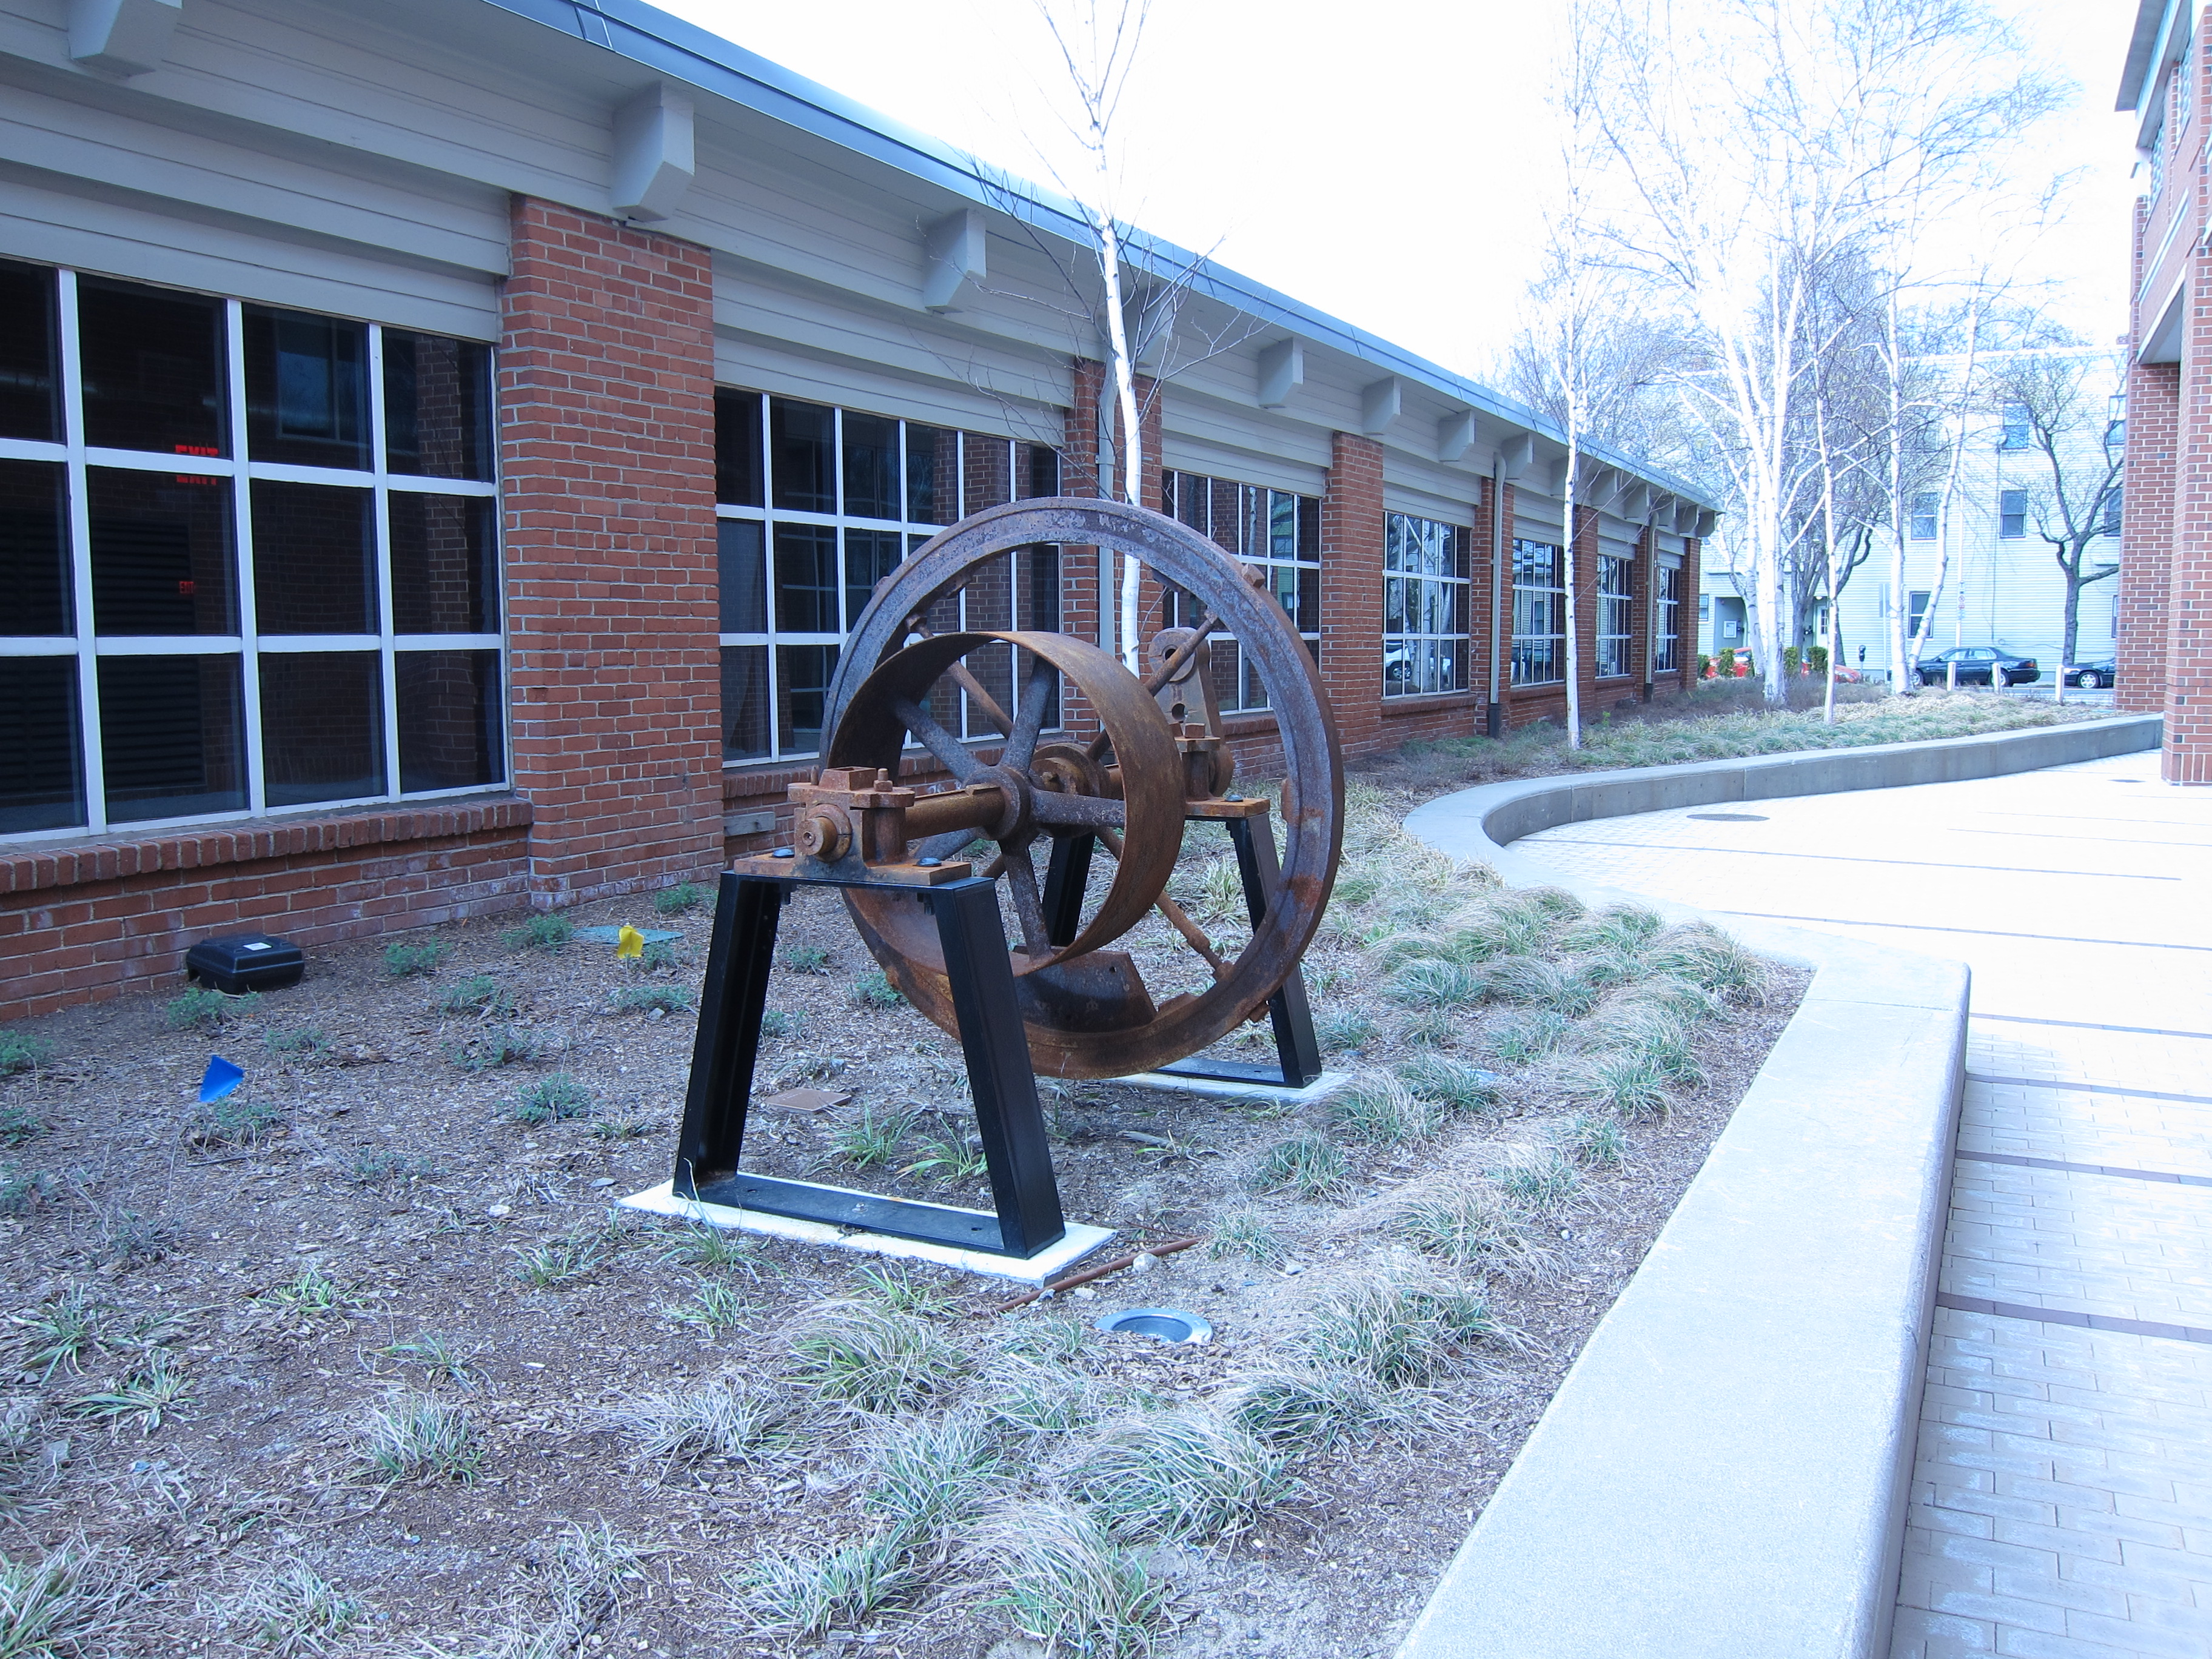 Figure 6: Monument to prior automotive land use located in an underused walkway between two buildings now housing biotech companies.
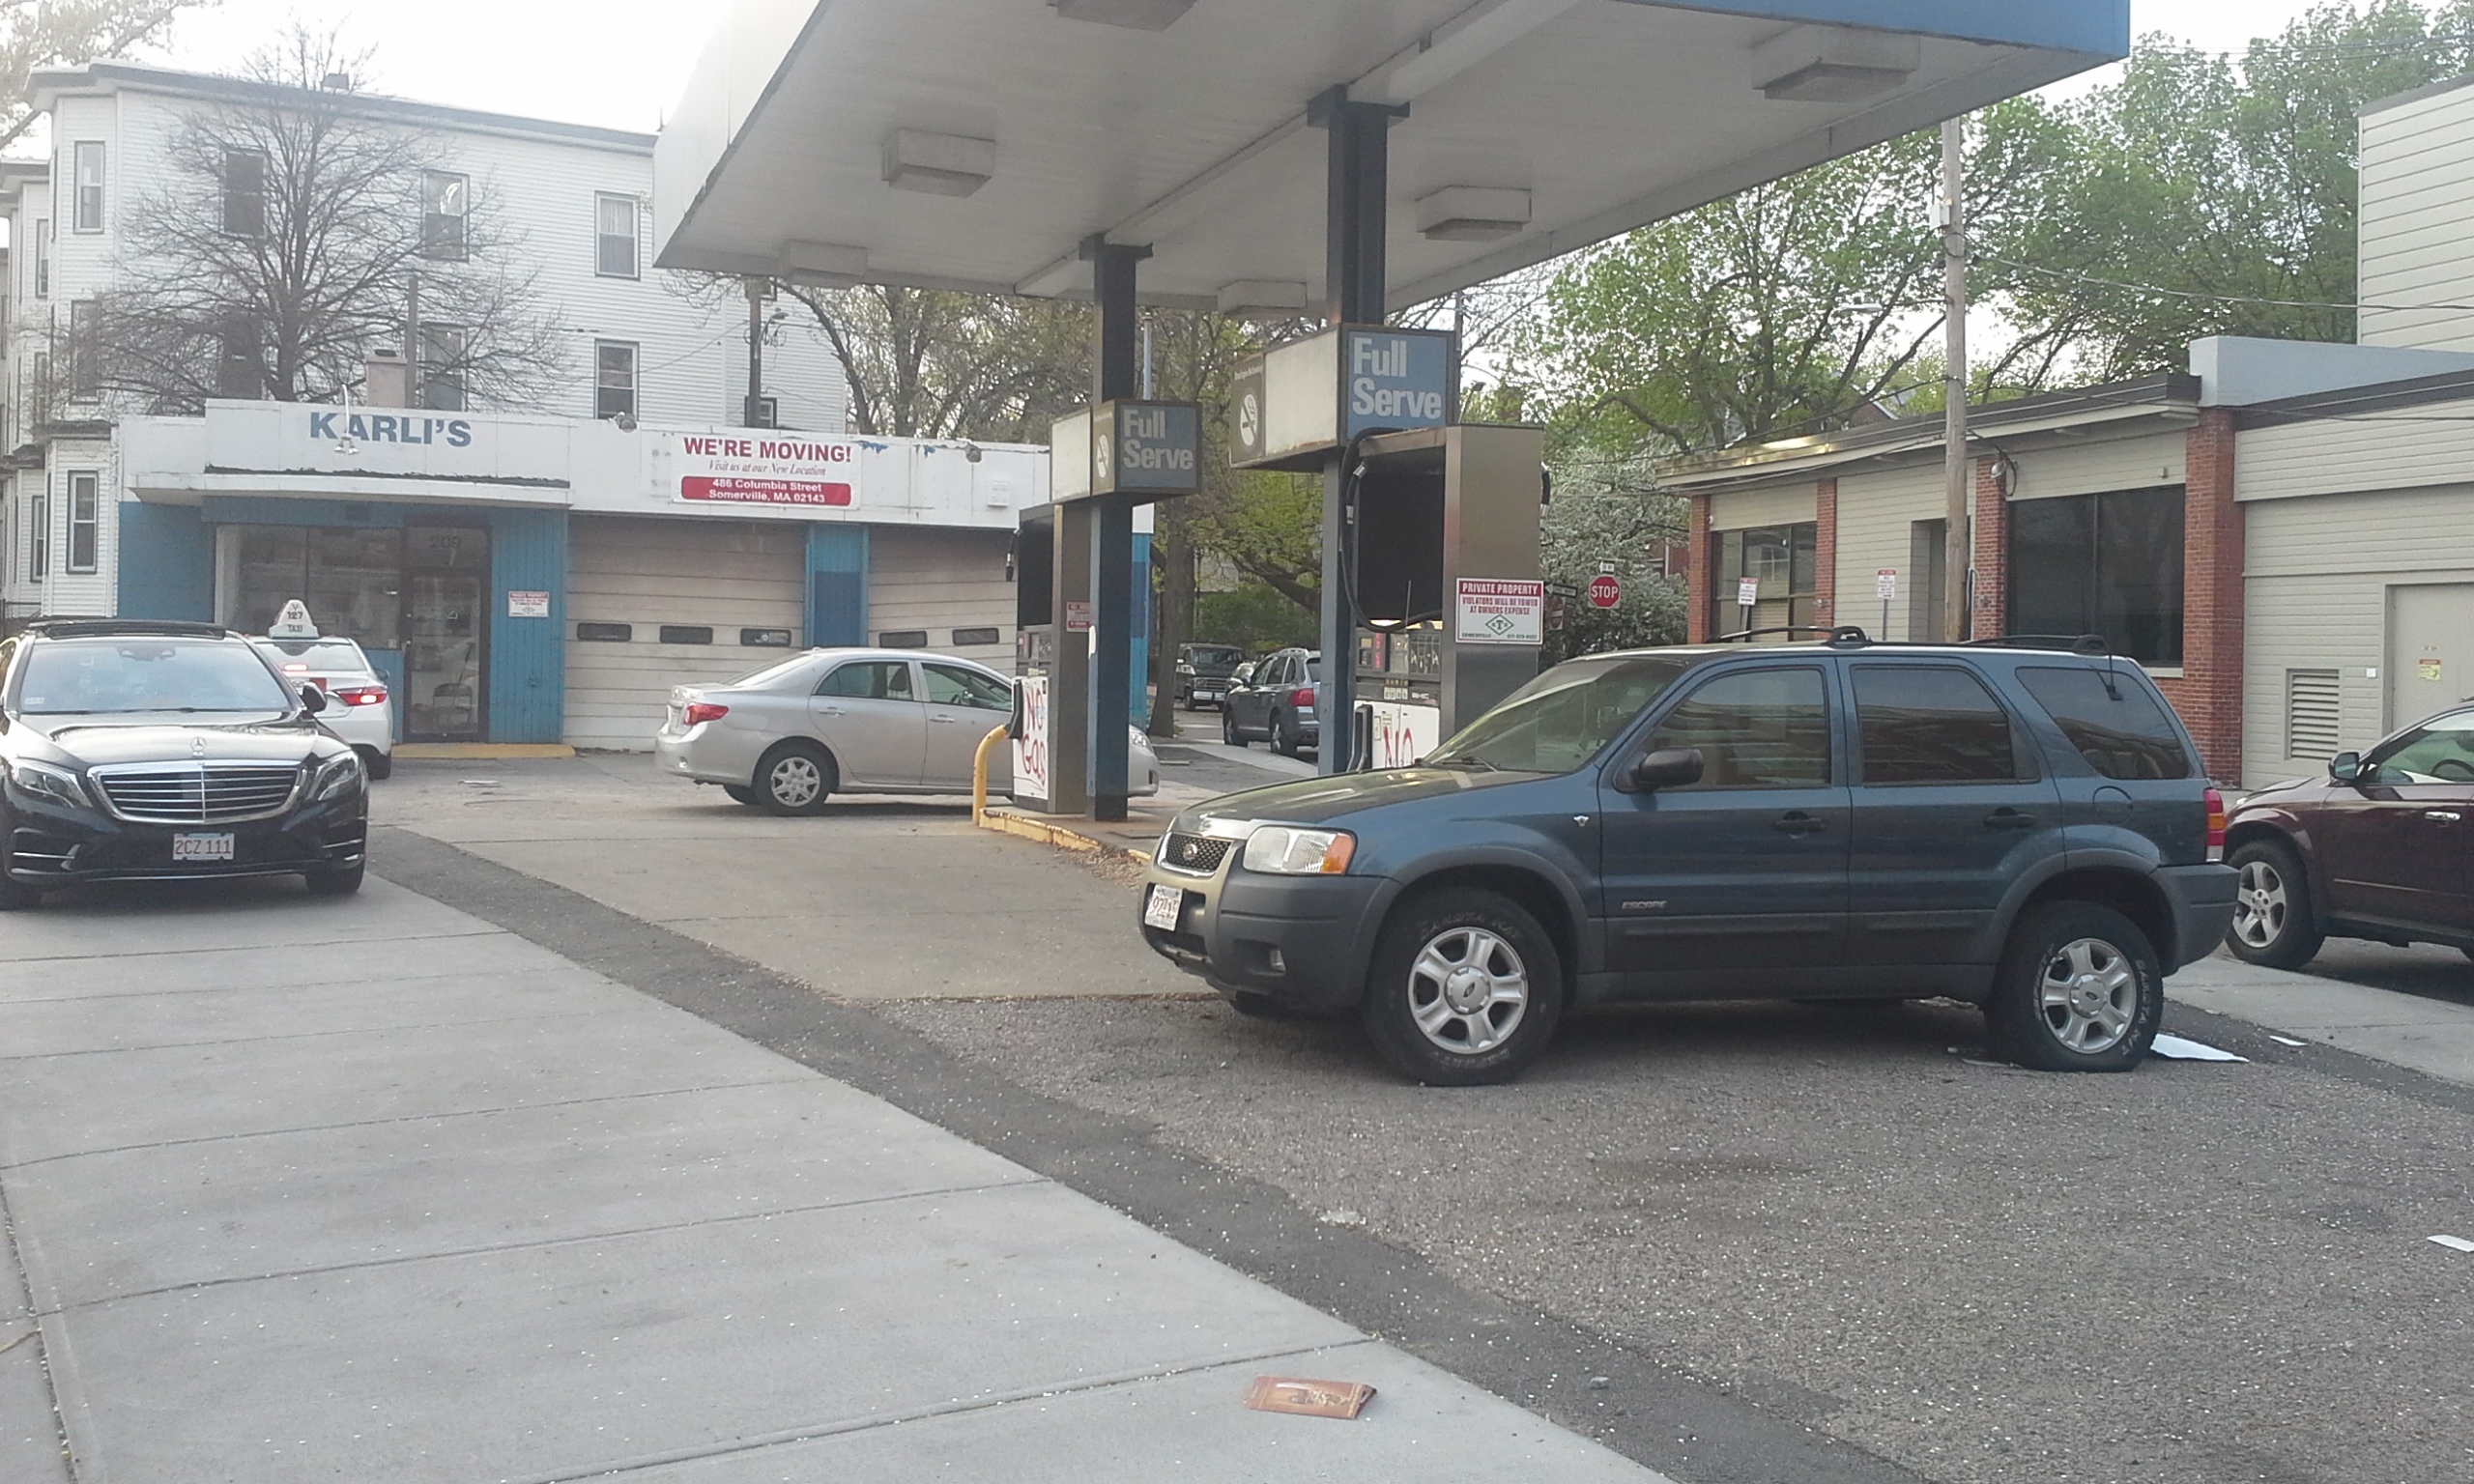 Figure 7: Right of the site, an abandoned gas station, with cars parked (flat tires) and "No gas" spray painted at the dispensers
 Figure 8: Development of different building styles mapped across the site, in the order in which they appeared: Federal in yellow, Second Empire in blue, Queen Anne in pink, Triple Deckers in orange, 20th century in purple, and Contemporary in green
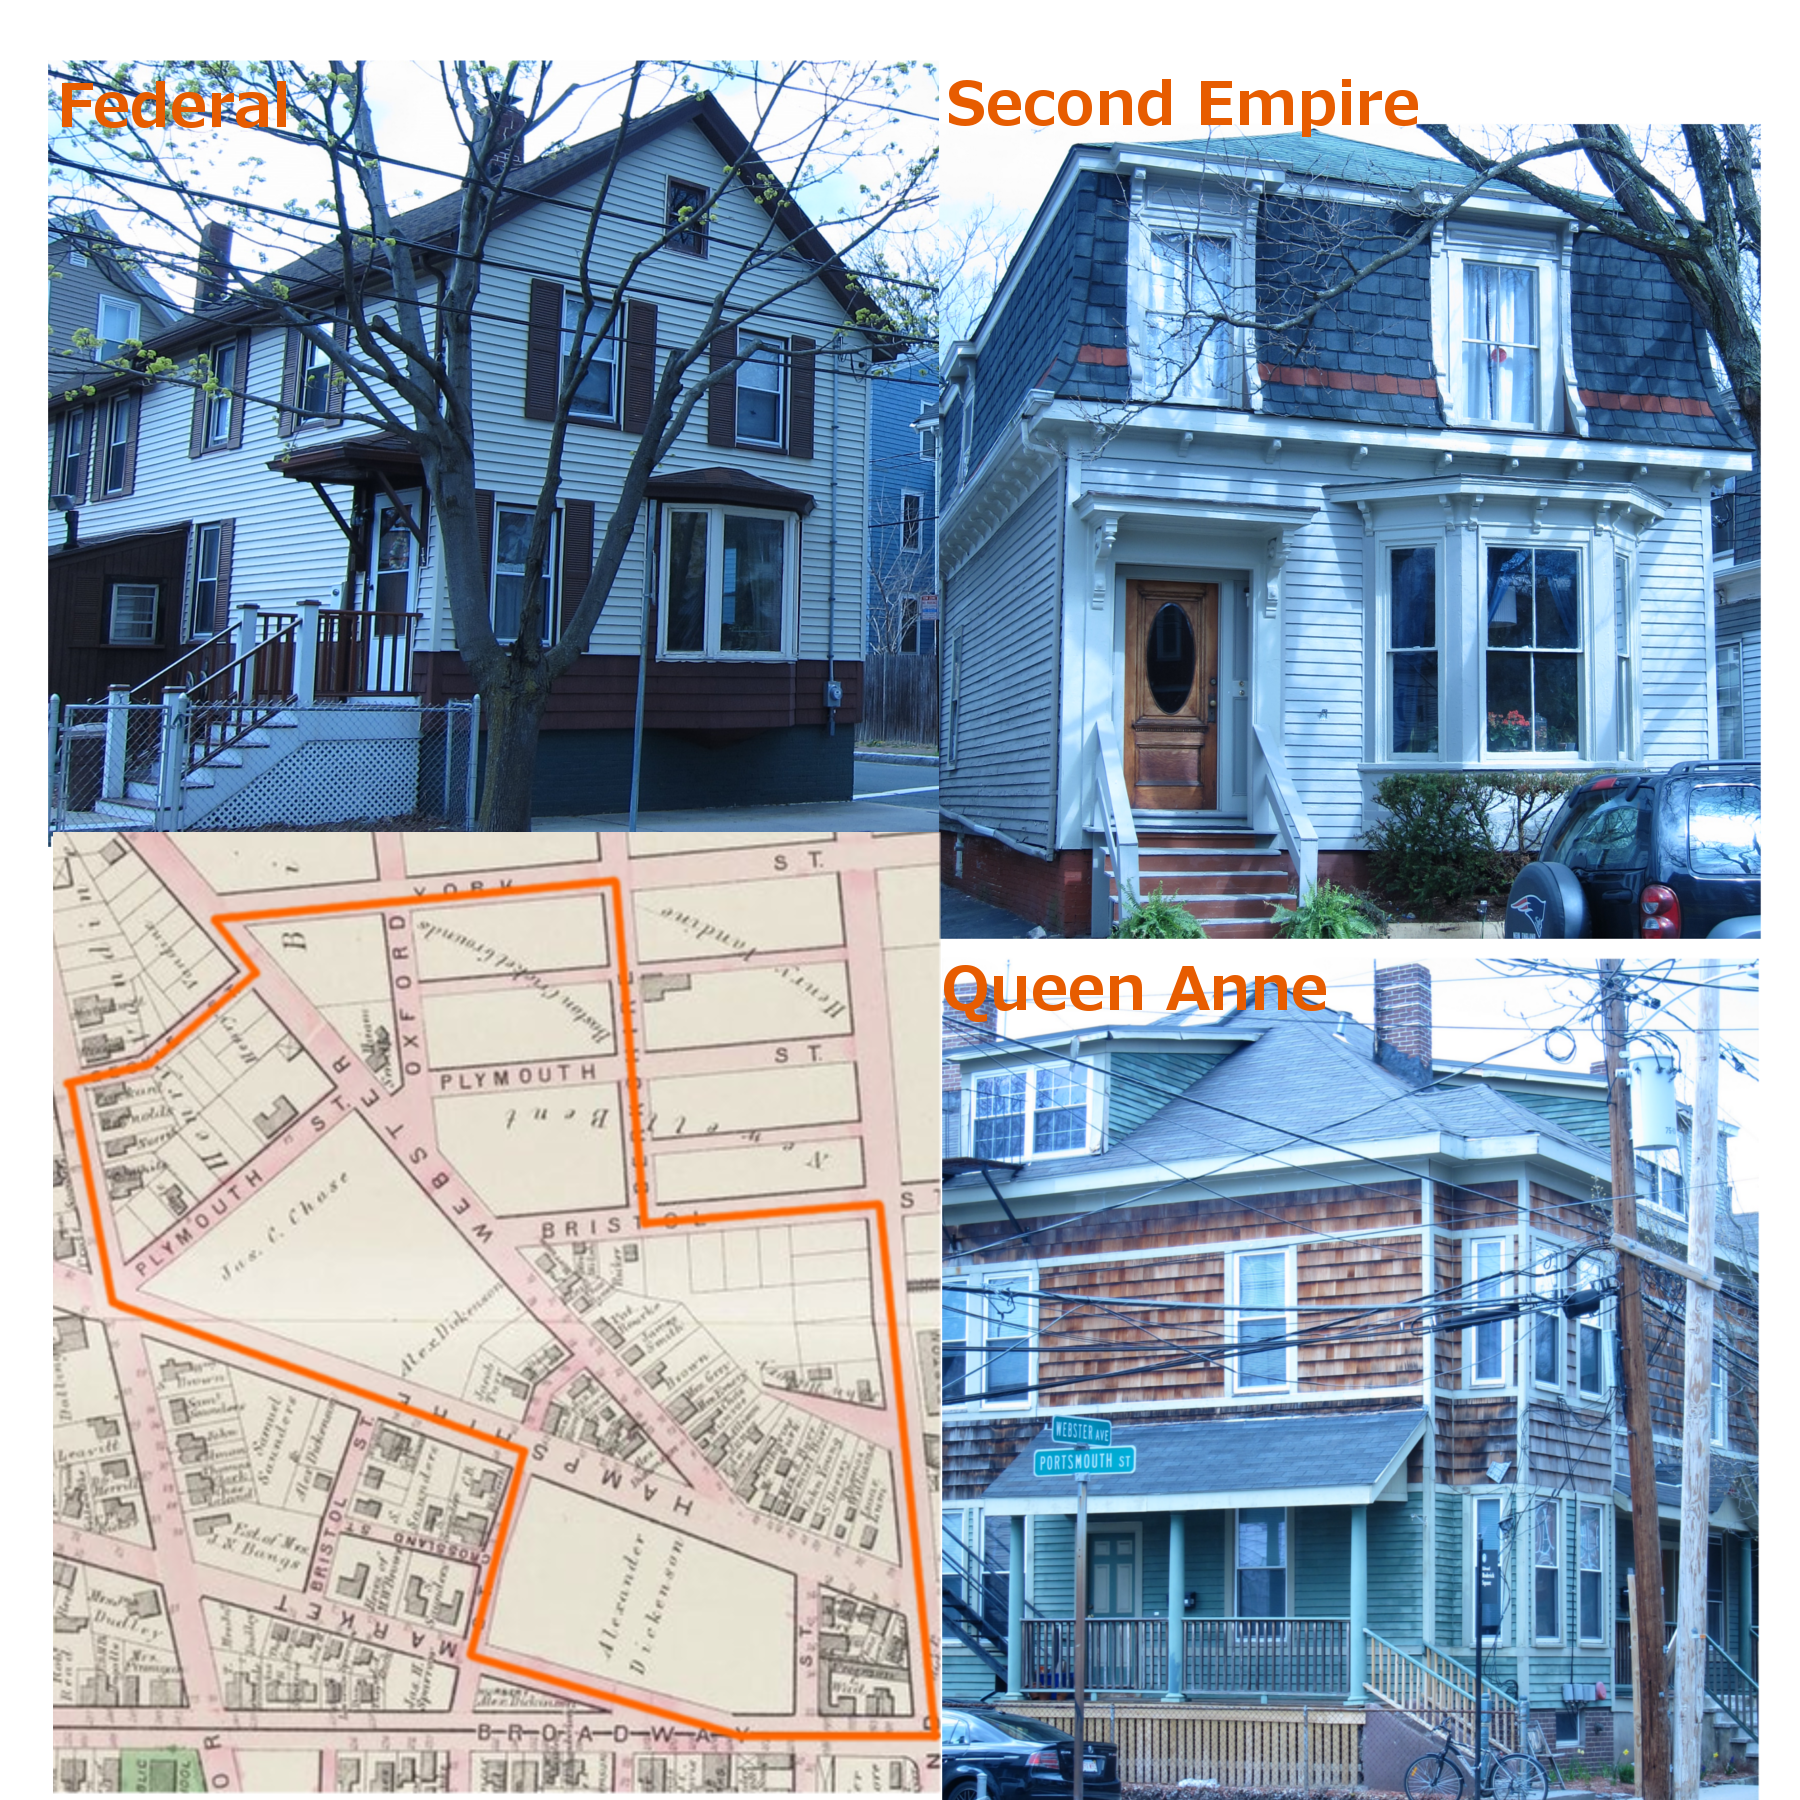 Figure 9: Hopkins map with site delineated in orange, with examples of important housing styles at the end of the 19th century as found on the site
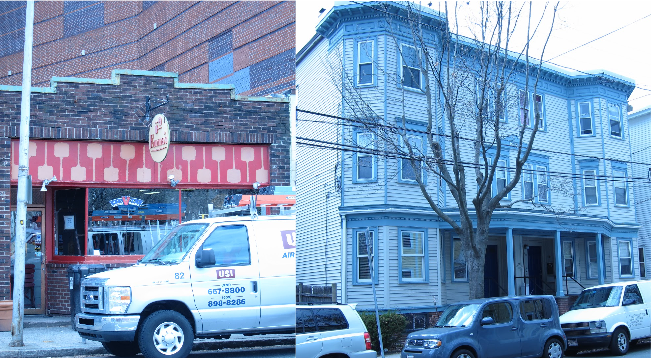 Figure 10: Two examples of houses popular in the 20th century , with on the left a possible example of the Art Deco movement from the 1920s, and on the right a triple-decker
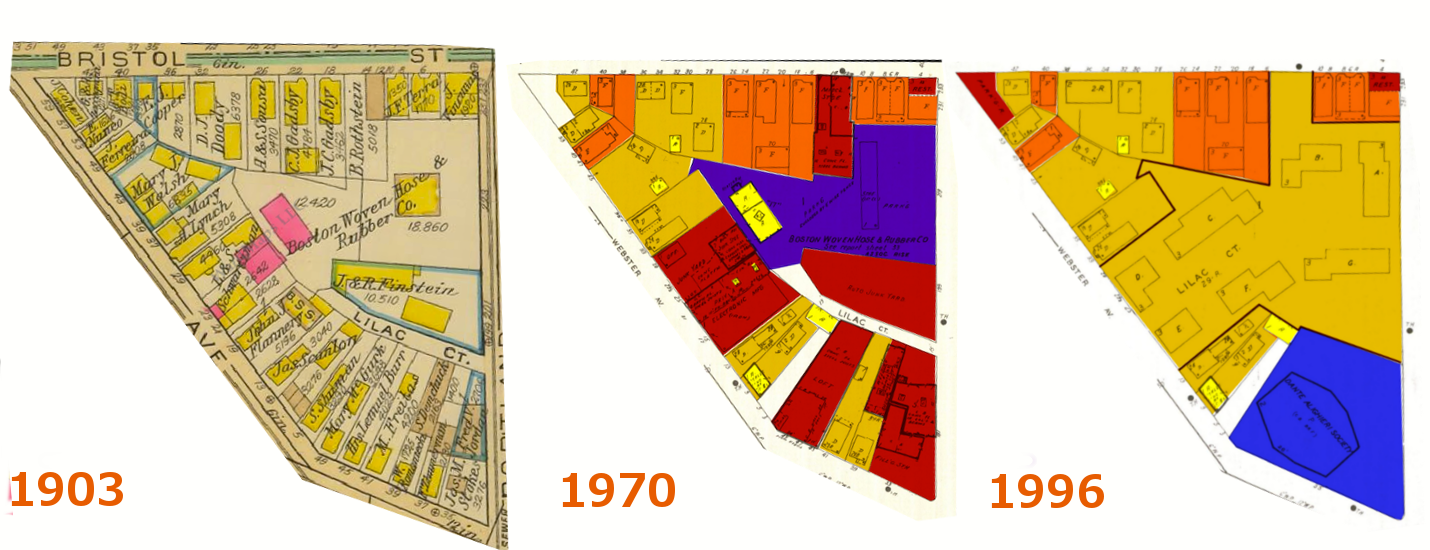 Figure 11: The evolution of Lilac Ct. throughout the 20th century, using the same color code as before. The 1903 map depicts the names of the owners whereas the 1970 and 1996 maps show the land uses, where a previously commercial area became fully residential
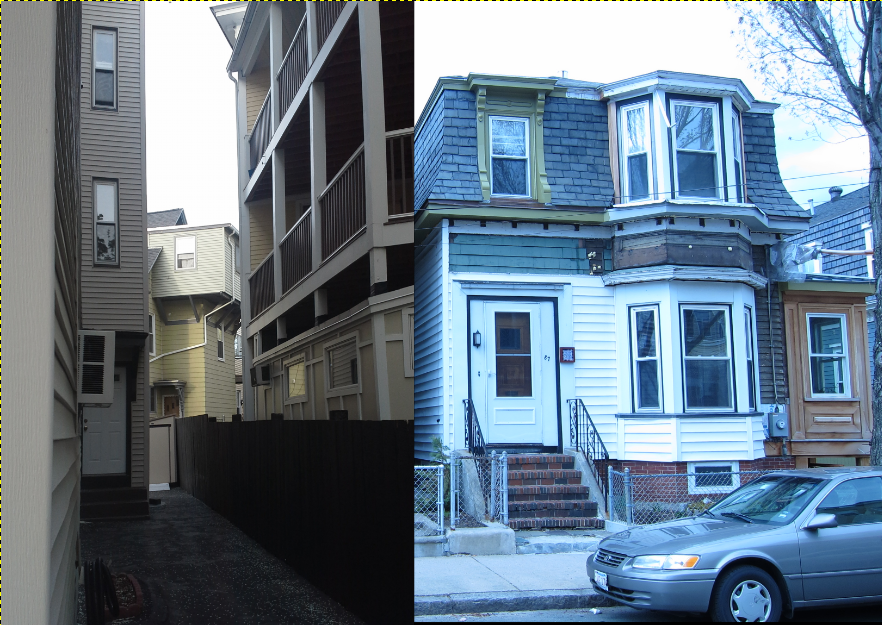 Figure 12: Two examples of old homes that have undergone reconstruction and additions
 Figure 13: Diagram depicting different cultural indicators, in order of appearance: St. Patrick's Church; the Dante Alighieri Italian Cultural Center; Irish surnamed squares; Italian surnamed squares; Portuguese surnamed squares
Footnotes:
1 The Massachusetts Preservation Coalition and The National Trust for Historic Preservation, "Preserving Historic Religious Properties: A Toolkit for Congregations & Community Leaders" (June 2005), p.34
2 Phillip Hu, "Traces and Trends: Architectural Guide" (Spring 2015), pp. 2-6
3 Anne Spirn, "Once and Future City: Timeline".
4 S. B. Warner, Jr. “A Brief History of Boston”, Mapping Boston, ed. A. Krieger, D. Cobb, A. Turner. (MIT Press: Cambridge, Massachusetts and London, England), p.8
5 K. T. Jackson, Crabgrass Frontier: The Suburbanization of the United States, (Oxford University Press: New York and Oxford,1985), p.126
6 Dolores Hayden, "The Power of Place: Urban Landscapes as Public History" (Asco Trade Typesetting Ltd, 1995), p.34
7 Warner, Mapping Boston, p.8
8 Mass. Preservation Coalition, "Preserving Historic Religious Properties” p.34
9 Dolores Hayden, "The Power of Place: Urban Landscapes as Public History" (Asco Trade Typesetting Ltd, 1995), p.16
10 Hayden, "The Power of Place", p.38
10 Hayden, "The Power of Place", p.16
Bibliography:
The Massachusetts Preservation Coalition and The National Trust for Historic Preservation, "Preserving Historic Religious Properties: A Toolkit for Congregations & Community Leaders" (June 2005), p.34
Phillip Hu, "Traces and Trends: Architectural Guide" (Spring 2015), pp. 2-6
Anne Spirn, "Once and Future City: Timeline".
K. T. Jackson, Crabgrass Frontier: The Suburbanization of the United States, (Oxford University Press: New York and Oxford,1985), p.126
S. B. Warner, Jr. “A Brief History of Boston”, Mapping Boston, ed. A. Krieger, D. Cobb, A. Turner. (MIT Press: Cambridge, Massachusetts and London, England), p.8
Dolores Hayden, "The Power of Place: Urban Landscapes as Public History" (Asco Trade Typesetting Ltd, 1995), p.16, 34, 38
Image sources: All the images taken and altered by the author unless otherwise noted.
Fig. 1: Sanborn Map Company, “Sheet 18”, Insurance Maps of Cambridge, Massachusetts, Vol. One (New York, 1970)
Sanborn Map Company, “Sheet 18”, Insurance Maps of Cambridge, Massachusetts, Vol. One (New York, 1996)
Fig.5: Sanborn Map Company, “Sheet 18”, Insurance Maps of Cambridge, Massachusetts, Vol. One (New York, 1934)
Sanborn Map Company, “Sheet 18”, Insurance Maps of Cambridge, Massachusetts, Vol. One (New York, 1996)
Fig. 8: “Cambridge, MA.” Map. Google Maps. (Google, 2015)
Fig. 9: G. M. Hopkins & Co., “Part of the Wards 2,3 &4, Cambridge - Plate 9” Atlas of the City of Cambridge, Massachusetts:From Actual Surveys and Official Plans (Philadelphia, 1903)
G. M. Hopkins & Co., “Part of the Wards 3&5, Cambridge - Plate 13” Atlas of the City of Cambridge, Massachusetts:From Actual Surveys and Official Plans (Philadelphia, 1903)
Fig. 11: G. W. Bromley and Co., "Sheet 9" Atlas of the City of Cambridge, Massachusetts, (Philadelphia, 1930)
Sanborn Map Company, “Sheet 18”, Insurance Maps of Cambridge, Massachusetts, Vol. One (New York, 1970)
Sanborn Map Company, “Sheet 18”, Insurance Maps of Cambridge, Massachusetts, Vol. One (New York, 1996)
Fig. 13: “Cambridge, MA.” Map. Google Maps. (Google, 2015)