Since its humble origins as reclaimed marshland, Fenway has transformed from a vacant expanse into a bustling, mixed-use district. However, its transition has, by no means, been direct. Land commodification and the prevailing investor ethos hindered development in the two decades following Fenway's birth. Then, kick-started by the Red Sox's arrival in 1911, the area became a bastion of automotive service industry, remaining so for the rest of the twentieth century. Today, the area is rapidly gentrifying. Indeed, understanding Fenway's evolution can be a springboard for comprehending the driving factors behind change in other urban areas.
Marsh Reclamation and the Public Health Initiative
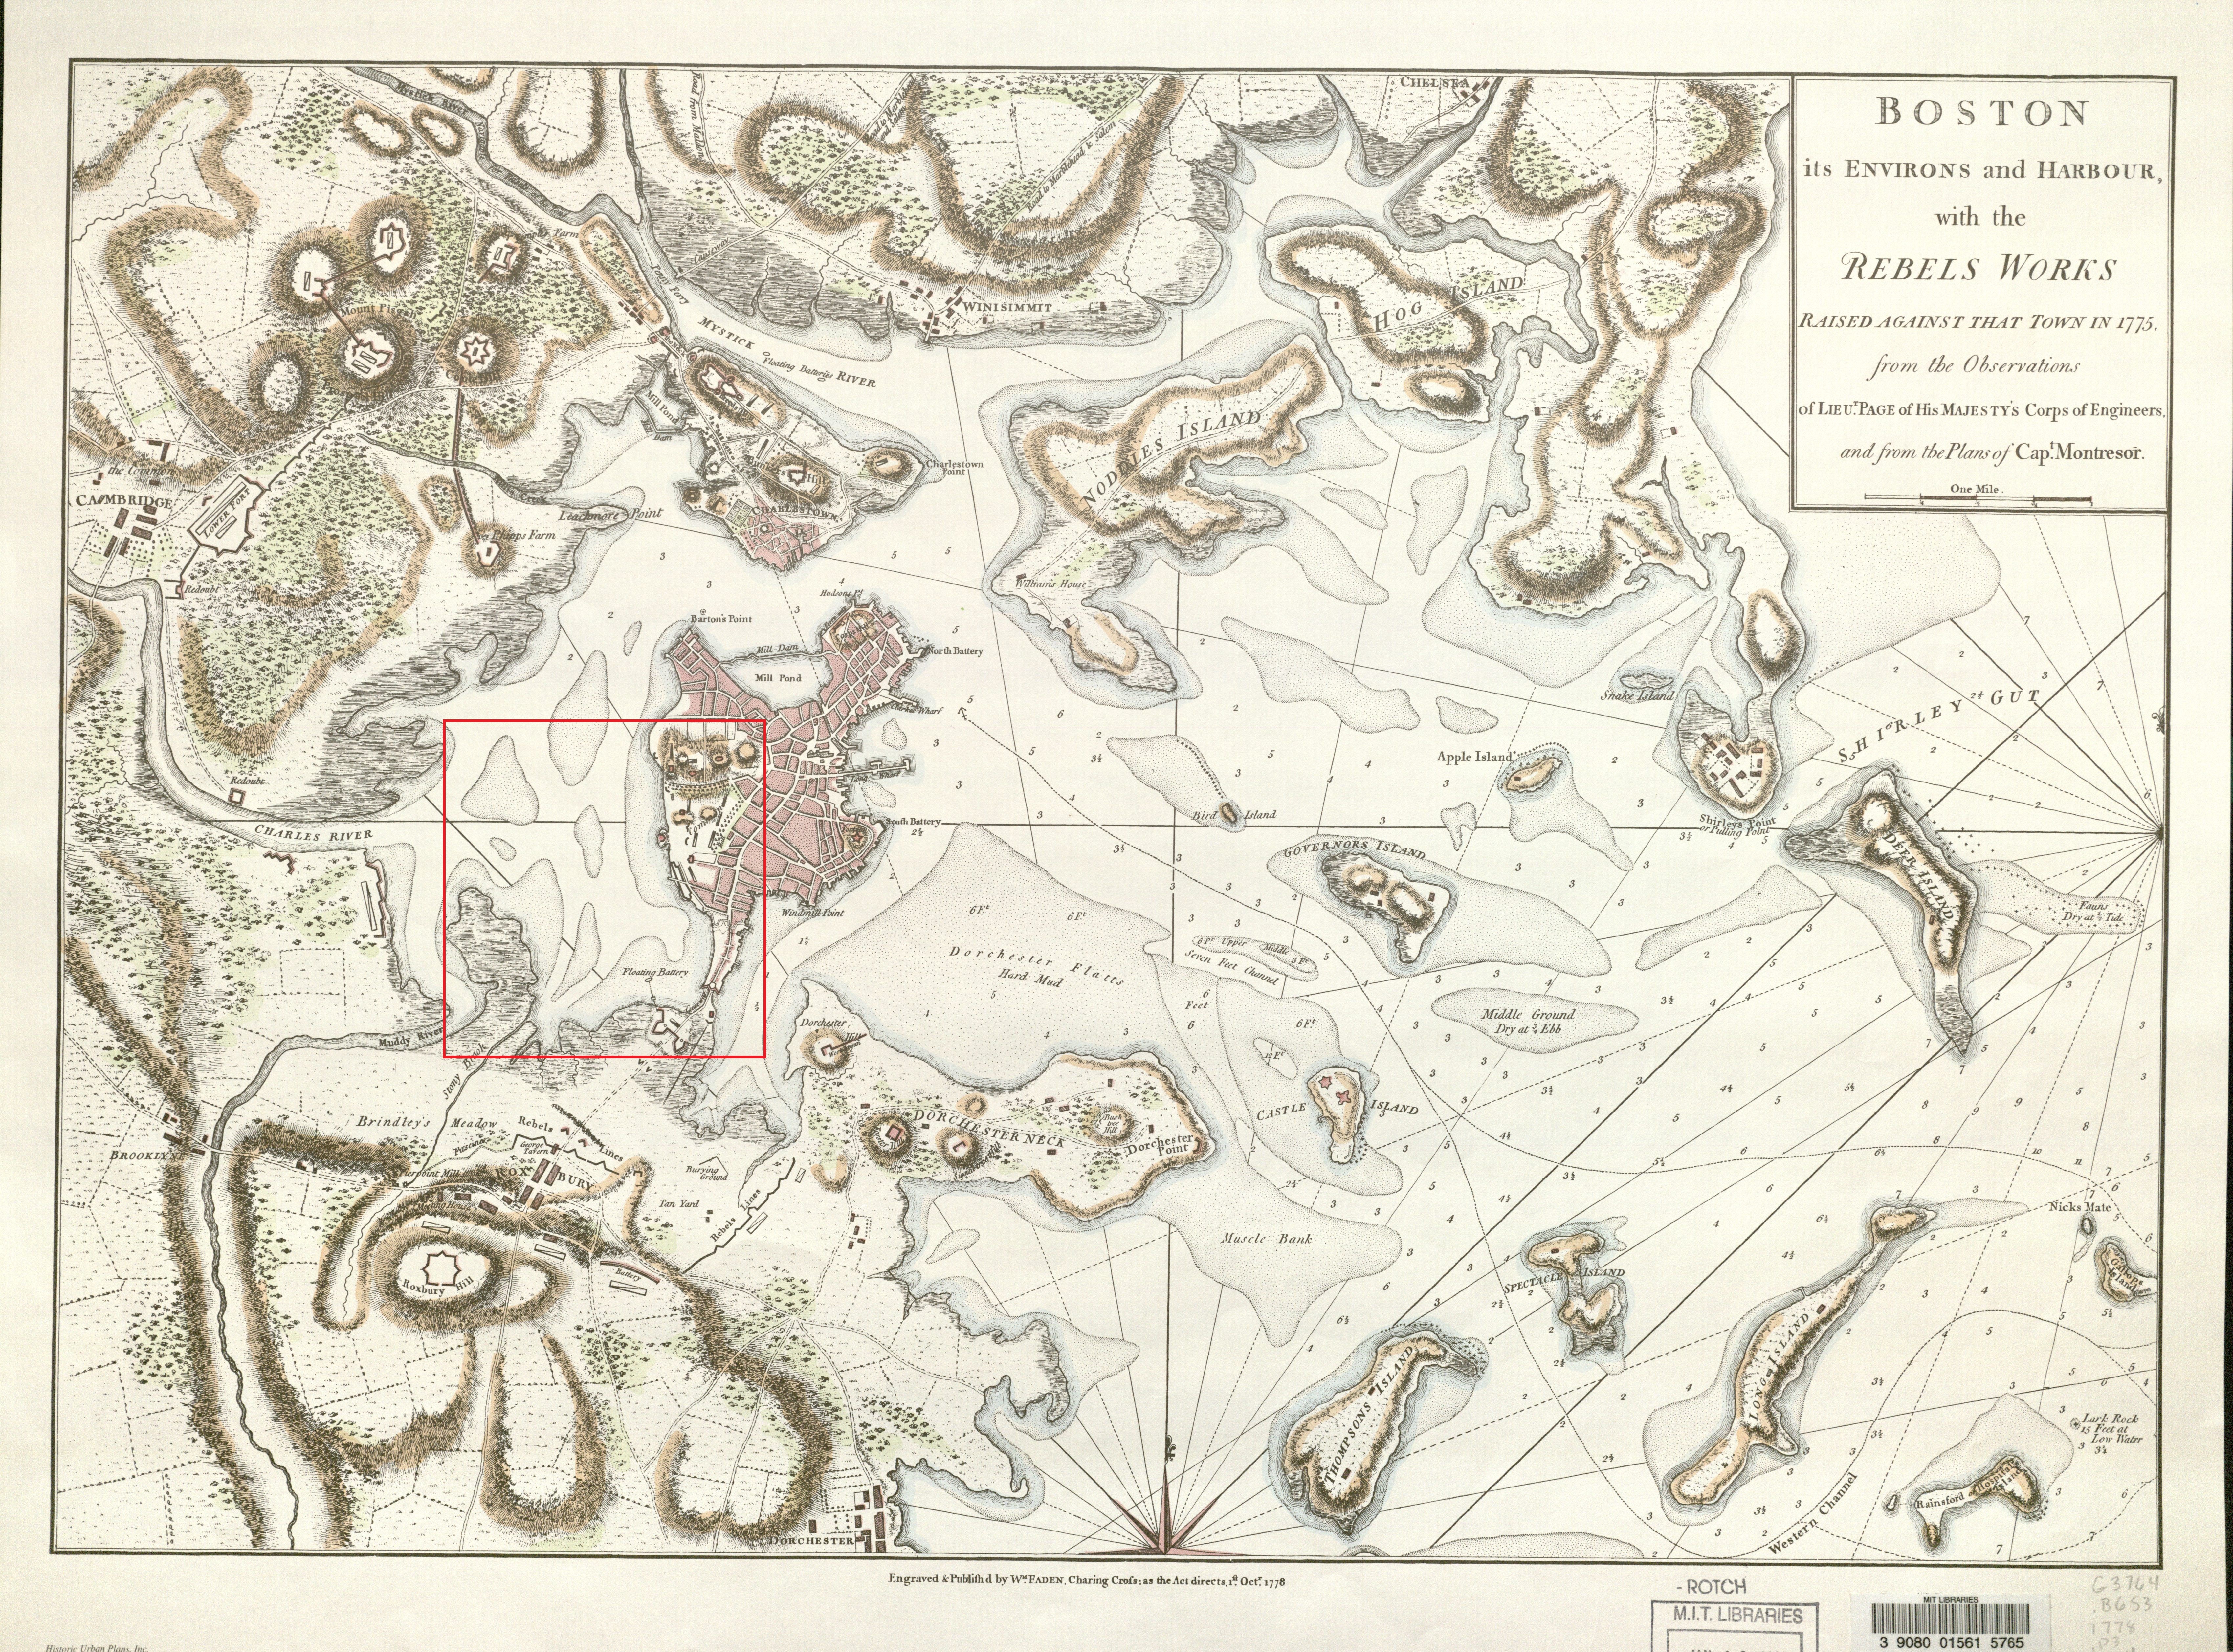 Fig 1. 1775. | "Boston its Environs and Harbour with the Rebels Works." Map. Wm. Faden. MIT Libraries, Rotch Library, 1778.
Boston spent the majority of the nineteenth century embarking on a series of ambitious land reclamation projects. Enduring Puritan convictions of government social responsibility contributed to the inauguration of Boston's park system, including the Back Bay Fens in 1878 (Warner 1999, 9). Foremost designed as part of the public health initiative, the Back Bay Fens was intended by Olmsted to be a solution to the water quality problem; sewage from Stony Brook and the Muddy River was polluting the Back Bay basin, resulting in malodorous fumes unbearable to nearby settlement (Seasholes 1999, 131). In time, the momentum from the construction of the Back Bay Fens from the 1880s through the 1890s inspired the reclamation of the surrounding marsh, ultimately yielding the Fenway area of today (Seasholes 1999, 137). However, despite the landfill being completed by 1891, Fenway remained undeveloped for a considerable portion of the early twentieth century.
The Commodification of Land
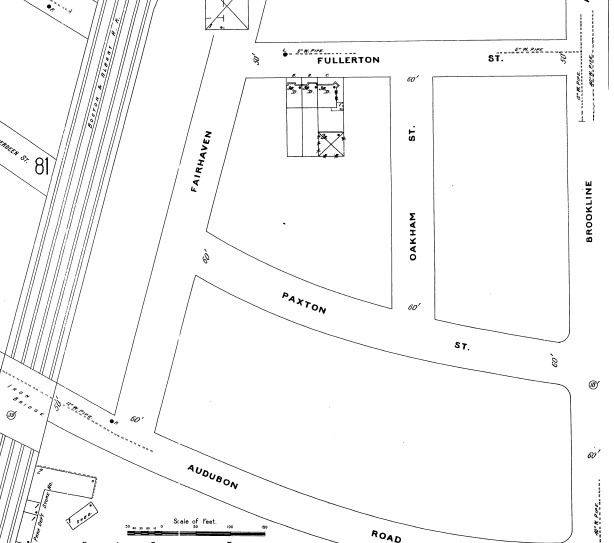 Fig 2. 1895. This map from the ninteenth century reveals the rather vacant nature of the land, and shows the existence of transportation infrastructure very early on. The railroad would be very important to Fenway's development. | Map data ©1895 Sanborn
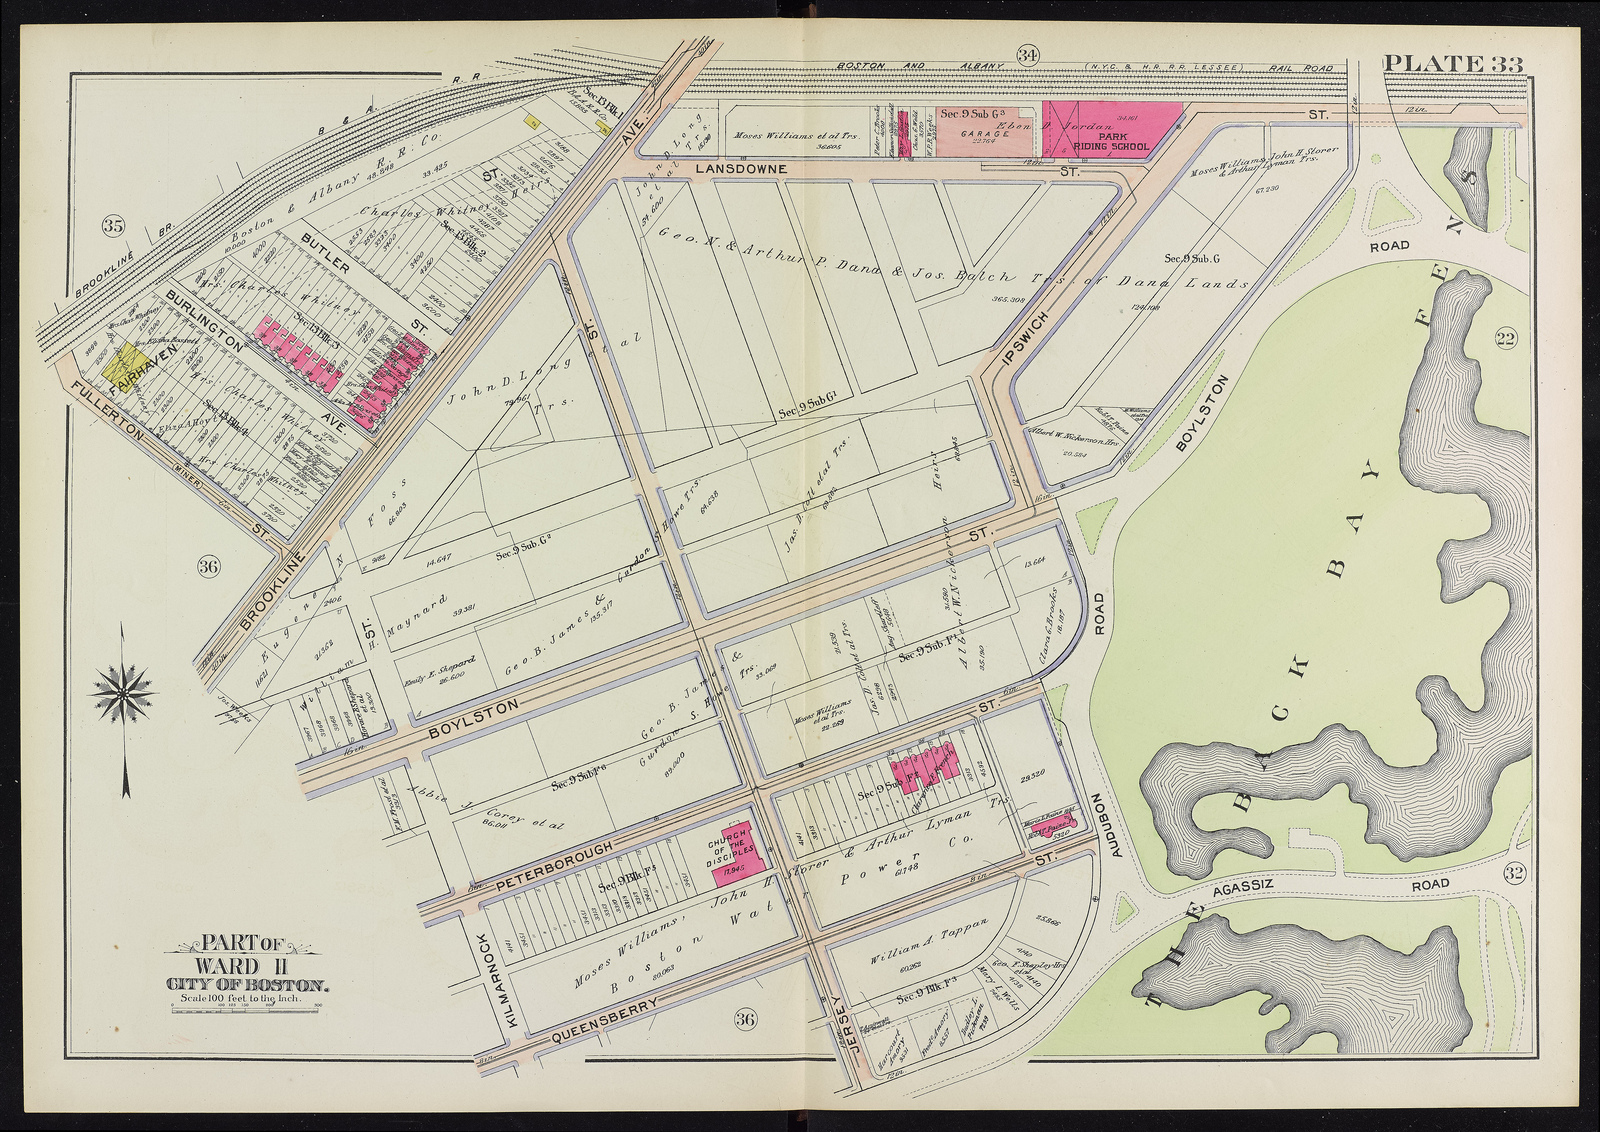 Fig 3. 1908. The vacancy of the site is characteristic of the larger Fenway area. Notice large tracts of land are under common ownership. Also, the stables and garages are all located close to the railroad. | Commonwealth of Massachusetts. Atlas of the City of Boston: Boston Proper and Back Bay. Map. Philadelphia: G.W. Bromley and Company, 1908. https://www.flickr.com/photos/mastatelibrary/sets/72157634962707694 (accessed March 24, 2014).
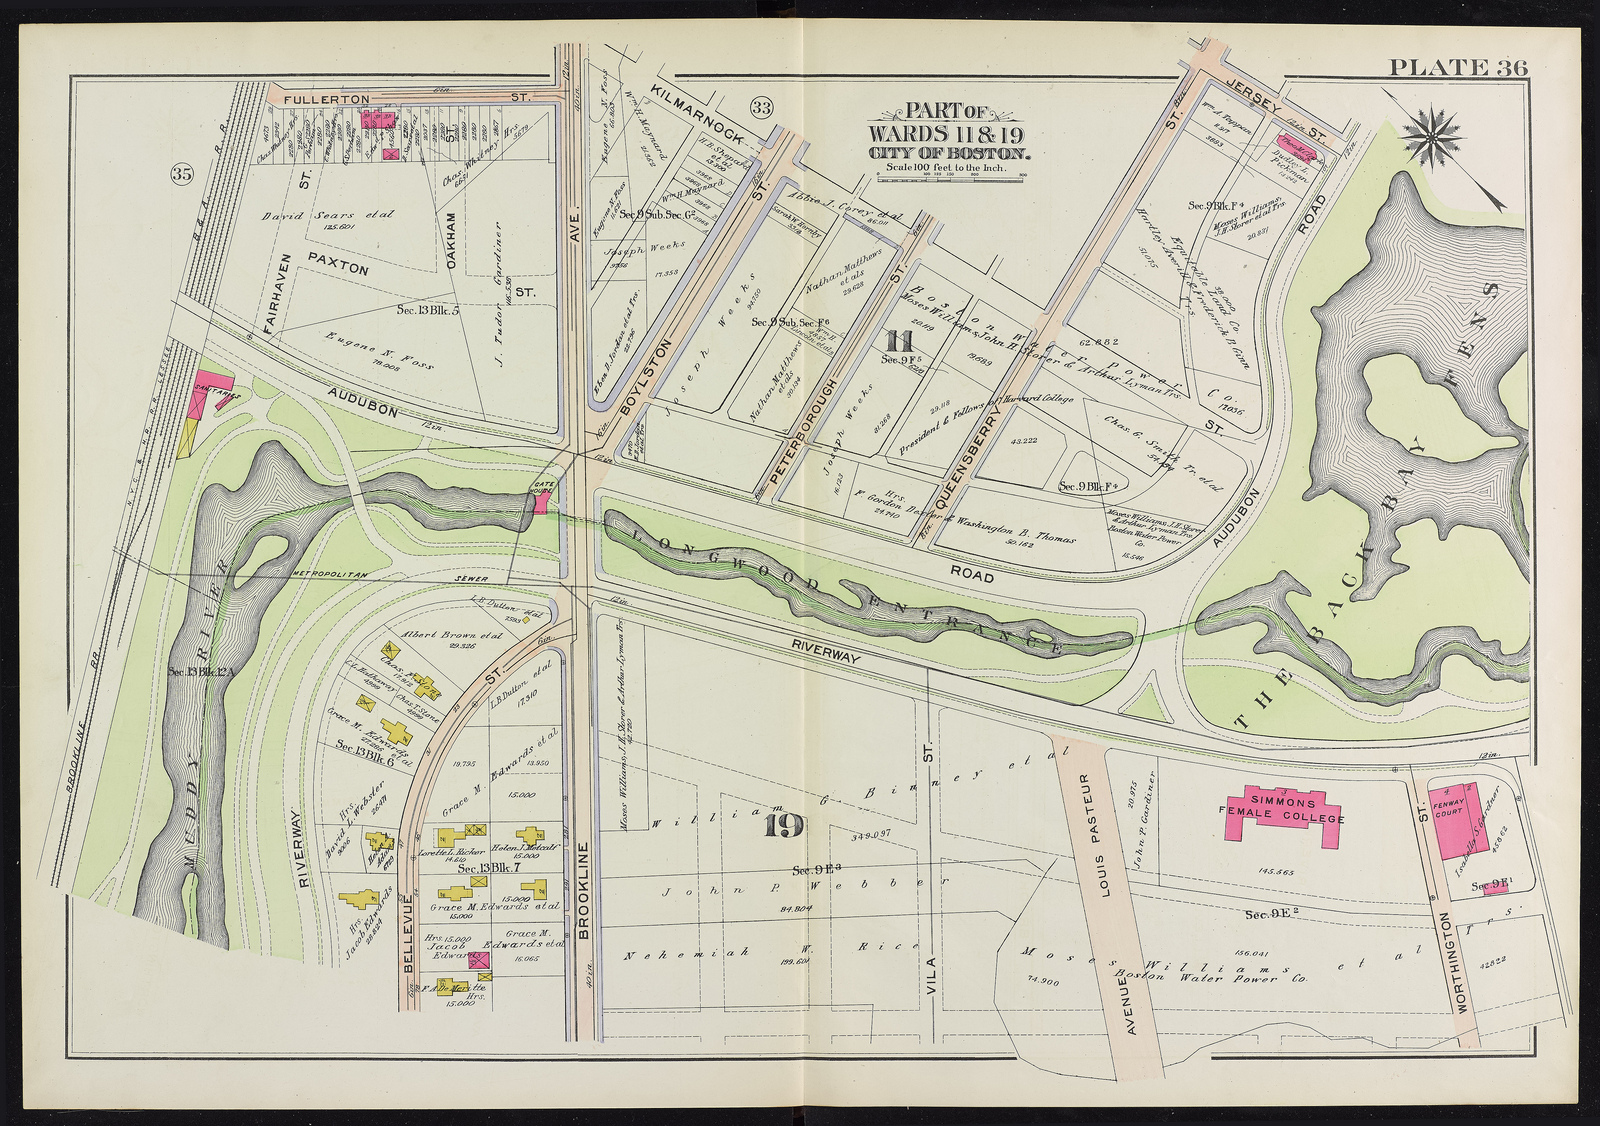 Fig 4 (right). 1908. The other portion of the site is shown on a second plate. There are only four structures on the entire site. Notice the two stables just south of the site, near the existing rail lines. | Commonwealth of Massachusetts. Atlas of the City of Boston: Boston Proper and Back Bay. Map. Philadelphia: G.W. Bromley and Company, 1908. https://www.flickr.com/photos/mastatelibrary/sets/72157634962707694 (accessed March 24, 2014).
A 1908 Bromley map reveals that the site was entirely vacant at the turn of the twentieth century, minus four tiny edifices just south of Fullerton. The only substantial structures visible on the map are just beyond site limits, and even those are sparse and fairly isolated: desolate clusters of housing units south of Peterborough Street and west of Brookline Avenue, and the occasional stable or garage at the periphery. The only institution in the area is a church, the Church of the Disciples, and even it lies outside site boundaries. (Simmons Female College is across the Riverway, and sufficiently far away from the site to discount its impact.) Considering the scarcity of residences in the vicinity, much of the church's congregation must have travelled from out of town, either by foot or horse. In short, the site's underdevelopment is representative of the larger Fenway region.
Such underdevelopment can be understood in terms of land commodification. Within the site boundaries, most parcels are under single entity ownership, typically by only one individual and occasionally a trust. A few individuals and their affiliates monopolize large tracts of land often spanning more than one block. This concentrated ownership and investor presence suggests the land was commoditized by its proprietors. These proprietors were likely to have been considerably wealthy individuals, with enough financial solvency to amass such properties. In addition to extensive land ownership, another compelling indication of the area's wealthy proprietorship is the overall vacancy of the land, highly atypical for poorer landlords, who would likely not be afforded the luxury of leaving the land fallow and instead more financially constrained to utilize it as a homestead.
In light of Fenway's affluent ownership, the railroad infrastructure can plausibly account for the peculiar market behavior, at least in part. Rail lines run through the general area, and the transport of goods through the region inevitably begets massive potential for industrial and economic growth. In a similar vein, there is reason to suspect the location of stables near the railroad is not merely coincidental. Railroad transportation and horsepower were complementary; shipments by rail began and ended their journeys by horse, so that the two were interdependent (Morris 2007, 4). In other words, the stables and carriage garages were situated adjacent to the rail lines to optimize distribution. It is very likely that the existing railroad infrastructure made land in Fenway, at least in the minds of these wealthy investors, a prime investment asset.
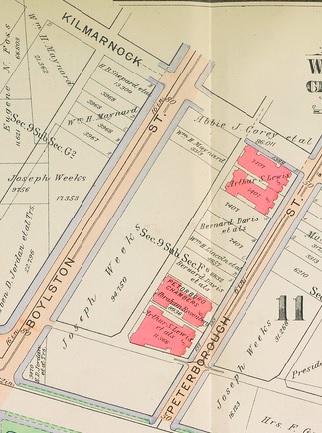 Fig 5 (right). 1912. Very little development occurs in the two decades following Fenway's marsh reclamation. In fact, these four apartment complexes along Peterborough Street are the only new buildings added to the site by 1912.| Commonwealth of Massachusetts. Atlas of the City of Boston: Boston Proper and Back Bay. Map. Philadelphia: G.W. Bromley and Company, 1912. https://www.flickr.com/photos/mastatelibrary/sets/72157635397654162 (accessed March 24, 2014). (accessed March 24, 2014).
With long-term capital gains in mind, landlords did not undertake many transactions or development projects during the first decade of the twentieth century. Accordingly, relatively little turnover in ownership occurred. In fact, by the end of 1912, Fenway witnessed the addition of only four new multifamily, residential complexes. In short, the prevailing sentiment during the early 1900s seems to have been this - that the site boasted prime investment opportunities, not humble homestead faculties. Land was to be speculated on, not built upon. This mentality would end only with the development of the Red Sox ballpark.
Fenway Park Stadium and Economic Revitalization
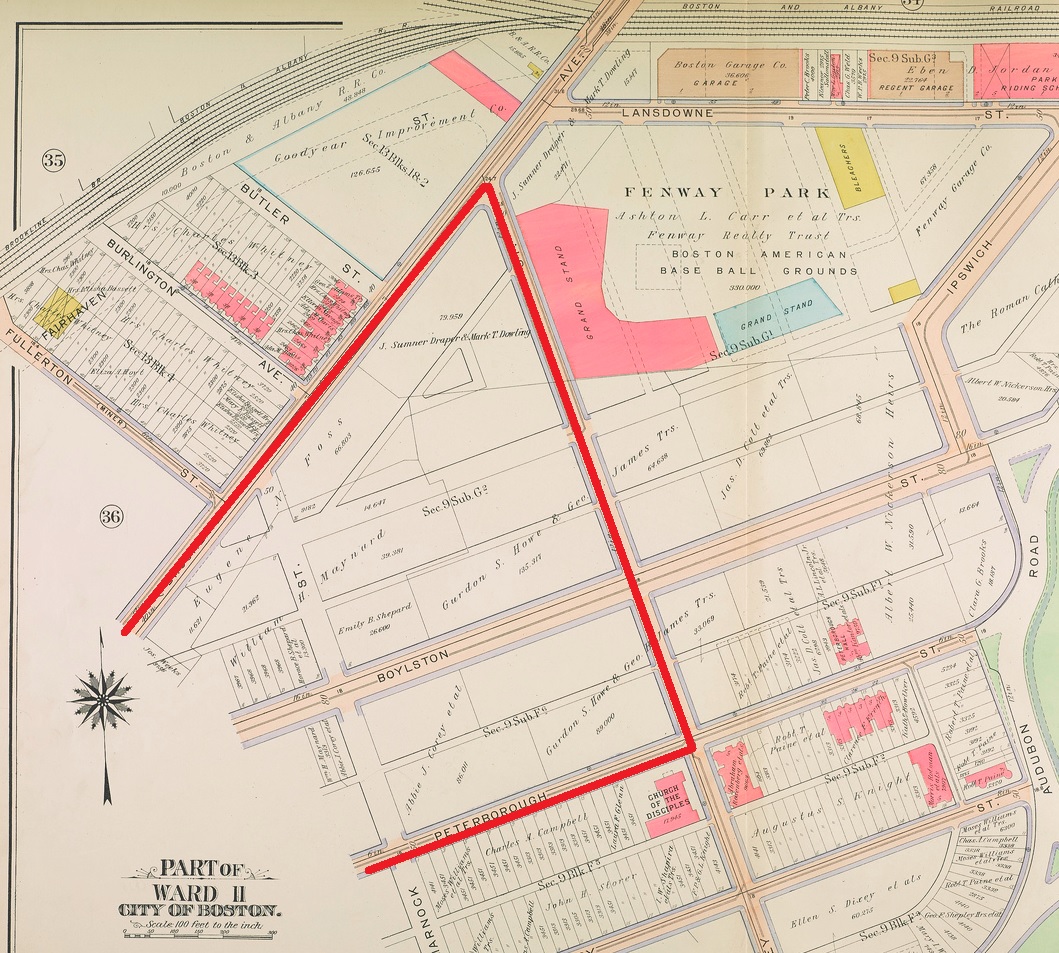 Fig 6 (left). 1912. Fenway Park Stadium, the Red Sox's ballpark, borders the site. The ballpark hosted its first game in 1912.| Commonwealth of Massachusetts. Atlas of the City of Boston: Boston Proper and Back Bay. Map. Philadelphia: G.W. Bromley and Company, 1912. https://www.flickr.com/photos/mastatelibrary/sets/72157635397654162 (accessed March 24, 2014).
In 1911, the Red Sox broke ground on their ballpark, Fenway Park Stadium; the first professional game at the venue transpired April 1912 (Major League Baseball 2014). The 1912 Bromley map depicts the ballpark in relation to the site: just outside site boundaries, northeast of Jersey Street.
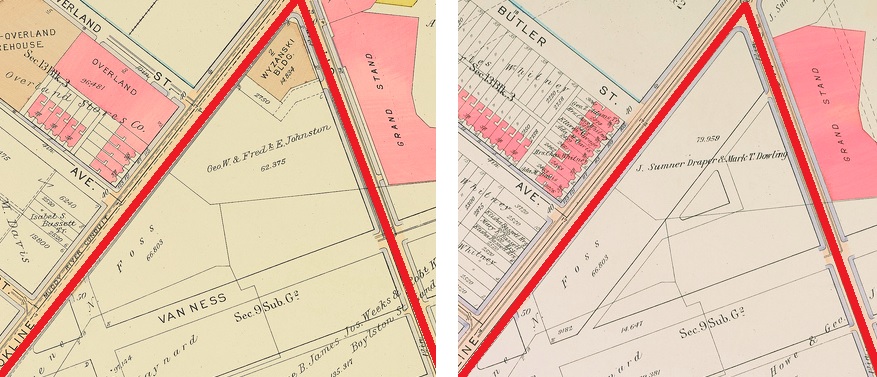
The venue's proximity automatically lends relevance to the site's development. However, maps reveal that the side-effects of the ballpark's arrival are neither immediately nor acutely felt by the neighboring area, at least in the beginning stage. Five years after the stadium's completion, the site remains relatively unchanged, save for an additional, solitary edifice: the Wyzanski Building. Located across the street from the ballpark, at the corner of Brookline and Jersey, the two-story Wyzanski Building is the first manifestation of the ballpark's influence on development within the site.
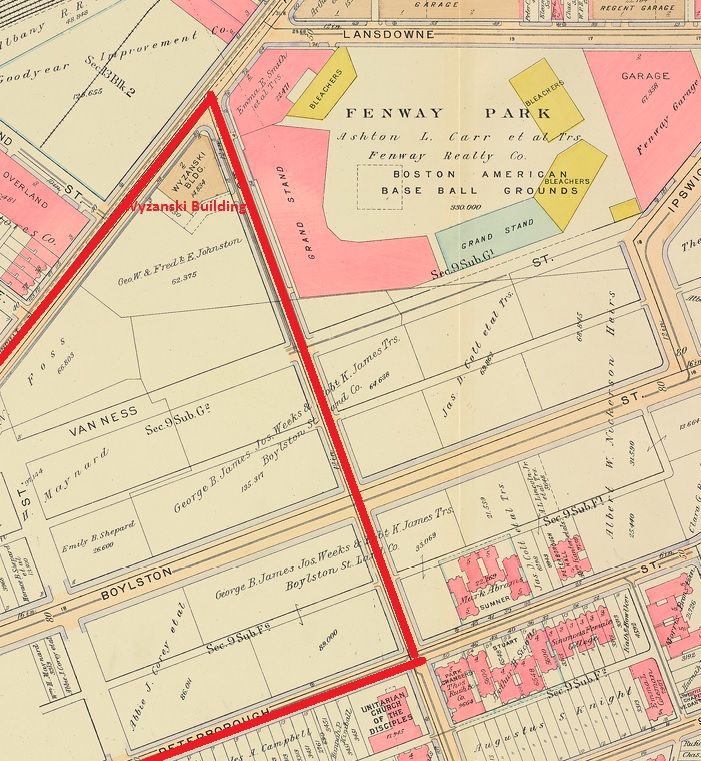 Fig 7 (left). 1917. The Wyzanski Building is the first manifestation of Fenway Park Stadium's impact on site development.| Commonwealth of Massachusetts.
 (below) 1917 traffic system depicted on the left; 1912 on the right. Atlas of the City of Boston: Boston Proper and Back Bay. Map. Philadelphia: G.W. Bromley and Company, 1917. https://www.flickr.com/photos/mastatelibrary/sets/72157634967613191 (accessed March 24, 2014).
Yet, such limited construction hardly presents a convincing case for Fenway Park Stadium's impact. At this point, the most significant change in the site and indication of future change is not the new Wyzanski Building, but rather the modified transportation network. During the same period that the Wyzanski Building is constructed, several unnamed roads between Brookline and Boylston are removed, with the adjacent parcels absorbing the land. Moreover, a previously unnamed road running past Fenway Park Stadium becomes christened Van Ness Street. The naming insinuates the newfound importance of the road; the Red Sox ballpark has restructured traffic.
Granted the impact of Fenway Park Stadium is not glaringly obvious in 1917, allusions to the future urban landscape are already present. In the next five years, the stadium's effect on site development becomes remarkably pronounced. Especially when compared with the stability of the preceding two decades, there is suddenly significant turnover of land and shift in property lines, involving both the consolidation and subdivision of lots. 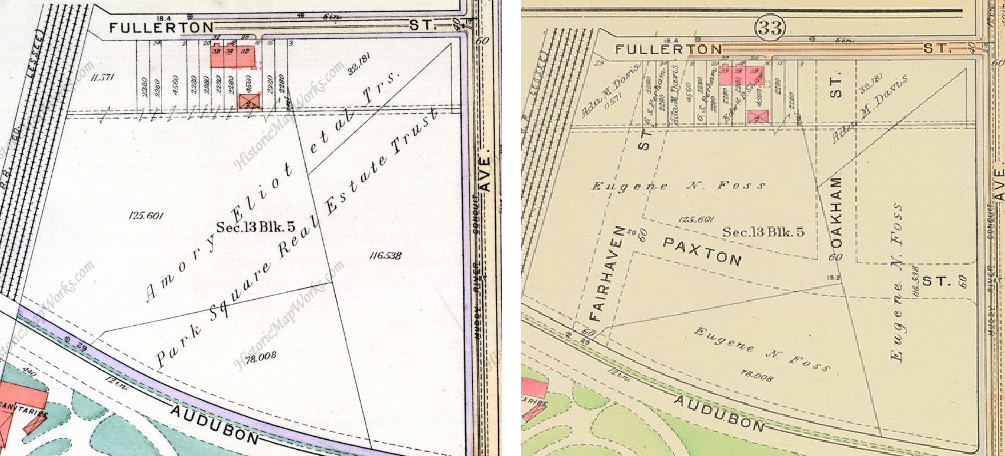 Fig 8. 1922, 1917. The consolidation of land previously owned by four different individuals. The left map depicts ownership in 1922, the right map shows it five years earlier. The land market has gained momentum from the Red Sox's arrival.| Commonwealth of Massachusetts. Atlas of the City of Boston: Boston Proper and Back Bay. Map. Philadelphia: G.W. Bromley and Company, 1917. https://www.flickr.com/photos/mastatelibrary/sets/72157634967613191 (accessed March 24, 2014).
The most substantial of these results in the razing of three streets and the unification of tracts previously owned by four different individuals, under a joint venture involving a real estate trust. Indeed, this type of change is replicated throughout the rest of the site, though on a smaller scale.
Moreover, development recommences. Isolated outcroppings of dense development arise from the land immediately adjoining the Wyzanski Building and the land in the south-most portion of the site, at the intersection of Boylston, Brookline, and Audubon. The clustering of developments may have been a natural response to the overall vacancy of the region, although it is worth noting that these initial projects all occur at prime locations in the site: either right across the street from the ballpark or at the intersection of three major thoroughfares. Just as Fenway Park Stadium creates a prime corridor of real estate out of its neighbors, the convergence of two disparate grid structures at the south boundary of the site generates high traffic volume and accomplishes the same.
Fig 8. 1922, 1917. The consolidation of land previously owned by four different individuals. The left map depicts ownership in 1922, the right map shows it five years earlier. The land market has gained momentum from the Red Sox's arrival.| Commonwealth of Massachusetts. Atlas of the City of Boston: Boston Proper and Back Bay. Map. Philadelphia: G.W. Bromley and Company, 1917. https://www.flickr.com/photos/mastatelibrary/sets/72157634967613191 (accessed March 24, 2014).
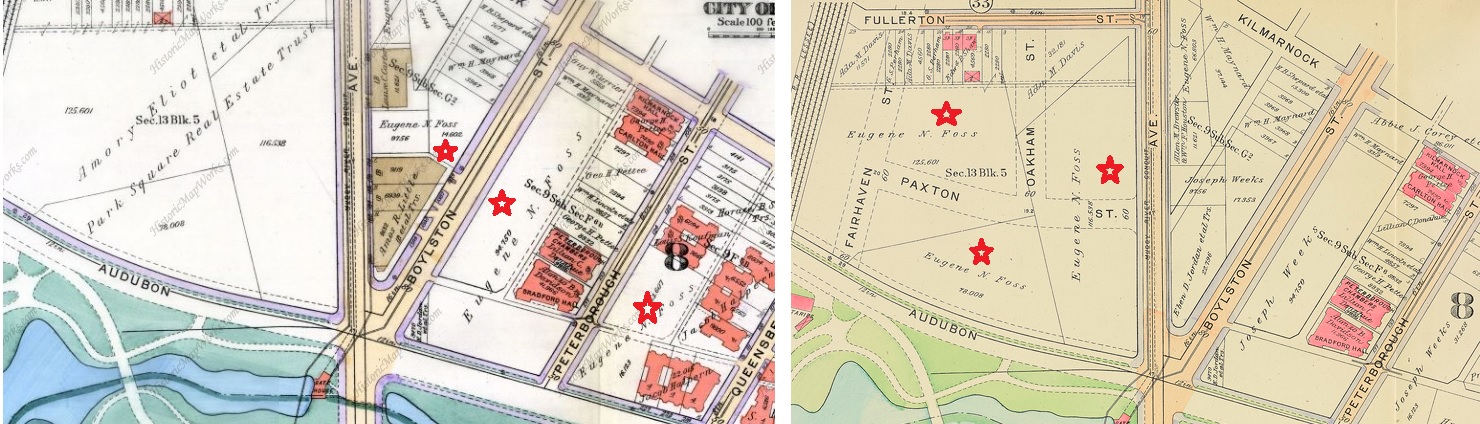 Fig 8. 1922, 1917. The left map depicts ownership in 1922, the right map shows it in 1917. The red stars appear on land transactions that Foss undertakes.| Commonwealth of Massachusetts. Atlas of the City of Boston: Boston Proper and Back Bay. Map. Philadelphia: G.W. Bromley and Company, 1917 and 1922. https://www.flickr.com/photos/mastatelibrary/sets/72157634967613191 (accessed March 24, 2014).
Perhaps not too surprisingly, these aforementioned areas of new development coincide with areas of high turnover. (Investors, after holding onto their land for over a decade, were prepared to cash in, at the offer of a developer. However, they did not completely give up their stake in Fenway either; some landlords, like Eugene Foss, used proceeds from the sale to purchase a different property in the area. After selling his stake in the land that is the present-day Landmark Center, Foss bought a block of land along Boylston and small tract along Peterborough.)
The increased transactional activity in the 1920s, a decade after the ballpark, combined with substantial, new development betray a new bullish economic vibe; the advent of the Red Sox stadium explains this dramatic change from a hitherto stagnant real estate market.
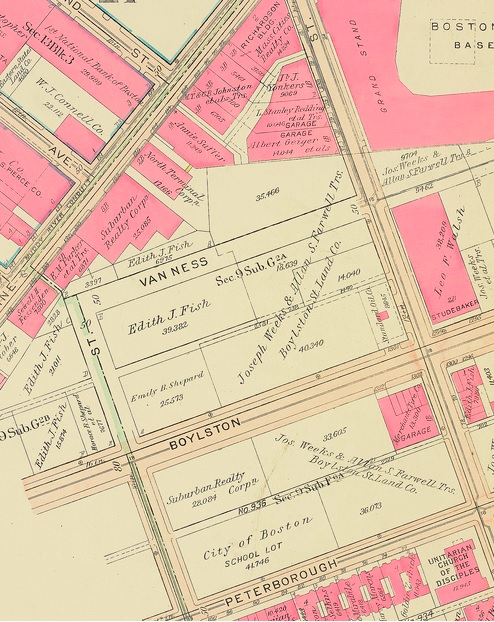 Fig 9 (left). 1928. The impact of the ballpark is conspicuous now; the frontage along Brookline becomes densely developed. | Commonwealth of Massachusetts. Atlas of the City of Boston: Boston Proper and Back Bay. Map. Philadelphia: G.W. Bromley and Company, 1928. https://www.flickr.com/photos/mastatelibrary/sets/72157634974482238 (accessed March 24, 2014).
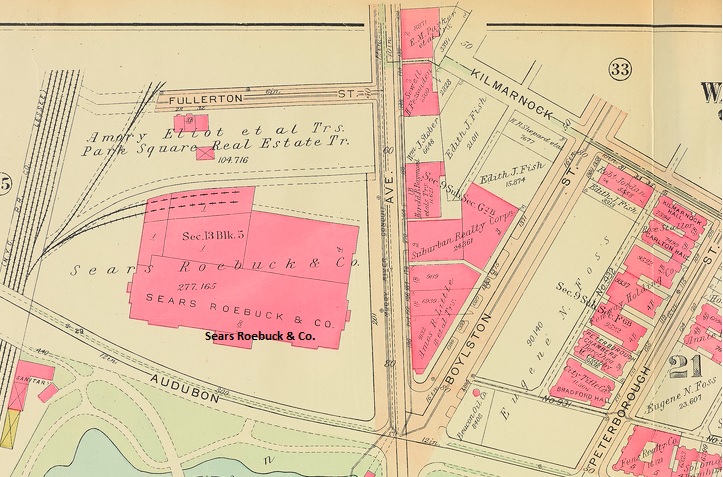 Fig 10 (right). 1928. The Sears Roebuck and Company store also arrives at the intersection of Audubon and Brookline. | Commonwealth of Massachusetts. Atlas of the City of Boston: Boston Proper and Back Bay. Map. Philadelphia: G.W. Bromley and Company, 1928. https://www.flickr.com/photos/mastatelibrary/sets/72157634974482238 (accessed March 24, 2014).
Indeed, the stadium's profound economic stimulus can be seen even more vividly by 1928, a little over a decade after the ballpark's completion, when almost half of the old ownership has been purged, and much of the frontage along Brookline Avenue and Peterborough Street becomes densely developed. Land ownership by individuals, the norm only a decade prior, has now been superseded by conglomerate land ownership. Organizations like Suburban Realty Corporation along with land trusts now control a considerable portion of the region. (This trend of conglomerate ownership continues for at least a decade, during which Fenway witnesses an influx of savings institutions and life insurance companies.) Moreover, the area welcomes its first big-box retail project; the substantial Sears & Roebuck Company Store arrives at the corner of Fullerton and Brookline.
However, aside from the substantial Sears mail-order store, Sanborn maps reveal that much of the new development is surprisingly not retail, as one might expect, but rather industrial. The overwhelming automotive service nature of the new development can be attributed to the growing popularity of motor vehicles.
The Advent of the Automobile Age
While the Red Sox's Fenway Park Stadium can explain the area's revitalization, it fails to account for the predominantly auto-oriented development of the late 1920s. In order to understand Fenway's burgeoning auto-service industry, one must first examine the transportation revolution induced by the advent of the car. Hindered by legislative opposition and highway infrastructure deficiency, automobile adoption in the United States was a bit slower than for earlier modes of transportation (Jackson 1985, 158). However, once the automobile overcame these impediments, it became an influential force in the shaping of Fenway's urban form.
By 1908, twenty-four companies were producing reasonably priced automobiles in the United States, but it was not until the debut of the Model T Ford in October 1908 that the automobile was truly democratized (Jackson 1985, 160). Assembly line production and the use of interchangeable parts reduced the price of the car to $260 by 1924, making car ownership suddenly feasible for Americans previously barred by cost (Ford Company 2014). As an "all-purpose family machine that was designed for the average driver rather than for the professional chauffeur", the Model T was largely responsible for the tenfold spike in national automobile registration from 1913 to 1923 (Jackson 1985, 162). In fact, when Model T production finally ceased in 1927, automobile ownership had become "an essential part of normal middle-class living" (Jackson 1985, 161).
Not surprisingly, the introduction and dissemination of the automobile into American life impressed upon land use. Starting from the late 1920s until the end of the century, almost all of the development in the site involves the automotive repair and maintenance services industry; the sector matures very quickly, reaching its saturation point by the early 1950s, with little change or new development in the last half of the twentieth century. Sanborn maps from this era reveal the striking density of auto repair and service shops and private garages in the area: from brake repair and filling stations, to greasing and tire services. In fact, as time goes on, beer and liquor stores in the area become converted into auto radiator repair shops.
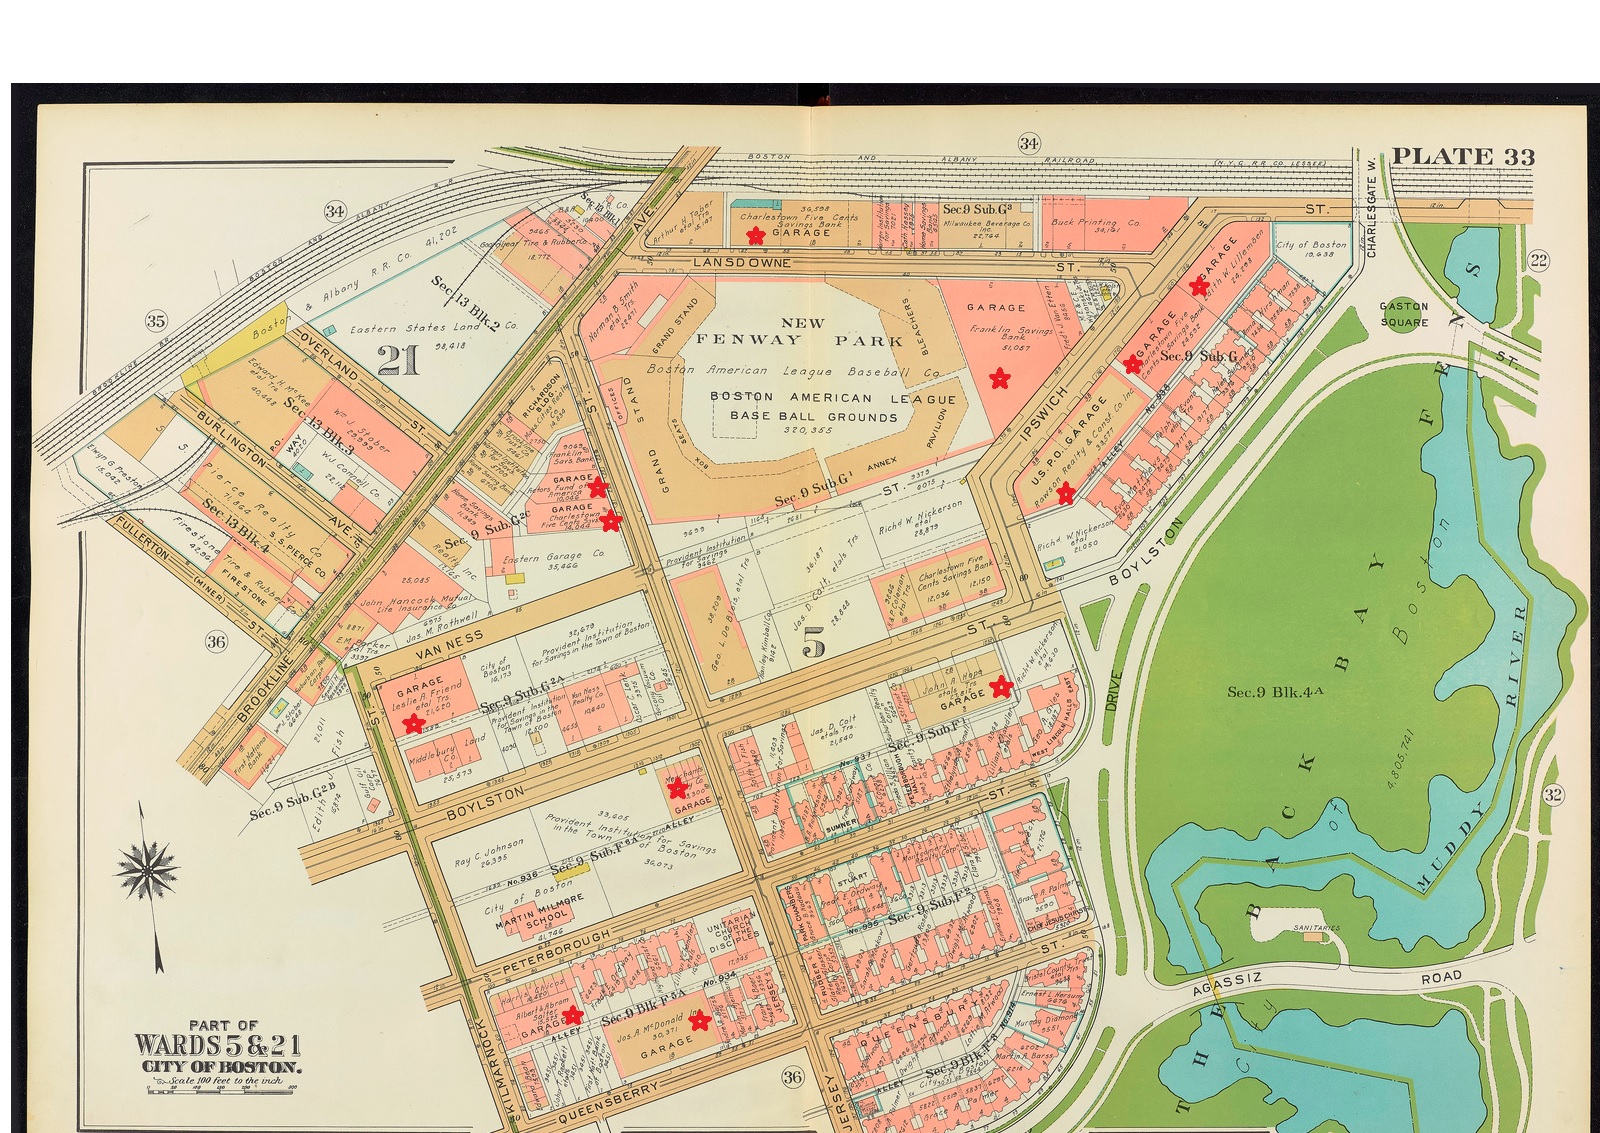 Fig 11 (right). 1938. The red stars denote garages. | Commonwealth of Massachusetts. Atlas of the City of Boston: Boston Proper and Back Bay. Map. Philadelphia: G.W. Bromley and Company, 1938. https://www.flickr.com/photos/mastatelibrary/sets/72157634969569499 (accessed March 24, 2014).
However, such a high concentration of similar services within a small area begs the question of economic sustainability: how is competition not stifling, especially with so much overlap in service? More importantly, why did Fenway transform into a hub of automotive service in the first place? The newfound popularity of the automobile, in and of itself, cannot justify such trends. Instead, answers to these questions can most reasonably be found in the site's legacy of wealthy proprietorship.
Simply put, Fenway used to be a garage for the wealthy. According to historian and Tremont Preservation consultant Leslie Donovan, the auto services and garages in the area were not for the baseball fans arriving from out of town; in fact, many of these spectators took the subway to Kenmore. Rather, these garages were for wealthy individuals living on the other side of Fenway, an area which had been developed earlier. These residents would park their cars in the garages, and if needed, chauffeurs would transport the vehicles to their doorstep. Donovan explains why no one kept their cars at home back then: "It was based on the practice of having horses and carriages in stables. They were all together in another area. It was just a custom that had developed from that (Nickisch 2012)." In fact, the present-day front office of the Red Sox used to be a car showroom. The one-sided development of Fenway makes sense from the vantage point of the cultural trends and demographics of the region, at the time.
That being said, the density of automotive related services makes it worthwhile to ponder the other land uses present on the site, including the only major instance of retail in the region, namely the Sears Roebuck and Company Mail Order Store which arrived in Fenway around 1928. The Sears and Roebuck facility served multiple purposes: the front was the retail department store, while the back section was for shipping and receiving. Its arrival modified the existing railroad infrastructure, resulting in multiple offshoots into the factory; several buildings and a stable were also demolished to make room.
Given the predominantly industrial land use, the choice of Fenway for the development of the Sears Roebuck store is particularly interesting. Westward expansion, stimulated by the Homestead Act of 1862, and the American postal system enabled the viability of the mail-order store (Sears Brands, LLC 2012). In addition, the existing railroad infrastructure may have played an important role in the Sears Company's decision to build in Fenway. Transport of raw materials and goods to from the store would have been much easier.
However, retail is not the only exception; Fenway also witnesses the arrival of an institution. While Fenway's automotive service industry is growing during the 1920s, residential neighborhoods outside the site are also rapidly expanding. For example, just south of Peterborough Street, a multitude of apartments are erected. The increasing residential character in the area beyond the site results in the establishment of a new school, Martin Milmore School, at the corner of Peterborough and Kilmarnock, during the 1930s.
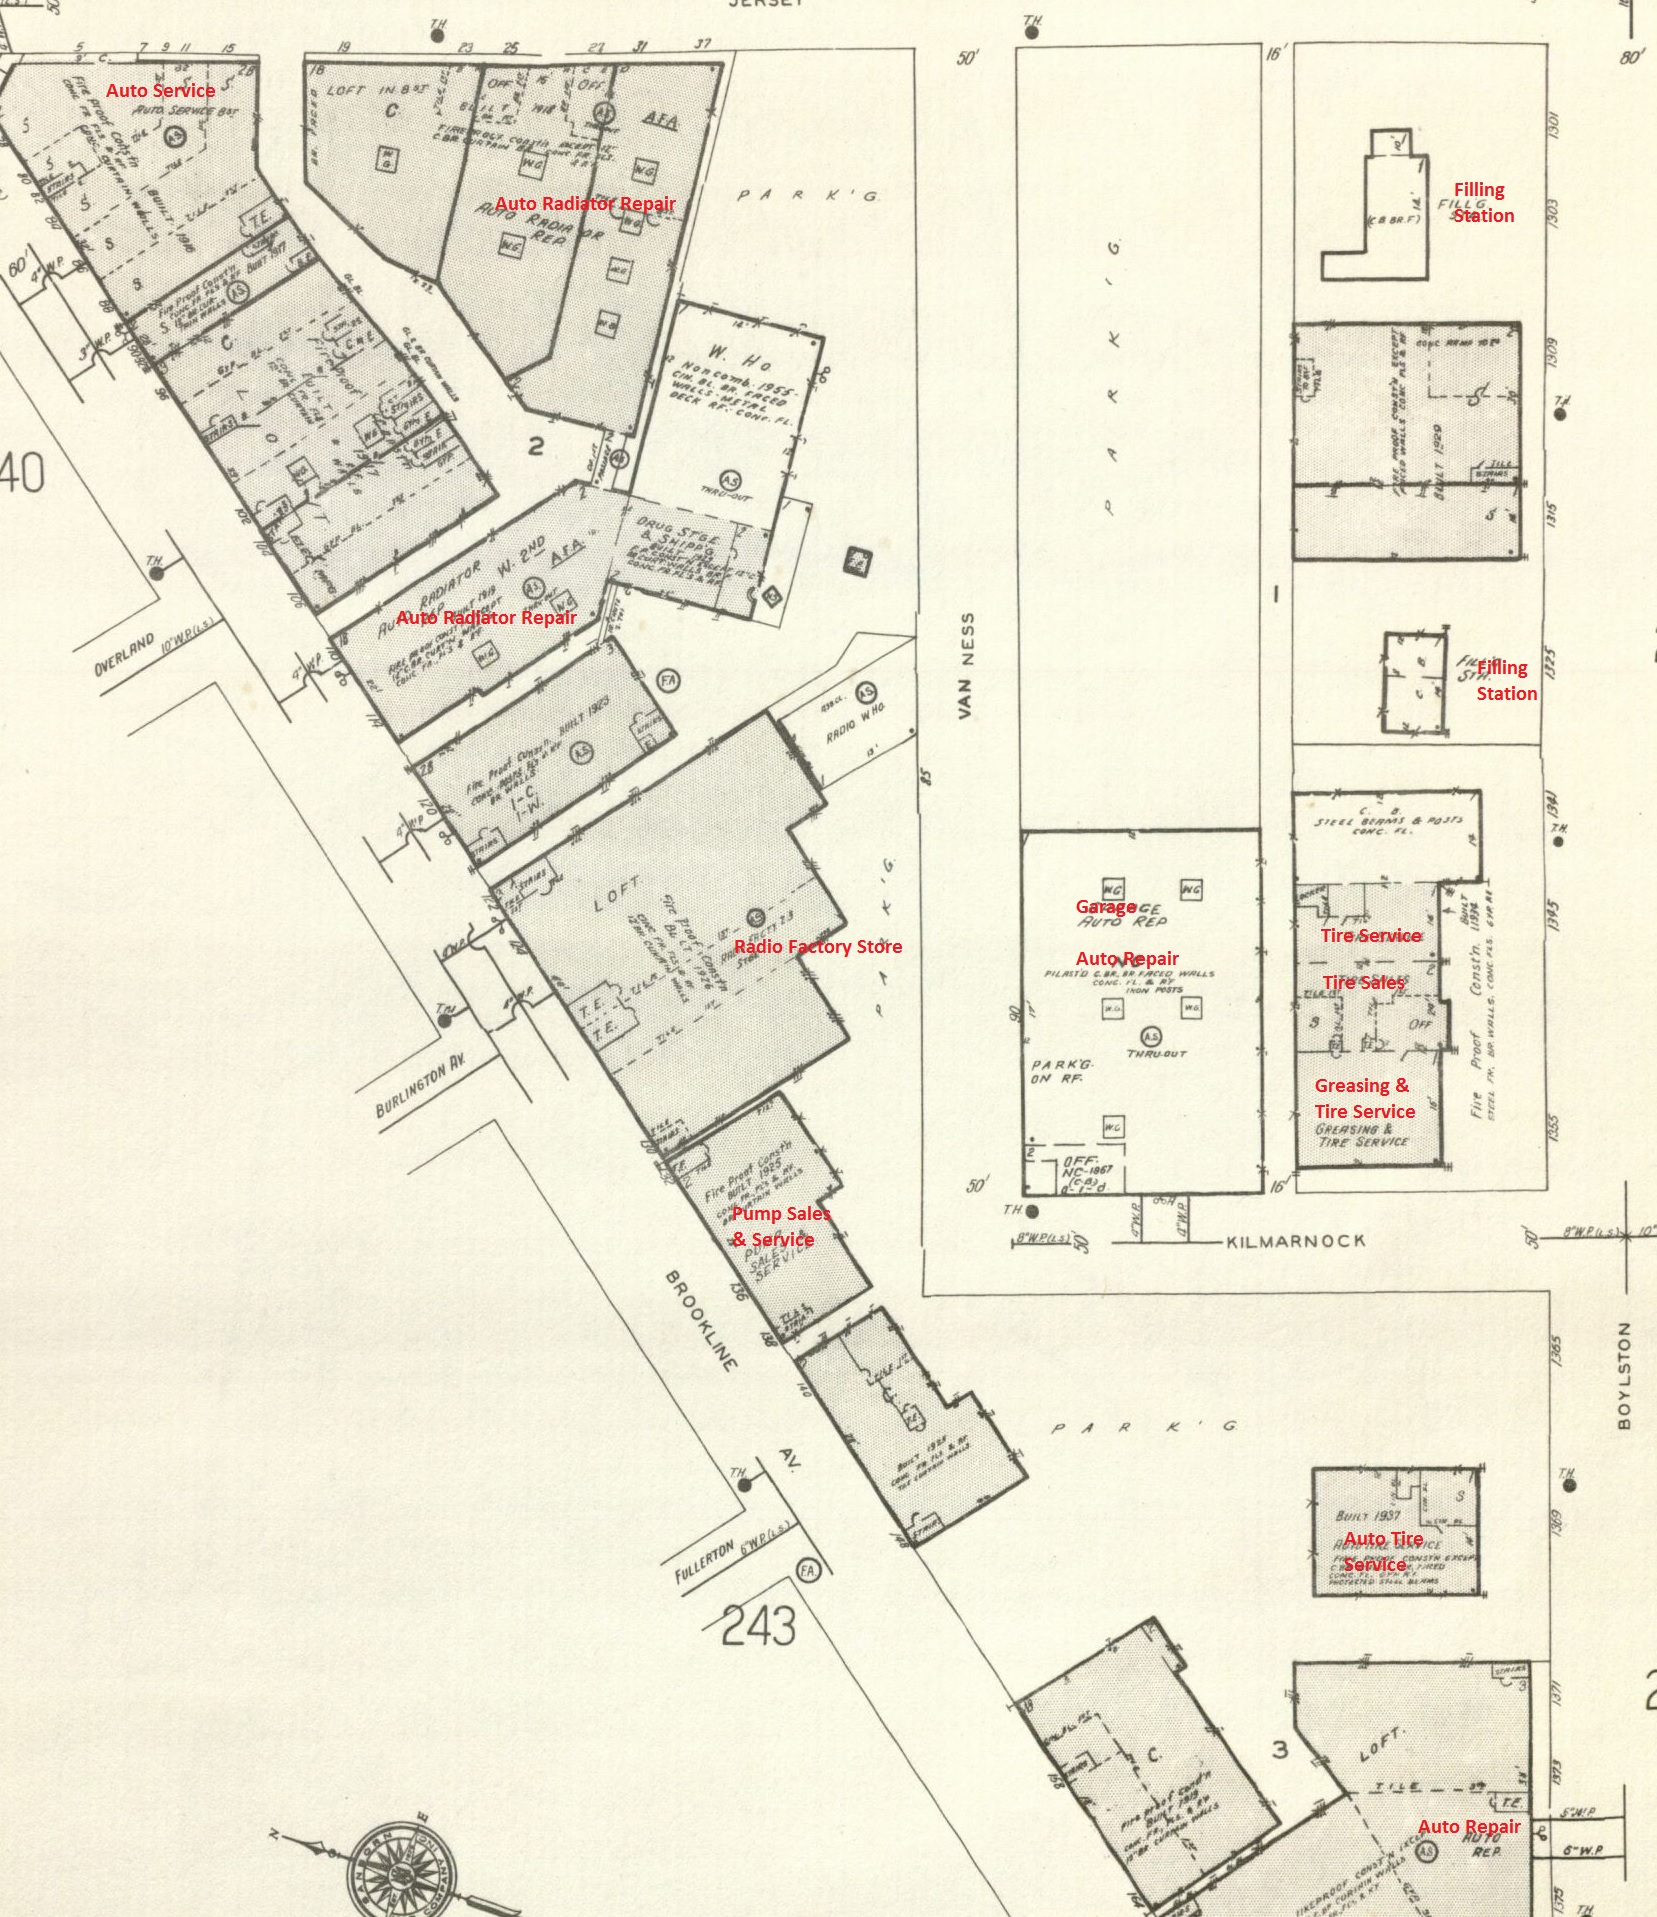 Fig 12. 1974. Notice the high density of automotive related services in the site. The occupants of the unlabelled structures on the map are unknown. | Sanborn Map Company, Incorporated. Boston, Mass.. Map. Pelham: Sanborn Map Company, Incorporated, 1974. From MIT Rotch Library, Vol 2N.
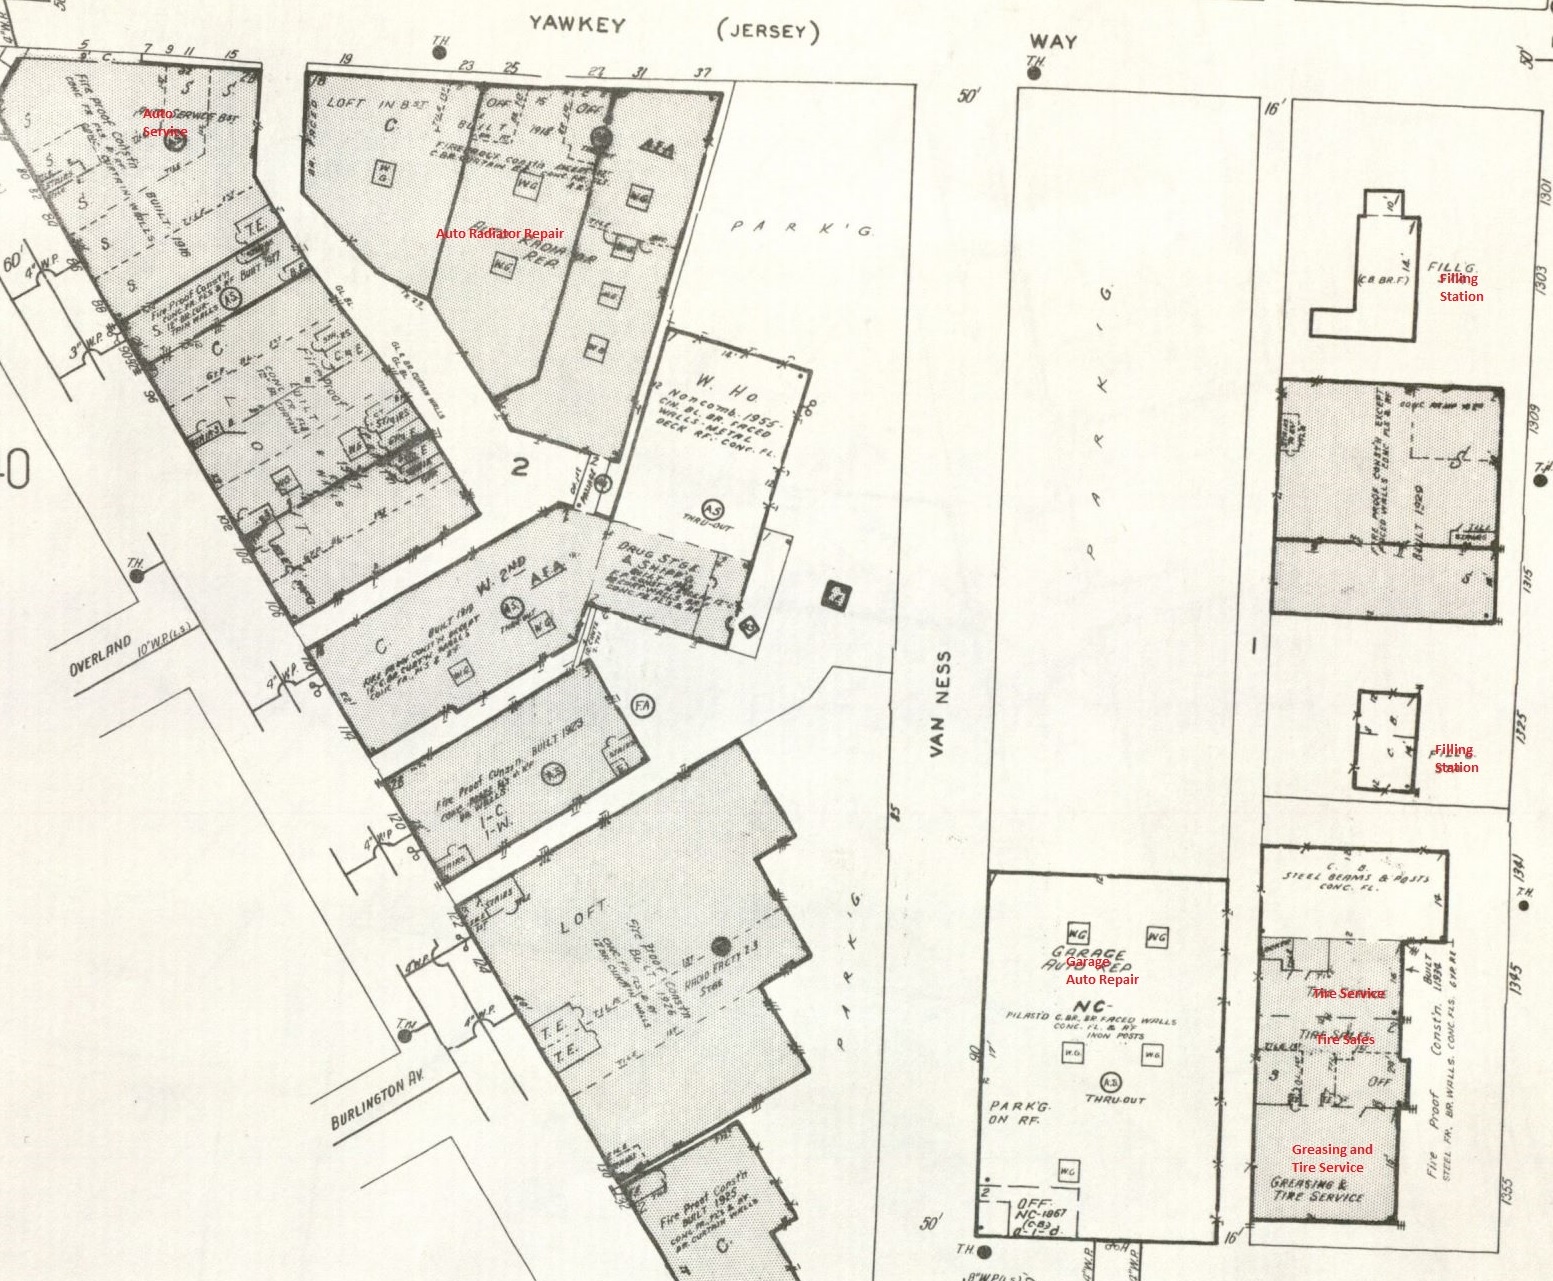 Fig 13. 1992. The automotive service industry is in still relatively intact near the end of the twentieth cenutry. Meanwhile, little new development occurs.| Sanborn Map Company, Incorporated. Boston, Mass.. Map. Pelham: Sanborn Map Company, Incorporated, 1992. From MIT Rotch Library, Vol 2N.
The automotive service industry remains very stable, with little new development, after 1940. Even in 1992, the automotive service industry is still very much intact. Unfortunately I was unable to locate any Sanborn maps past 1992. Without more maps to tract change in ownership and land use, the best we can do is to speculate some combination of social, economic, and political factors led to the shift away from the automotive service industry somewhere in the interim to the twenty-first century.
In conclusion, Fenway remained relatively stagnant during the two decades following the reclamation of its marshland. Land commodification by investors prevented any substantial development. It was ultimately the arrival of the Red Sox and Fenway Park Stadium that revitalized the market, particularly the growth and domination of the automotive service industry. This one-sided economy would persist into the late twentieth century, after which it would begin transitioning to the modern urban landscape of today. Without adequate information, the impetus for such change is unclear, although an analysis detailing the industry's decline would definitely shed more light on the issue.
The Tide of Gentrification Today
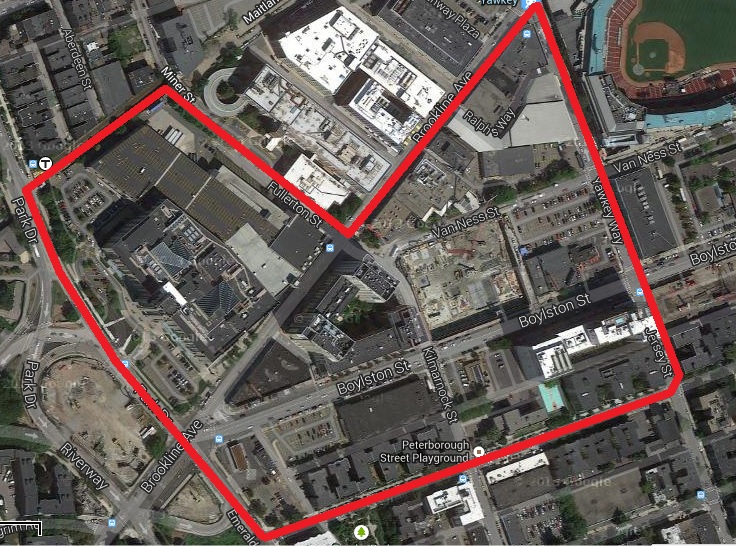 Fig 14. 2014. The aerial view of the site reveals a diversity of land uses | Map data ©2013 Google, Sanborn, Cnes/Spot Image, DigitalGlobe, MassGIS, Commonwealth of Massachusetts EOEA, USDA Farm Service Agency
A walk through the streets of Fenway today reveals an astonishingly different urban landscape - luxury skyscrapers and bustling retail characterize what used to be a solely industrial area. Gone is the sprawl of garages; Fenway's new landlords are conscientious and shrewd. In an effort to maximize land use, garages are hidden underground, beneath expensive, new towers.
Yet even gentrification has not been able to completely wipe Fenway of its past. It will be interesting to explore Fenway's transformation in the twenty-first century.
Bibliography
"Boston its Environs and Harbour with the Rebels Works." Map. MIT Libraries, Rotch Library, 1778.
Commonwealth of Massachusetts. Atlas of the City of Boston: Boston Proper and Back Bay. Map. Philadelphia: G.W. Bromley and Company, 1908. https://www.flickr.com/photos/mastatelibrary/sets/72157634962707694 (accessed March 24, 2014).
Commonwealth of Massachusetts. Atlas of the City of Boston: Boston Proper and Back Bay. Map. Philadelphia: G.W. Bromley and Company, 1912. https://www.flickr.com/photos/mastatelibrary/sets/72157635397654162 (accessed March 24, 2014).
Commonwealth of Massachusetts. Atlas of the City of Boston: Boston Proper and Back Bay. Map. Philadelphia: G.W. Bromley and Company, 1917. https://www.flickr.com/photos/mastatelibrary/sets/72157634967613191 (accessed March 24, 2014).
Commonwealth of Massachusetts. Atlas of the City of Boston: Boston Proper and Back Bay. Map. Philadelphia: G.W. Bromley and Company, 1928. https://www.flickr.com/photos/mastatelibrary/sets/72157634974482238 (accessed March 24, 2014).
Commonwealth of Massachusetts. Atlas of the City of Boston: Boston Proper and Back Bay. Map. Philadelphia: G.W. Bromley and Company, 1938. https://www.flickr.com/photos/mastatelibrary/sets/72157634969569499 (accessed March 24, 2014).
Ford Company. 2014. "Heritage: The Model T Put the World on Wheels." Accessed April 1. http://corporate.ford.com/our-company/heritage/heritage-news-detail/672-model-t.
Historic MapWorks. Atlas of the City of Boston: Boston Proper and Back Bay. Map. Philadelphia: G.W. Bromley and Company, 1922. http://www.historicmapworks.com/Map/US/7659/Plate+033/Boston+1922+Proper+and+Back+Bay/Massachusetts (accessed March 24, 2014).
Jackson, Kenneth. 1985. Crabgrass Frontier: The Suburbanization of the United States. Oxford: Oxford University Press.
"Landmark Center." Map. Google Maps, Cnes/Spot Image, DigitalGlobe, MassGIS, Commonwealth of Massachusetts EOEA, Sanborn, USDA Farm Service Agency. Imagery Aug 25, 2013. Google, 2013. Web.
Major League Baseball. 2014. "Fenway Park Information." Accessed April 2. http://boston.redsox.mlb.com/bos/ballpark/information/index.jsp?content=history.
Morris, Eric. 2007. " From Horse Power to Horsepower." Access 30 (1): 2-9. http://www.uctc.net/access/30/Access%2030%20-%2002%20-%20Horse%20Power.pdf.
Nickisch, Curt. 2012. "The Fens Before Fenway: Anything But Urban." Accessed April 1. http://www.wbur.org/2012/04/17/fens-before-fenway.
Sanborn Map Company, Incorporated. Boston, Mass.. Map. Pelham: Sanborn Map Company, Incorporated, 1974. From MIT Rotch Library, Vol 2N.
Sanborn Map Company, Incorporated. Boston, Mass.. Map. Pelham: Sanborn Map Company, Incorporated, 1981. From MIT Rotch Library, Vol 2N.
Sanborn Map Company, Incorporated. Boston, Mass.. Map. Pelham: Sanborn Map Company, Incorporated, 1988. From MIT Rotch Library, Vol 2N.
Sanborn Map Company, Incorporated. Boston, Mass.. Map. Pelham: Sanborn Map Company, Incorporated, 1992. From MIT Rotch Library, Vol 2N.
Seasholes, Nancy. 1999. "Gaining Ground: Boston's Topographical Development in Maps." In Mapping Boston, edited by Alex Krieger, 119-145. Cambridge: MIT Press.
Sears Brands, LLC. 2012. "History of the Sears Catalog." Last modified March 21. http://www.searsarchives.com/catalogs/history.htm.
Warner Jr., Sam Bass. 1999. "A Brief History of Boston." In Mapping Boston , edited by Alex Krieger, 3-14. Cambridge: MIT Press.