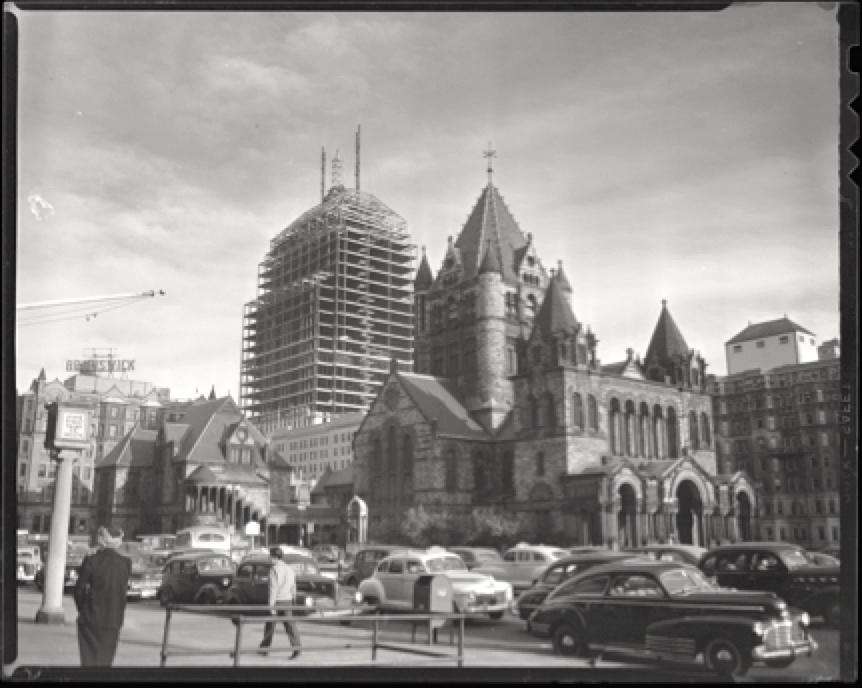
 "First Showing of John Hancock Building." Jones, Leslie. 1886-1967. Boston Public Library. Leslie Jones Collection.
Copley Square Region
INTRODUCTION
My site lies between Boylston Street and Columbus Avenue with Copley Square in its top left corner. The Site is at the merge between the Back-Bay Grid and the South-End Grid (See Figure 1 below). This merge or break causes abnormalities in the layout of the site, specifically the streets that cut through at a diagonal.
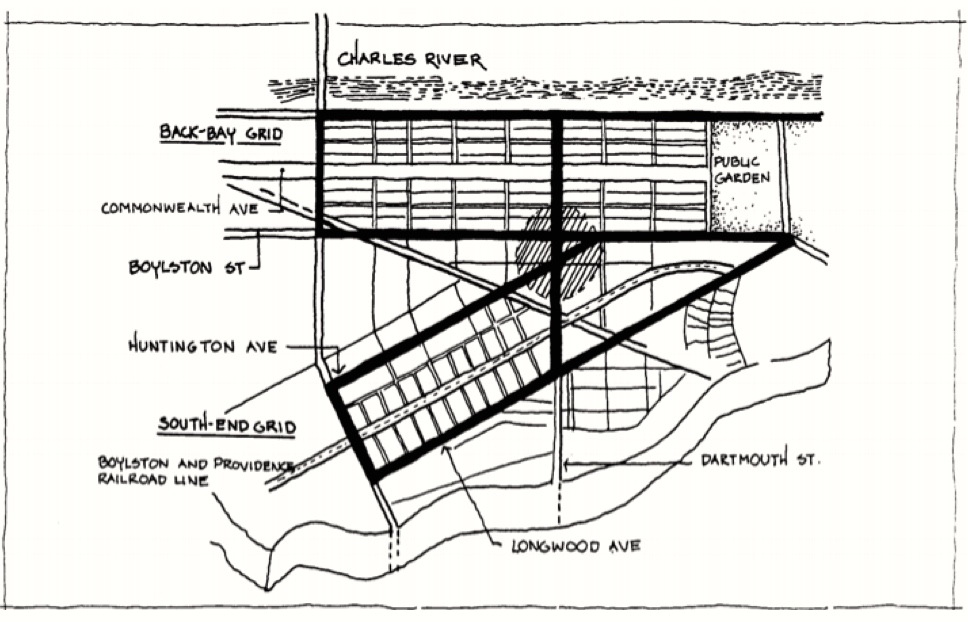 Figure 1: The meeting point of the two grid systems. Copley Square: Realizing Its Full Potential. Haque, Reaz. 1984. MIT Libraries.
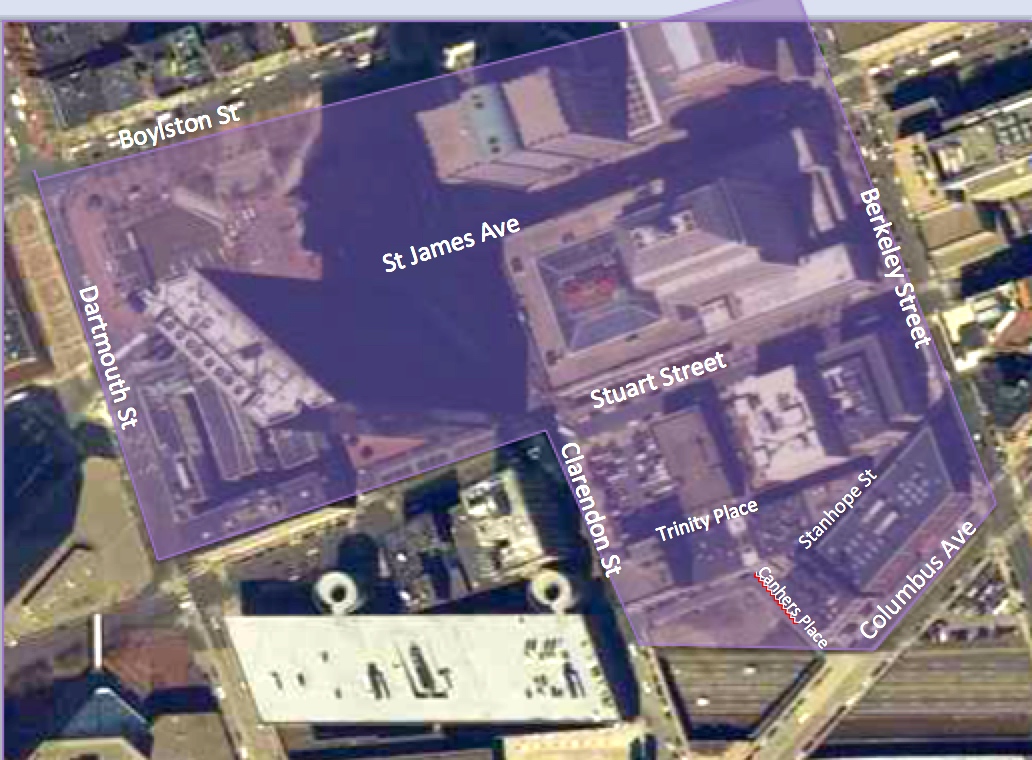 Figure 2:Boston Redevelopment Authority. 2004 map overlaid with edits to outline the site
The development of the area over time has depended on transportation, population growth, and the aim to foster academic institutions and places of spiritual worship. The site has been historically been used as a commercial and industrial zone, with institutional zones scattered throughout.
HISTORICAL BACKGROUND
The site was originally submerged under the Charles River. In old maps, you can see that none of Back Bay existed. (See below in Figure 3, Captain John Bonner’s 1722 Map of Boston). In 1814, the Boston Roxbury Mill Corporation created a mill that could serve as a highway connecting Watertown to Boston (See Figure 4, 1846 Smith). The toll road was an economic failure, which led to the 1860s filling of the dam to create what is now Back Bay. This creation of land was crucial to relieve the urban pressure of population growth in the 19th century.
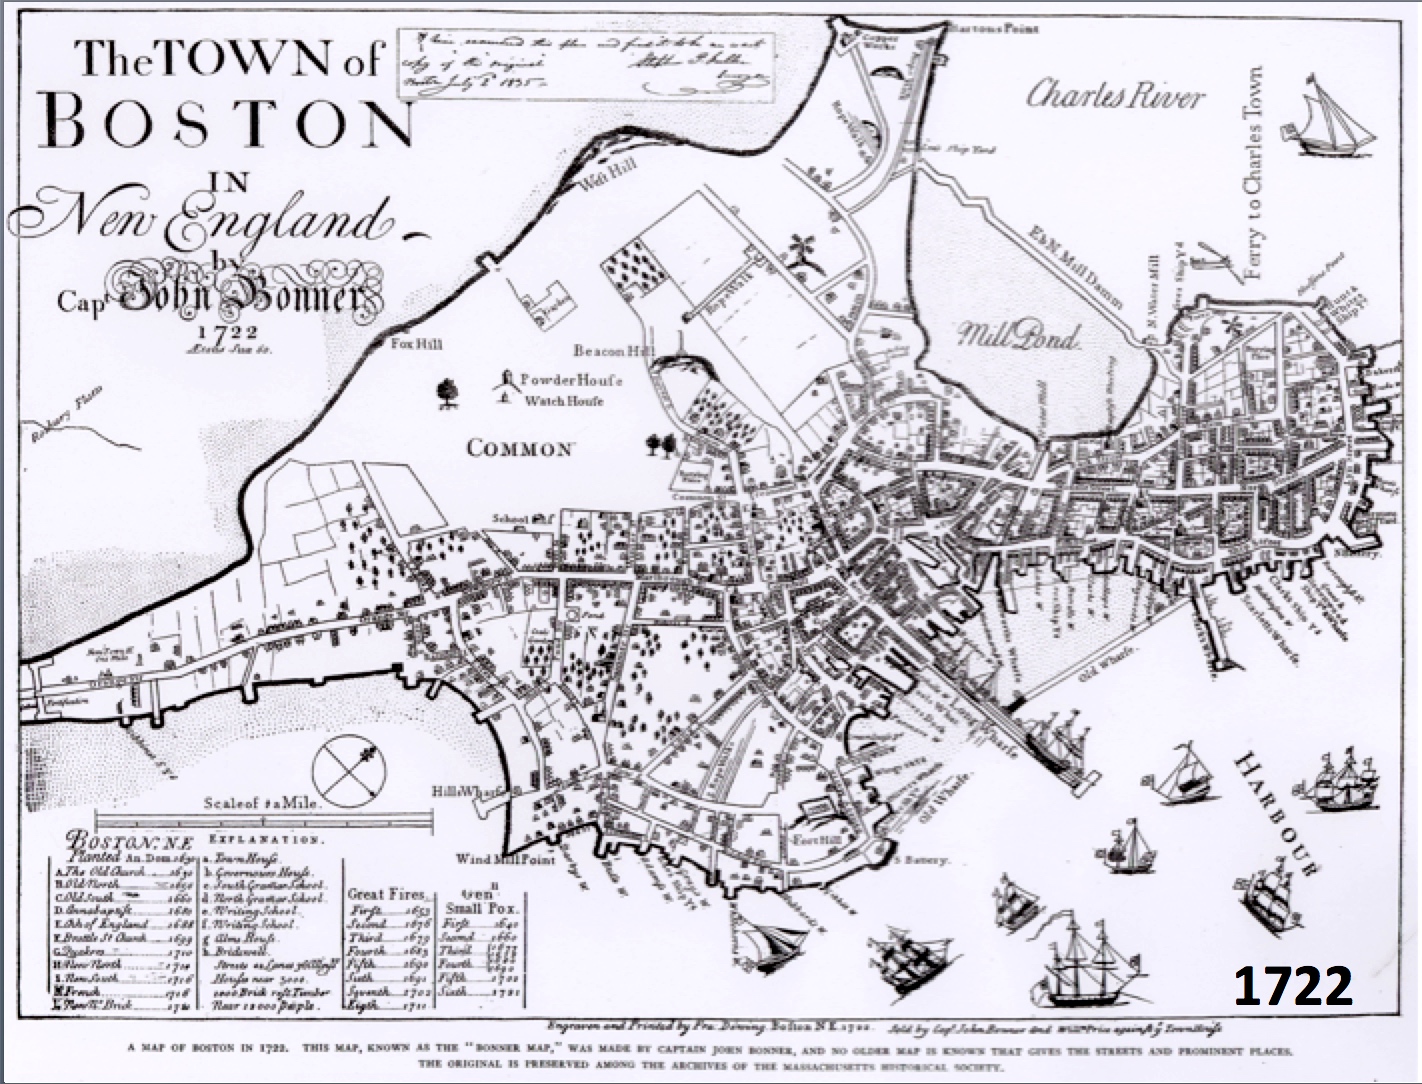 Figure 3a: Bonner, The Town of Boston in New England, 1722. MIT Libraries
Figure 3: Bonner, The Town of Boston in New England, 1722. MIT Libraries
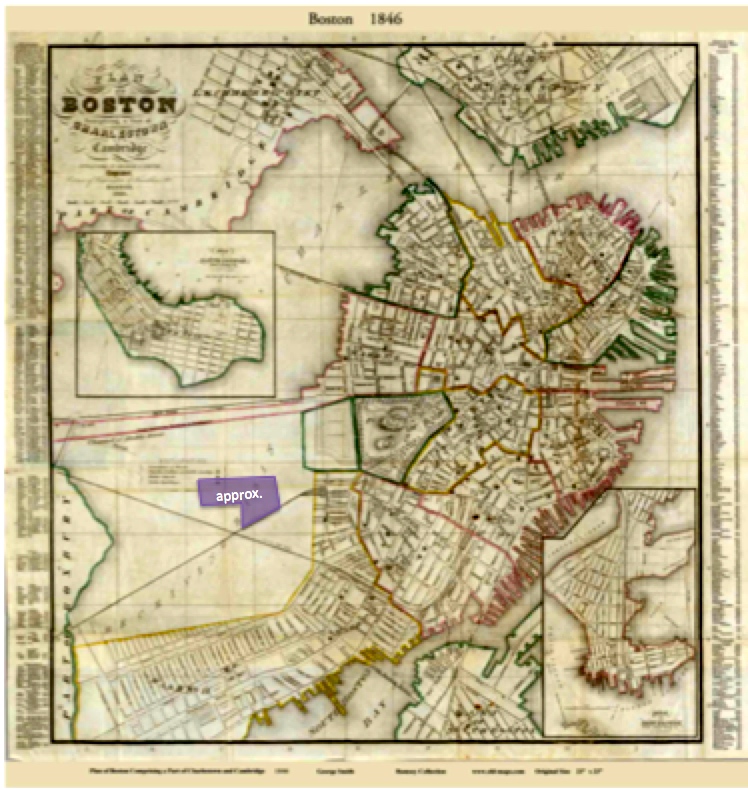 Figure 4:: Smith, Map of Boston.1846. Rumsey Collection. Note in the bottom left corner, the mill that that creates the Dam, which will later be filled to become Back Bay.
The Back Bay neighborhood developed into an upscale residential area. However, one of the first land grants was given to MIT to develop a polytechnic school in Boston. The plan for the school began in 1846 but it did not get its charter until 1861. Two days following receiving its charter the Civil War began. Thus, the school’s growth was delayed. In 1863, the first MIT building and building in Back Bay, Rogers Building, began construction and was opened three years later (to be fully completed in 1870). (See image of Roger’s building below in Figure 5). The Rogers Building, along with the two other institutional buildings that were developed soon there after, is located just beyond the upper right corner of my site, above the intersection of Berkeley and Boylston.
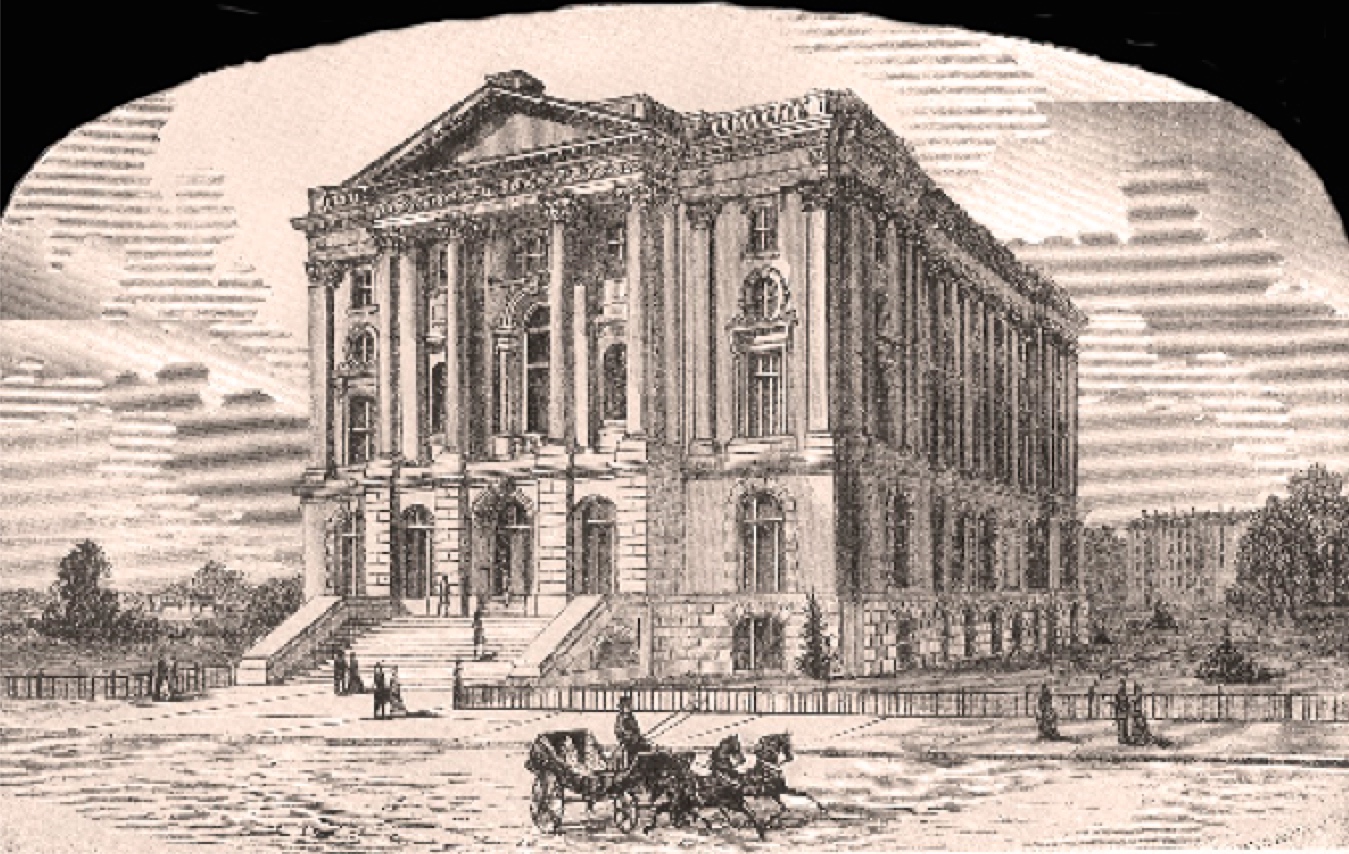 Figure 5:Completion of MIT Roger’s Building. MIT Museum’s Timeline. 1866.
The reason that institutions were attracted to this area was because with Boston’s expansion into Back Bay, the city was becoming a metropolis rather than a provincial town. As the contemporary, inspirational cities of Paris and London, Boston wanted to develop its public arts and sciences. Thus, the Natural History Museum and Museum of Fine Arts also moved into the Copley Square Area. These institutions were very successful in the area. However, due to their success and need to expand and rising land prices they were forced to move to other locations.
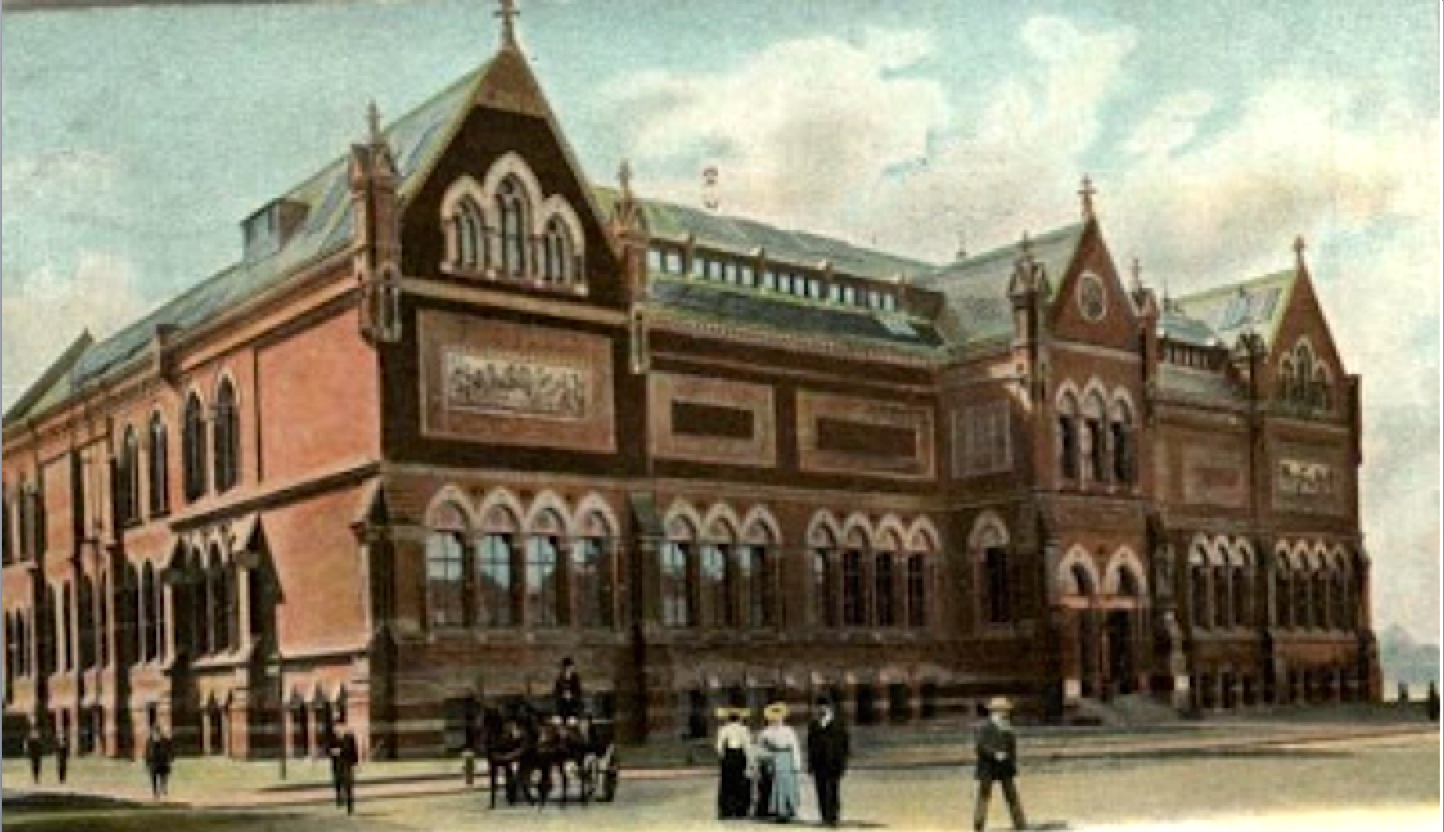 Figure 6:1876 Image of Museum of Fine Arts in Copley Square. The MFA moved to Copley Square in 1876 after its inception in 1870. It expanded twice before moving to its current location. This building was torn down and built into the Copley Plaza Hotel.
INVESTIGATING HISTORICAL IMAGES
The first map to explore is the 1878 Plan of Boston. See below, Figure 7a&b. Although it does not include all the land uses or owners, it accurately displays the merging of the grids and layout of the land. The most notable observation from this map is the significance of the two intersecting railroads in the bottom left hand corner of the map. These are the Boston and Providence Railroad Co. and the Boston & Albany Railroad Co. The availability of commuter rail made the trend of moving from the crowded city center to the outskirt suburbs possible. The rail line made Boston easily accessible to commuters from the suburbs and neighboring cities. Jackson in Crabgrass Frontier explains between 1815 and 1875 large American cities underwent spatial change due to population growth and the “rapid population growth on the periphery. ” Specifically in Back Bay a record number of houses were built in 1870. A huge rush of private residences with superb craftsmanship and stylization were built.
The rail tracks have spatial implications on the development of my site in particular. The tracks lay diagonally cutting through the already juxtaposed Back Bay and South End grids. The rail creates many triangular plots on my site due to its orientation. The streets extending from Back Bay, namely Boylston St, Dartmouth St, Clarendon St and Berkeley St, all have the same present day orientation. However, due to the railroad Clarendon Street is truncated (see below in Figure 7b). The street continues after passing the second set of tracks below Columbus Ave (below my site). In addition to the spatial implications and the convenience for commuters, the trains have negative externalities that should be taken into consideration when evaluating the quality of life in this area. These disturbances include traffic, noise and pollution in the site due to multiple rail lines crossing.
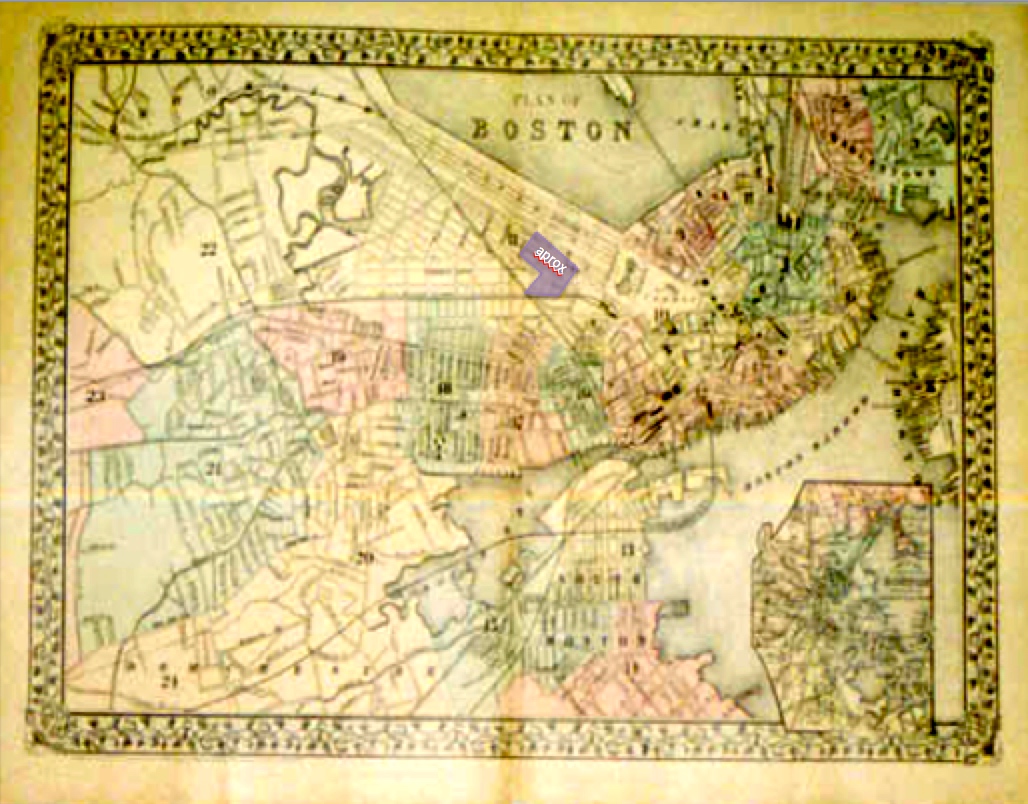 Figure 7a:1878 Plan of Boston (Full image). (368-23 from MIT Rotch Library).
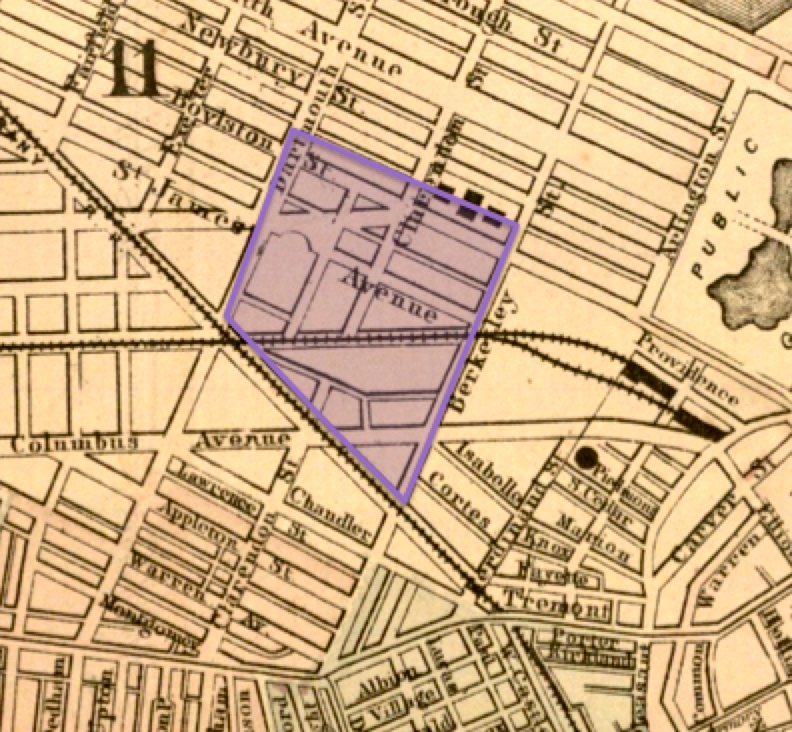 Figure 7b:1878 Plan of Boston (Zoomed image edited with site overlay). (368-23 from MIT Rotch Library).
The next maps to highlight are from five years later, in 1883. The images below (figures 8 a,b and c) are from the Atlas of the City of Boston made by the Bromley Company. Unlike the previous map, these include landowners and information about the building material type, because the Bromley Company was a fire insurance company and this information, in addition to the location of local fire hydrants, concerned them thus was included on their maps.
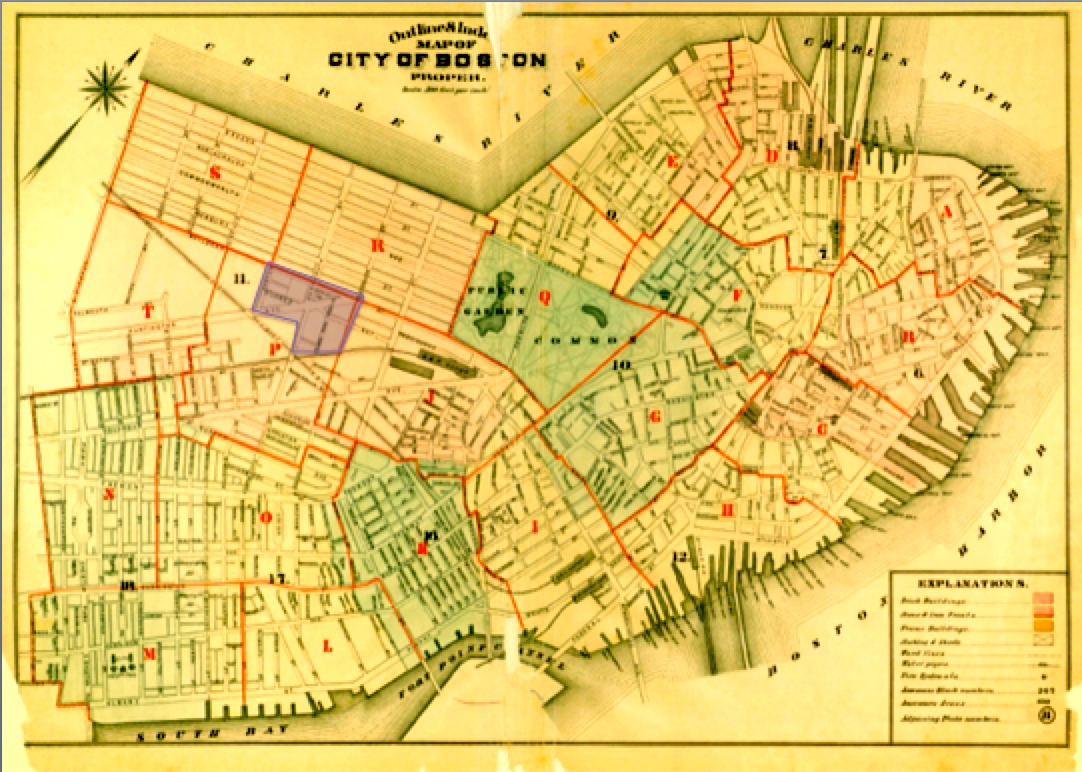 Figure 8a: Atlas of the City of Boston, from Actual Surveys and Official Records; City Proper, Volume 1 (1883); Civil Engineers: G.W. Bromley and Co. .
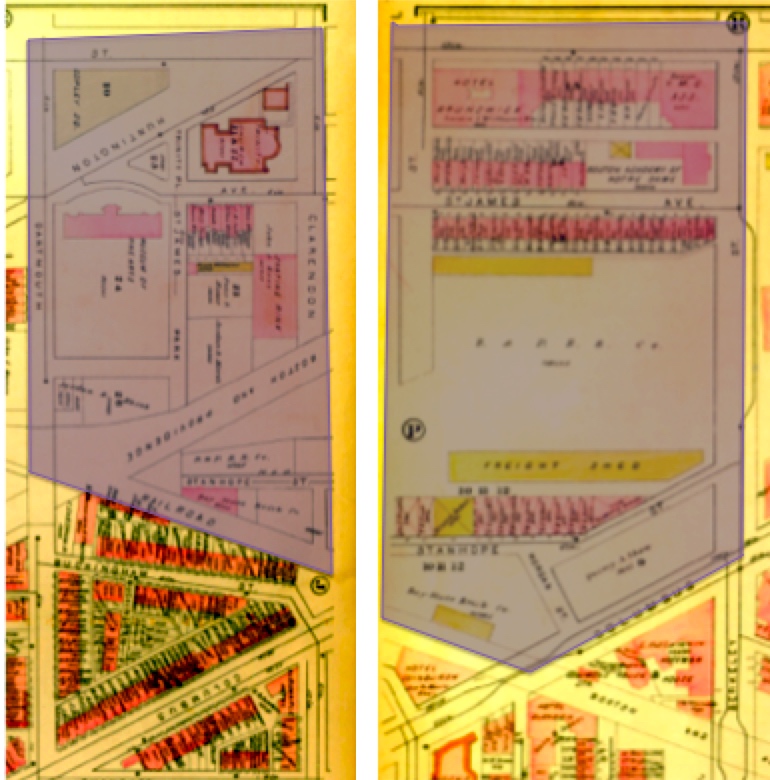 Figure 8b: Bromley Plae P. Figure 8c: Bromley Plate J.
The site appears to be divided into multiuse sections divided by the railroad land use. In plate P below the Boston and Albany Railroad Co. tracks the site is divided into small plots owned by single owners. Likewise, in plate J above the plot of land owned by the Boston and Providence Railroad the land plots are largely owned by single owners (there is a single owner who owns adjacent building plots). Interestingly, a notable number of these individual landowners are women.
The institutions in the area include the Boston Academy of Notre Dame, the Boston YMCA and the Museum of Fine Arts. The privately owned commercial uses include Bay State Brick Co., Hotel Brunswick and a Skating Rink. The only section that has multiple plots of land owned by a single owner, Jordan and Marsh, is on the northern side of the Boston and Providence Railroad. The streets are all largely the same as before except for Morgan Street which is now named Canhers Place and St. James Park is now Stuart Street.
Copley square, named after John Singleton Copley (a popular local painter) wasn’t established until in 1888. Businessmen determined the development of Copley Square would enhance the market value of the area and thus would be worthwhile and would benefit the Commonwealth of Massachusetts.
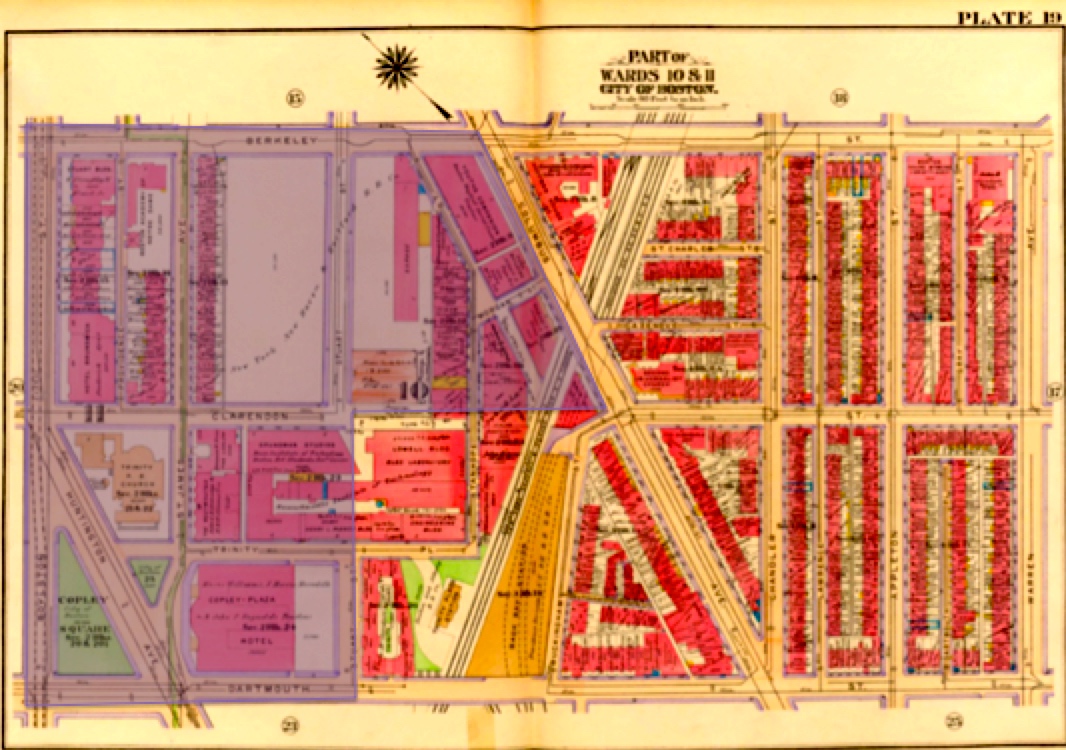 Figure 9:1887 Map of Boston, Plate 39. Sanborn Map Company. Boston, Massachusetts. New York, Sanborn Map and Publishing Co., 1885.
Figure 9 (above) features the Sanborn map from 1887. It features in its lower left corner the first depiction of Copley Square. Copley Square is intersected by Huntington Avenue. This avenue determines these triangular plots of land as well as confines the area where Trinity Church can develop, and thus informs the church’s shape as well.
A point of discussion is the prominence of all the churches in the area. Within my site alone there is Trinity Church (Episcopalian), the YMCA, the Academy of Notre Dame, the Pope Building (associated with Boston Baptist Social Union Trustees) and People’s Temple (Methodist). In addition in the surrounding area there are many more protestant (non-Catholic) churches. A question to be raised is why were there such a focus on developing these areas of worship outside strictly residential areas? Did the communities of Back Bay and Boston at large value religion less or more (or is it unrelated) which is why they are willing to commute to worship rather than live conveniently near their place of worship.
Besides the addition of Copley Square, the other notable difference between the 1883 and 1887 maps is the ownership of the railroads. In 1883 the Boston and Providence Railroad owned the plot of land between Clarendon and Berkeley Streets. However, within these four years the ownership of this area changes over to Boston and Albany Railroad with New York Central and Hudson River Railroad as lessees. This is a questionable addition to the map because in the following maps it reverts back to Boston and Providence Railroad ownership. Additionally, the MFA changes to the Copley Plaza Hotel but the hotel was not opened until 1912. So clearly, this atlas was mislabeled. Lastly, Stuart Street is extended through from Clarendon Street to Berkeley Street on this map, but again on future maps this has yet to be established. Although, this map has some issues the points brought up still hold true. The fact that there are problems with the map highlight the importance of double checking and not relying on dates or all information provided because some bias may be present.
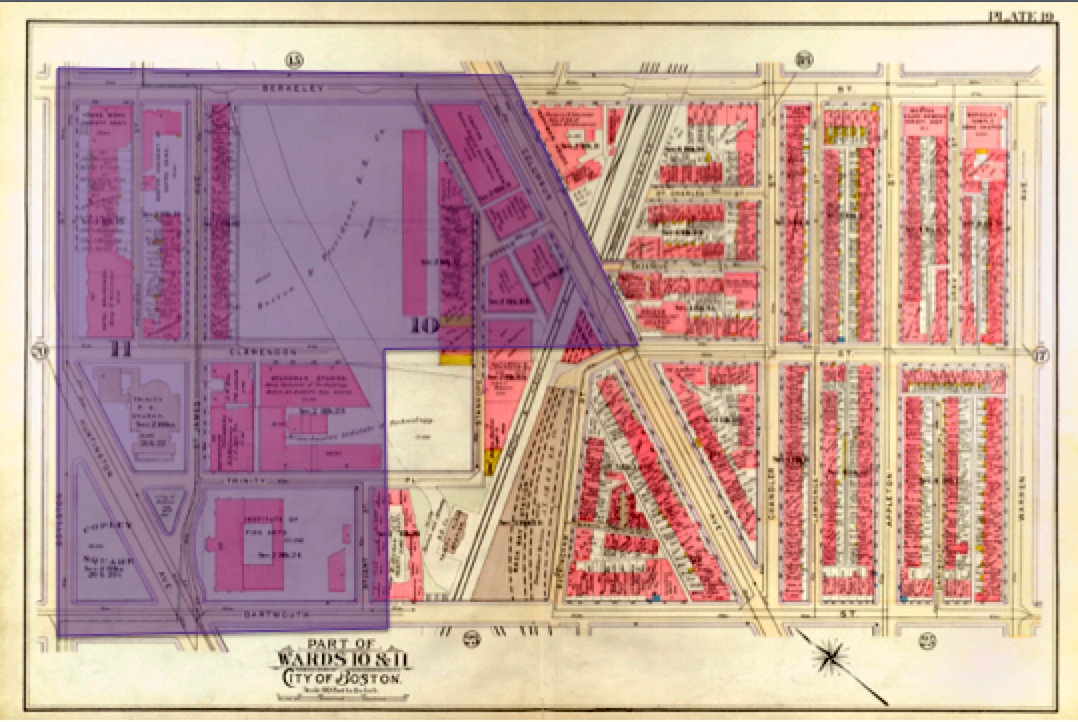 Figure 10: 1902 Atlas of the City of Boston, Boston Proper and from Actual Surveys and official Plans, Bromley.
This Bromley also is curious. The ownership of the railroad area has shifted back to Boston and Providence Railroad Co, Stuart Road that was on the previous Sanborn Map has vanished, and the MFA has returned in place of Copley Plaza Hotel (these are all corrections from the previous Sanborn Map). What is interesting is that MIT campus seems to have been partially destroyed by tracks that come from the Railroad plot of land. However, MIT has remained in tact according to MIT records and future maps.
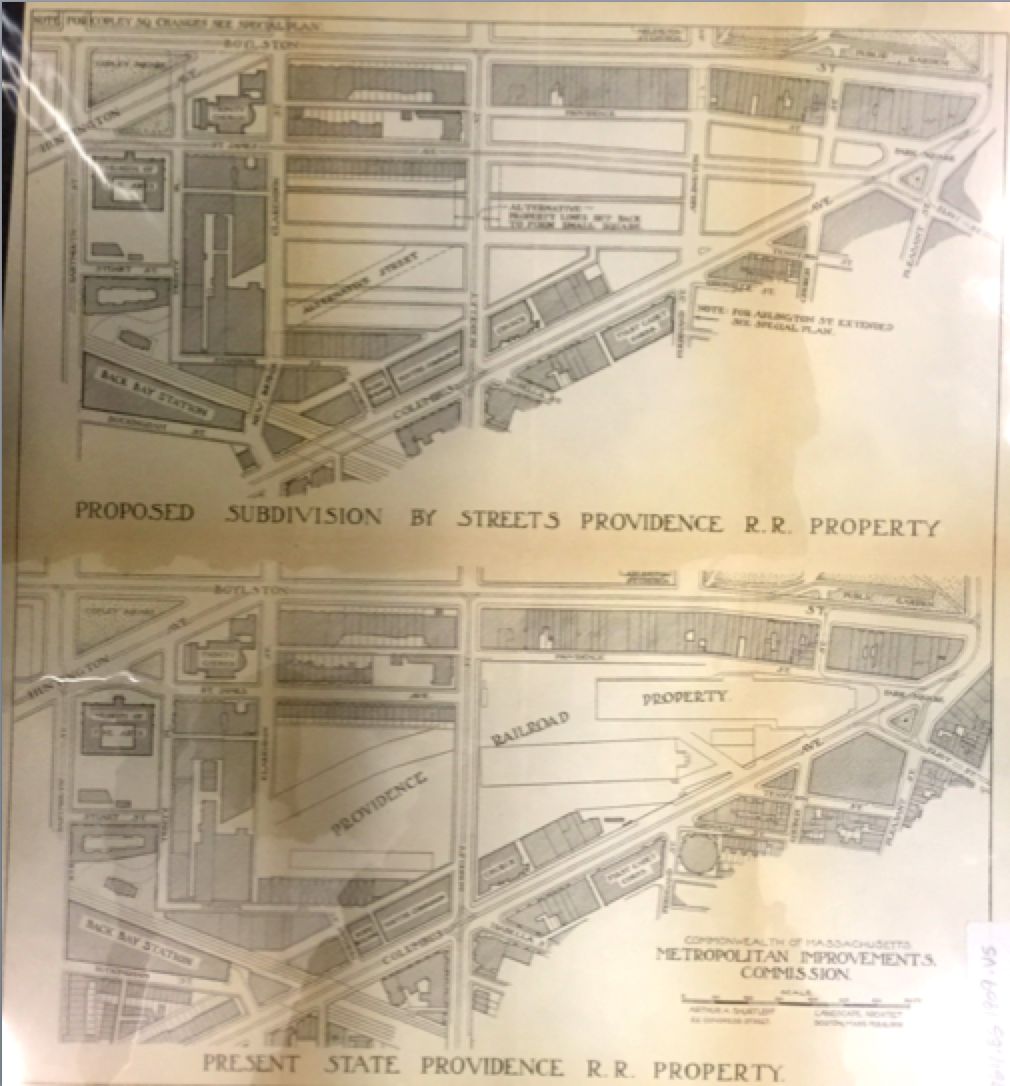 Figure 11:
This map is the first illustration of intentions for change. The proposal indicates intention to subdivide the streets that were currently owned by the R&R co. in 1909. This includes making St. James Ave continuous from Dartmouth St through to Berkeley St and straightening the road in front of the MFA property. The plans also propose to create a bridge to connect Clarendon Street to Columbus Ave near Back Bay Station. The final suggestion is to create a new square from Berkeley Street by moving the buildings back from the road.
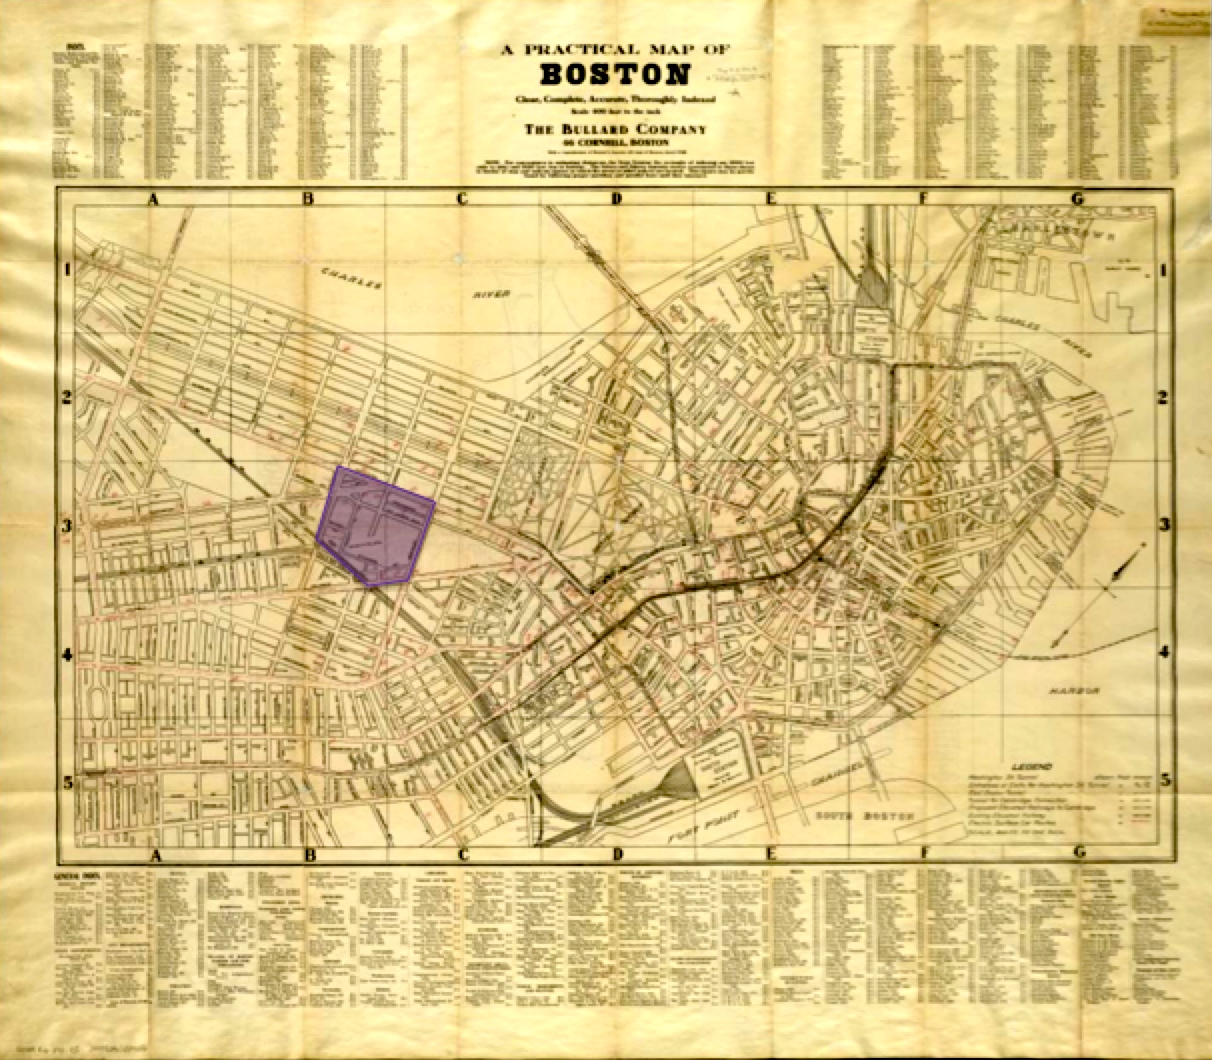 Figure 12a: A practical Map of Boston- The Bullard Company- G 3764.B6P2 (MIT Libraries)
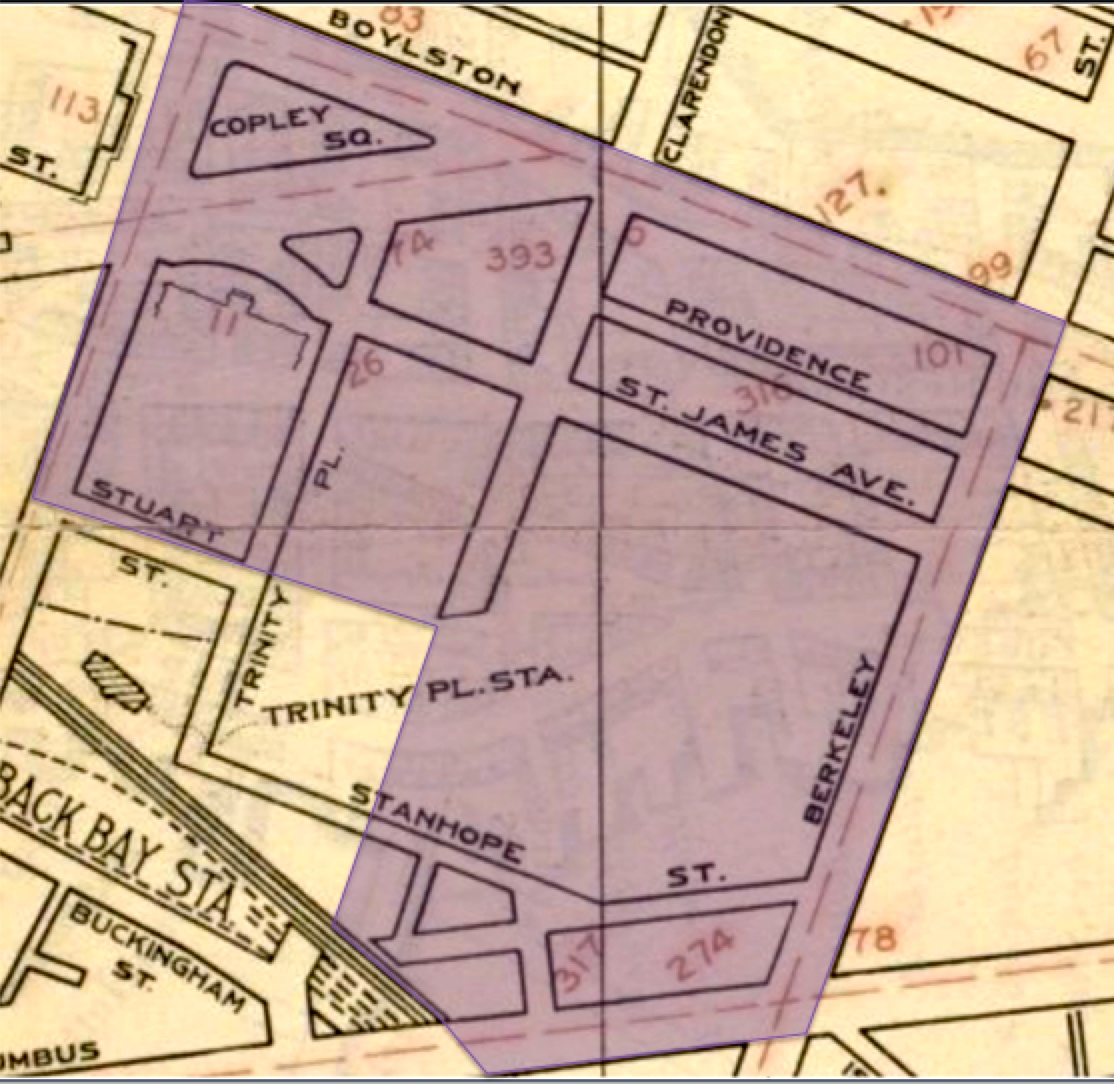 Figure 12b: A practical Map of Boston Zoomed
Despite the proposal from 1909, not all of the changes suggested were implemented according to the Bullard Co. Map from 1911. St. James Ave still curves away from the building in front of the MFA. Stuart Street also does not continue past Trinity Place and Clarendon does not extend to Stanhope Street as it planned in 1909. However, some changes were implemented. St. James Ave does extend all the way through from Dartmouth Street to Berkeley Street. There is some sign of change over these two years; the 1909 plan did not project a timeline onto its proposal. It is interesting to see that intentions for the area are slowly being carried out.
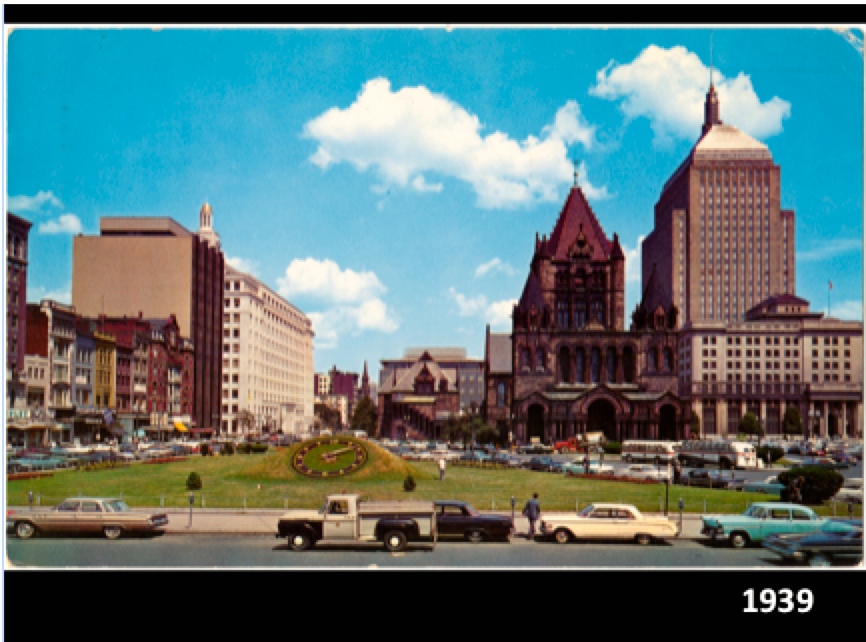 Figure 13: Photograph of Copley Square in 1939
Although this image is not a map, it is telling of the changes on the site. Still in 1939 Huntington Avenue intersects the square. This photograph shows the inundation and proliferation of automobiles in Boston. The phenomenon will be important to keep in mind in the next section where transportation’s effect on the development of the site is discussed.
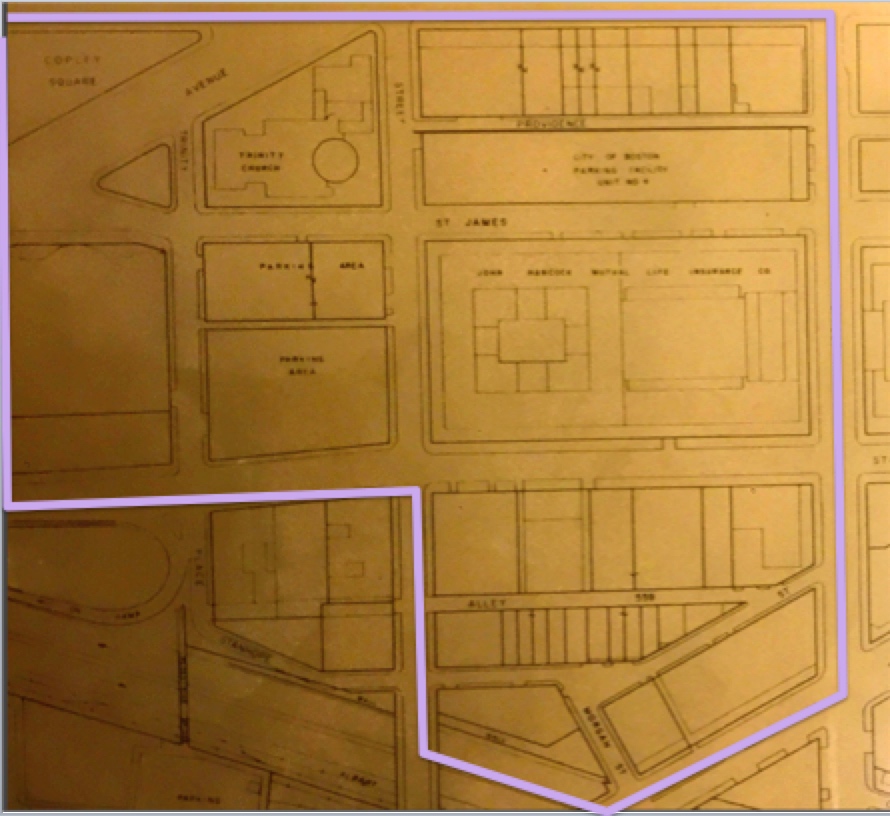 Figure 14: Boston Restoration Association Map from 1966
The significance of the automobile again can be seen from this map. Next to Trinity Church three separate parking centers have been established. This shows the dominance of the car during this era. The Parking centers are divided from other building uses, probably because the parking areas are disruptive and require a lot of space. Another building to note in this map is John Hancock Mutual Life Insurance Co. Building. The skyscraper allows for many more people to be productive in the area.
TRANSPORTATION
As discussed in the past two examples, the main method of transportation affects the development of the site. As stated earlier, from 1815 to 1875, America’s largest cities underwent spatial change due to the introduction of the steam ferry, bus, commuter rail, horse car, elevated railroad and cable car. These technologies turned these cities “inside out.”
The first technology to discuss is the horse drawn omnibus carriage. A huge fleet of horses (approximately 10,000 horses) were required to haul the bus up Boston’s hills. Despite attempts to alleviate the working horses, they were desperately overworked. At least four horses were used at a time and when a single horse stumbled and fell it was killed on the spot and its carcass left to decay on the side of the road to maintain the omnibus’s rigorous schedule. Besides the distraught this system wrought on the horses themselves the system was flawed as it impacted the hygiene of the city. The horses produced approximately ten pounds of waste per day that was dropped directly in the streets. Besides the stench and the obvious unappealing aesthetics the droppings brought in flies. The transportation sector needed to develop an alternative to keep the city transportation “alive” but not necessarily physically alive. The feasibility of depending on horses was not sustainable. (See below the image of the last horse drawn omnibus from 1900 standing in front of Trinity Church).
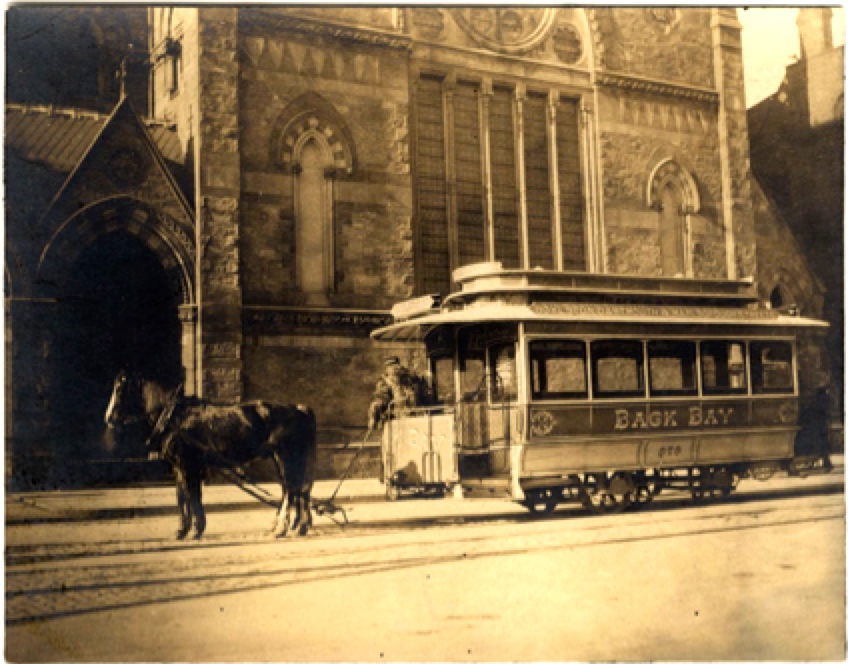 Figure 15: The last horse drawn trolley in front of Trinity Church. The Collections of the Massachusetts Historical Society. 1900.
To replace horses came electric streetcars. The electric streetcars were initially developed on short stretches of track, but quickly were able to connect cities together. These streetcars were advertised to transport city dwellers as a leisure mode of transportation. They were more reliable, more comfortable, and more humane than the former horse drawn streetcars.
The developers of the technology worked hard to keep trolley fares cheap, which in turn led to a burst in urban mobility. The streetcar, as Crabgrass Frontier, describes “served as a safety valve against further overcrowding.” The population was growing and the current homes couldn’t be retrofitted to sustain the growth while maintaining building codes. Having increased mobility allowed for Bostonians to move to the suburbs or further away from center-city without feeling disconnected.
The importance of the streetcar and trains in general is seen in my site. As seen in figure 12b, many of the main streets, which in my site’s case include Boylston Street, Huntington Ave, Berkeley Street and Columbus Avenue. Much of the land as previously discussed is influenced by train track orientation and Railroad Company’s land development. The railroads and automobiles alike influence the land use potential in downtown Boston and Back Bay.
CURRENT DEVELOPMENT
The final points I would like to make are about the recent development of the area on the site. The Copley Square has undergone a good deal of change in the past 155 years, however it is not yet done changing.
In 1965, Boston Mayor Collins created a competition to redesign Copley Square in time to celebrate the centennial of the square’s establishment in 1970. He acknowledged that there were “different needs, users and concerns in the changing and varying conditions of its borders” and that “… Copley Square be redesigned and restored to its architectural prominence as one of the world’s great urban spaces…”. The winners Chalres Hilgenhurst, Dawson Sasaki, and DeMay Associates published their plans in 1966. This was the plan that removed Huntington Avenue from Copley Square and allowed for the Square to become more pedestrian friendly and open.
This preliminary competition set the precedent for competitions as a mode of change. Again in the 1980s another design competition for Copley Square took place. The winners Clarke and Rapuano (Dean Abbott) were selected by the Copley Square Design Jury on May 21, 1984. Their designs, depicted below (see figures 16 a and b), featured double lined trees that provide “outdoor rooms” with seating. The open square itself was described as a “front yard” for the two buildings and an outdoor living room for the community.
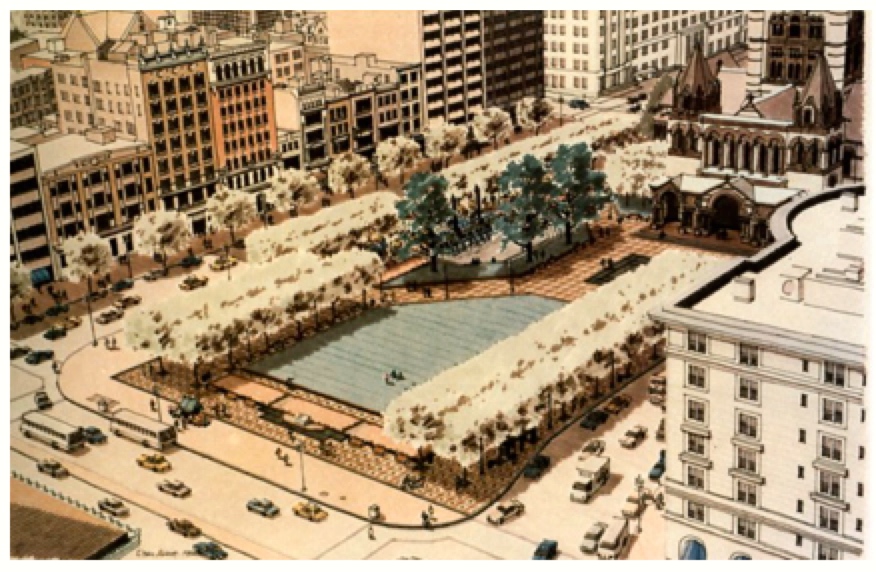 Figure 16a: 1984 Copley Square Redesign Winner
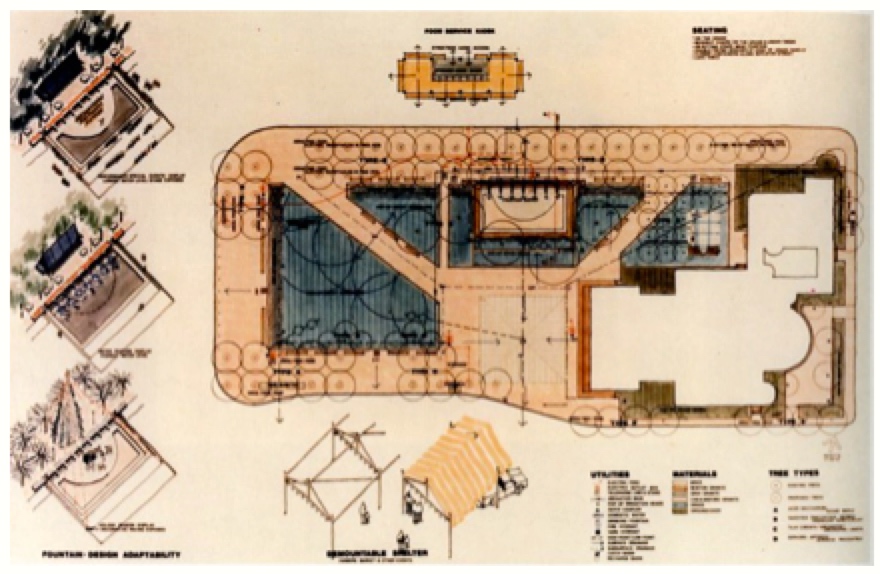 Figure 16b: Copley Redesign Plan 1984
The most recent plans for redesigning Copley Square were approved by Mayor Thomas Menino and the Boston Restoration Association in 2011. The plan includes a $500 million private investment to renovate Copley Place. The restoration would produce a mixed-use development with 318 created jobs in addition to 75,000ft2 of new retail, restaurant and atria space. The renovated building would have 47 floors and stand as the tallest residential tower in Boston. Although plans have been approved action still needs to be taken to get this project under construction.
CONCLUSION
The use and development of Copley Square and my site at large will continue to change over time as the needs of Boston community also change. When the focus was on institutional development, Copley Square supported the burgeoning institutions. When railroads and transportation was being developed the area showed flexibility in its structure and roads. And when the future focus is found the area will find a way to accommodate the new focus.