


7.3.1 Event-Paced Simulation of a Spatially Distributed Queueing SystemWe now present an example that illustrates the event-paced method for advancing the clock as well as some ideas that are often used in the simulation of queueing systems. The specific example that we shall use is identical to the emergency repair problem described in Section 5.2, with one exception: it will be assumed that, whenever there is a queue of calls waiting for service at a time when the repair unit is busy serving a call at point (x, y), the next call to be selected for service is the one nearest to (x, y). (If there is no queue of calls, the unit is assumed to remain stationary at the location of the last call that was served and wait for the next call.) We shall define "nearest" in terms of travel time. To be specific, let us assume that the service region in this case is a
2- by 1-mile rectangle (Figure 7.23); a right-angle metric is in effect,
with directions of travel parallel to the sides of the region; the
effective travel speed is constant at 20 mph; calls for service are
generated in a Poisson manner at the rate of three per hour; the
locations of calls for service are independent and uniformly distributed
over the service region; and the amount of time on the scene needed for
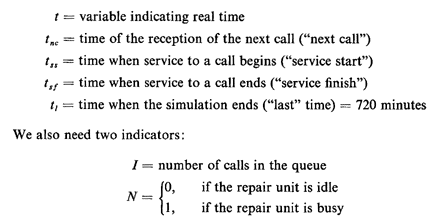
the emergency repair has the pdf shown in Figure 7.24. Times on the
scene needed for successive calls are statistically independent.
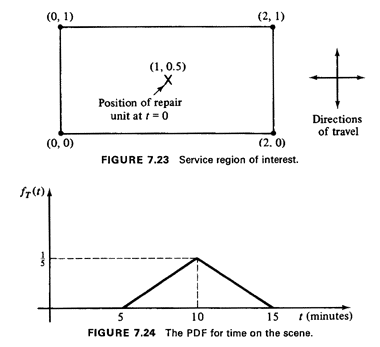
The total service time to a call consists of the sum of travel time to the location of the call plus time on the scene. Despite the independence of successive on-the-scene times, successive total service times are not independent, because of the "nearest-point" criterion of priority. To understand why, observe that, after a call which requires a long service time, it is more likely that the repair unit will be dispatched to a relatively nearby point (owing to the increased probability of several spatially distributed calls in queue). Because of this dependence between service times, this situation cannot be analyzed (exactly) through classical queueing theory models. We shall therefore use simulation. Suppose that we wish to simulate this spatially distributed queueing system over a period of, say, 12 hours and to collect some statistics such as the average time between reception of a call and the instant when the unit arrives on the scene, the maximum observed queue length, and so on. We shall assume that at time t = 0, there are no calls in the "system"
and that the emergency repair unit is located at the center of the
service region. [We shall use a x-y coordinate system with the origin
(0, 0) at the southwest corner of the region. We shall also use
"minutes" as our time units.]
A number of time variables must be defined before we can proceed to the
simulation program. Let
It should be noted that service to a call begins as soon as the trip of the repair unit toward the location of that call begins. We shall use the index j to denote calls in order of reception by the repair unit's dispatcher. Associated with call j is the time of its arrival, tj, and the location of the call (xj, yj). The current location of the repair unit is denoted by (x0, y0). Then the travel time needed to travel at 20 mph to a call at (xj, yj) once the unit completes service at a location (x0, y0) is given in minutes by 
Finally, we shall use two random-number generators, one for probabilistic quantities related to time and the other for the locations of the incidents. We shall use r1k(k = 1, 2, . . .) and r2m(m = 1, 2, . . .), respectively, to denote random numbers provided by the two generators. It is important to keep in mind that every appearance of r1k or r2m in a logical box of a flowchart implies that the computer must draw a new random number from the appropriate random-number generator each time this box is entered during the execution of the program.
The computer program that simulates the foregoing problem is now
outlined in flowchart form in Figure 7.25. The program consists of an
initialization step (upper left-hand box), a main program, and a number
of subroutines (subprograms). The main program-the "scheduler" -is
concerned with finding out which is the next "event" that takes place
and then instructs the computer to execute a subroutine accordingly. The
events of interest are
of four kinds: an arrival of a new call, the initiation of service to a
call, the completion of service to a call, and the end of the
simulation. The latter event occurs just once in the simulation.
Thus, the main program is just the logical box indicated as MP in Figure 7.25. Note that the actions that the computer takes upon the occurrence of each event are repetitive. For instance, following the arrival of a new call, at time t = tnc, the computer first records the time and location of the call and then checks to find out whether the repair unit is idle or not. If it is idle (N = 0), it immediately assigns the newly arrived call to the unit ss = t). If it is busy, the newly arrived call must join the existing queue and the length of the queue must, therefore, be increased by one (I = I + 1). In either case, the time of arrival of the next call is projected 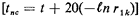 and we return to the main program.
The reader should now review carefully the rest of the flowchart. It is particularly important to gain an understanding of how the time, t, "jumps" from event to event through the Min (·) operator in the MP box. Time intervals between these jumps are not equal, because events occur at unevenly spaced intervals. Note also how by having two random-number generators, we can control better our experiments (by repeating, for instance, the r2m sequence that produces call locations while varying the r1k sequence that controls the timing of events). We could, of course, have used more than two random-number generators. How does the simulation end? Eventually, tl(= 720 minutes) is bound to become the smallest of the variables tnc, tss, tsf, and tl. This signifies that the simulation has run for the desired length of time and that we can now tabulate and print the desired statistics and then stop. This should also make clear to the reader the somewhat confusing reason for using the number 999, to which tss and tsf are reset every once in a while. Obviously, there is nothing special about the value 999: any number greater than 720 would do. All that is required is a number large enough to keep tss and/or tsf from ever being chosen as the minimum of the four variables when they are not supposed to be. We also make sure, in this way, that the simulation will eventually end. Exercise 7.5 Explain the meaning of the equation

in the tss subroutine. Note that this equation requires the generation of two independent random numbers. We conclude this section by noting that the flowchart of Figure 7.25 can be easily modified to simulate a wide variety of other queueing situationsincluding much more complicated ones. We could, for instance, with the same basic logic simulate many cases involving classes of calls with priorities assigned according to class of the call, queueing systems with finite queue sizes, spatially distributed queueing systems with time-dependent arrival and service rates, and so on. Extensions of this type are explored in Problems 7.8 and 7.9. |