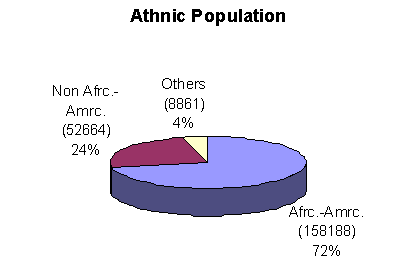
| African American Population in west Philadelphia is majority as well as in Mill Creek. |
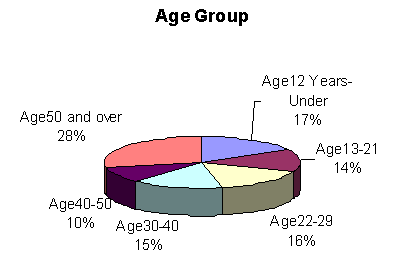
| More than 60% of the Population are under 40 years old |
| West Philadelphia Structure Population |
|
|||
|
|
||
|
|
||
|
 |
POPULATION
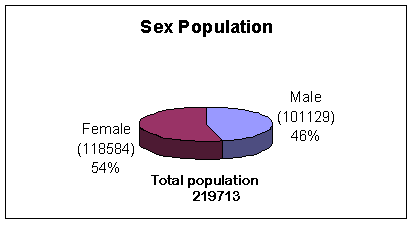
Total Population.............................................| 219713
Sex
Male.......................................................| 101129
Female.....................................................| 118584
Age | Total | Male | Female
Under 1 year.........................| 2360| 1192| 1168
1 and 2 years........................| 6466| 3248| 3218
3 and 4 years........................| 5701| 2897| 2804
5 years..............................| 2635| 1313| 1322
6 years..............................| 2497| 1293| 1204
7 to 9 years.........................| 7516| 3815| 3701
10 and 11 years......................| 5058| 2572| 2486
12 and 13 years......................| 4861| 2447| 2414
14 years.............................| 2242| 1137| 1105
15 years.............................| 2362| 1152| 1210
16 years.............................| 2315| 1137| 1178
17 years.............................| 2481| 1236| 1245
18 years.............................| 3606| 1791| 1815
19 years.............................| 5362| 2783| 2579
20 years.............................| 6148| 3245| 2903
21 years.............................| 6028| 3096| 2932
22 to 24 years.......................| 14125| 7249| 6876
25 to 29 years.......................| 20924| 10355| 10569
30 to 34 years.......................| 18382| 8558| 9824
35 to 39 years.......................| 14927| 6856| 8071
40 to 44 years.......................| 12186| 5525| 6661
45 to 49 years.......................| 9283| 4079| 5204
50 to 54 years.......................| 8882| 3801| 5081
55 to 59 years.......................| 9369| 3901| 5468
60 and 61 years......................| 4050| 1697| 2353
62 to 64 years.......................| 6235| 2613| 3622
65 to 69 years.......................| 10393| 4285| 6108
70 to 74 years.......................| 8415| 3224| 5191
75 to 79 years.......................| 6717| 2286| 4431
80 to 84 years.......................| 4407| 1320| 3087
85 years and over....................| 3780| 1026| 2754
Detailed Race
White......................................................| 52664
Black......................................................| 158188
American Indian, Eskimo, or Aleut..........................| 734
American Indian..........................................| 707
Eskimo...................................................| 10
Aleut....................................................| 17
Asian or Pacific Islander..................................| 7144
Asian....................................................| 7060
Chinese................................................| 2336
Filipino...............................................| 341
Japanese...............................................| 522
Asian Indian...........................................| 1027
Korean.................................................| 1115
Vietnamese.............................................| 486
Cambodian..............................................| 606
Hmong..................................................| 1
Laotian................................................| 145
Thai...................................................| 55
Other Asian............................................| 426
Pacific Islander.........................................| 84
Polynesian.............................................| 58
Hawaiian.............................................| 44
Samoan...............................................| 13
Tongan...............................................| 1
Other Polynesian.....................................| 0
Micronesian............................................| 15
Guamanian............................................| 15
Other Micronesian....................................| 0
Melanesian.............................................| 0
Pacific Islander, not specified........................| 11
Other race.................................................| 983
Hispanic Origin
Total persons of Hispanic origin...........................| 3008
Mexican..................................................| 468
Puerto Rican.............................................| 919
Cuban....................................................| 288
Other Hispanic...........................................| 1333
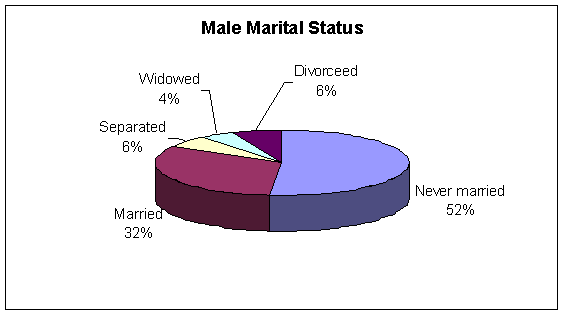
Marital Status (for Persons 15 years and over)
| Total | Male | Female
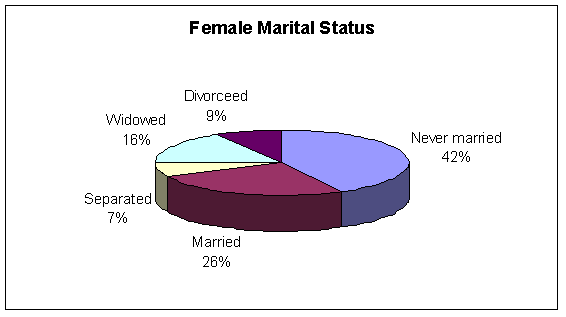
Never married........................| 83816| 41937| 41879
Now married, except separated........| 51563| 25995| 25568
Separated............................| 11716| 4640| 7076
Widowed..............................| 19560| 3549| 16011
Divorced.............................| 13722| 5094| 8628
Household size and type
1-person households........................................| 29706
Males 65 years and older living alone....................| 2488
Females 65 years and older living alone..................| 7853
Households with 2 or more persons..........................| 54029
Family households........................................| 46694
Married couple family, with no related children........| 13386
Married couple family, with related children...........| 9249
Male householder with related children (no wife).......| 1779
Female householder with related children (no husband)..| 12555
Persons per family.....................................| 3.24
Nonf amily households.....................................| 7335
Group Quarters
Institutionalized persons..................................| 2618
Other persons in group quarters............................| 10784
Persons in emergency shelters for homeless...............| 357
Persons visible in street locations......................| 134
Persons 65 years and older in group quarters...............| 2406
Institutionalized persons 65 years and older.............| 1826
HOUSING Total housing units..........................................| 94940 Occupancy and Tenure Occupied housing units.....................................| 83735 Owner occupied...........................................| 43383 Renter occupied..........................................| 40352 Vacant housing units.......................................| 11205 For seasonal, recreational, or occasional use............| 95 Boarded up...............................................| 2799 Persons per occupied housing unit..........................| 2.46 Persons per owner-occupied housing unit..................| 2.76 Persons per renter-occupied unit.........................| 2.15 Housing units with 1.01 or more persons per room...........| 4138 Units in structure 1 housing unit, detached...................................| 2600 1 housing unit, attached...................................| 50580 2 housing units............................................| 9126 3 or 4 housing units.......................................| 9273 5 to 9 housing units.......................................| 5422 10 to 19 housing units.....................................| 2562 20 to 49 housing units.....................................| 3485 50 or more housing units...................................| 10925 Mobile home or trailer.....................................| 26 Other......................................................| 941 Race and Hispanic origin of householder (occupied housing units) | Total |Owner-occupeid |Renter-occupeid White................................| 22055| 9142| 12913 Black................................| 58683| 33709| 24974 American Indian, Eskimo, or Aleut....| 281| 148| 133 Asian or Pacific Islander............| 2403| 294| 2109 Other race...........................| 313| 90| 223 Hispanic origin, of any race.........| 985| 345| 640 Value of specified owner-occupied housing units Less than $15,000..........................................| 4977 $15,000 to $19,999.........................................| 3975 $20,000 to $24,999.........................................| 4155 $25,000 to $29,999.........................................| 3831 $30,000 to $34,999.........................................| 3437 $35,000 to $39,999.........................................| 2549 $40,000 to $44,999.........................................| 1982 $45,000 to $49,999.........................................| 1410 $50,000 to $59,999.........................................| 2334 $60,000 to $74,999.........................................| 3097 $75,000 to $99,999.........................................| 2945 $100,000 to $124,999.......................................| 847 $125,000 to $149,999.......................................| 431 $150,000 to $174,999.......................................| 315 $175,000 to $199,999.......................................| 210 $200,000 to $249,999.......................................| 202 $250,000 to $299,999.......................................| 82 $300,000 to $399,999.......................................| 39 $400,000 to $499,999.......................................| 12 $500,000 or more...........................................| 22 Mean value (dollars).....................................| 43819 Mean value, White householder............................| 79927 Black householder............................| 34542 American Indian, etc. householder............| 38979 Asian or Pacific Islander householder........| 78281 Other race householder.......................| 49954 Hispanic-origin householder..................| 54043 Contract rent of specified renter-occupied housing units With cash rent: Less than $100...........................................| 1754 $100 to $149.............................................| 2480 $150 to $199.............................................| 2132 $200 to $249.............................................| 3482 $250 to $299.............................................| 4338 $300 to $349.............................................| 5256 $350 to $399.............................................| 5151 $400 to $449.............................................| 3436 $450 to $499.............................................| 2604 $500 to $549.............................................| 1941 $550 to $599.............................................| 1320 $600 to $649.............................................| 1403 $650 to $699.............................................| 981 $700 to $749.............................................| 705 $750 to $999.............................................| 1325 $1,000 or more...........................................| 760 Mean contract rent (cash rent) (dollars)...............| 384 ditto, White householder.............................| 529 Black householder.............................| 301 American Indian, etc. householder.............| 352 Asian or Pacific Islander householder.........| 446 Other race householder........................| 443 Hispanic-origin householder...................| 452 No cash rent...............................................| 921
LAND AREA (square miles).....................................| 13.8869
SUBSTITUTION AND IMPUTATION OF DATA Persons for whom questionnaires were not substituted.........| 217276 Persons for whom no items were allocated from elsewhere....| 146587 Persons for whom one or more items were allocated..........| 70689 Persons for whom questionnaires were substituted.............| 2437 Housing units for which questionnaires were not substituted..| 93732 Housing units for which no items were allocated............| 69655 Housing units for which one or more items were allocated...| 24077 Housing units for which questionnaires were substituted......| 1208