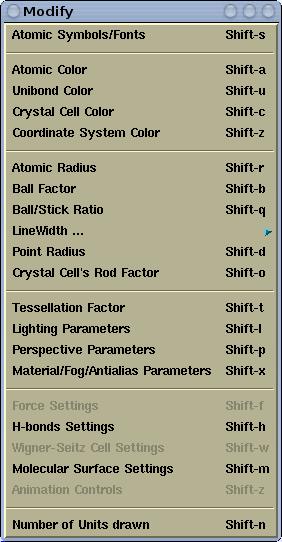
Various display parameters can be modified via the
Modify menu.
Here is its snapshot for
XCrySDen-v1.4:
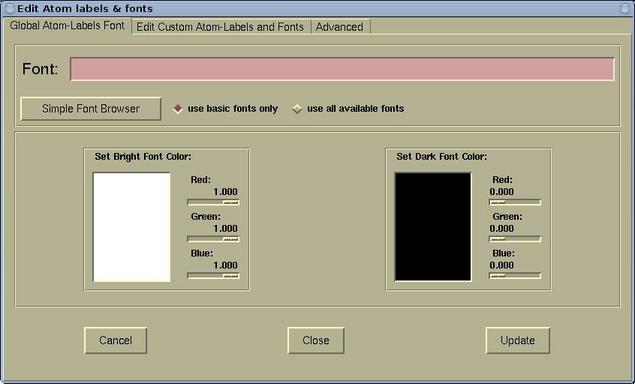
Atomic synbols/fonts can be set and/or modified
via menu:
Modify-->Atomic
Symbols/Fonts . There are two types of
settings: (i) global and (ii) custom. The global
settings (font and color) apply to all default atomic
labels, i.e., those that were not customarily set.
There are two different font colors: (i) bright font
color, and (ii) dark font color. The first is used for
display modes such as ball-and-sticks and spacefills,
where the labels are written on the atomic-balls. The
latter is used for display mode such was lines
(wire-frame). Here the atomic labels are put beside the
atomic positions.
The Edit Atom labels & fonts window has
three pages:
- The Global Atom-Labels Font page is used
for setting the font and color of default (global)
atomic labels. Here is this page:
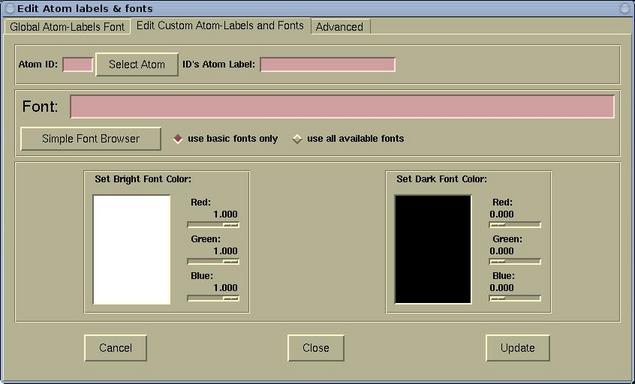
- The Edit Custom Atom-Labels and Fonts page
is used for setting the custom atomic labels. First a
given atom must be selected (via the [Select
Atom] button). For the selected atom, the label,
font, and font-color can be set. The whole process
can then be repeated for other atom. The labels that
were defined in this was are called "custom
atom-labels".
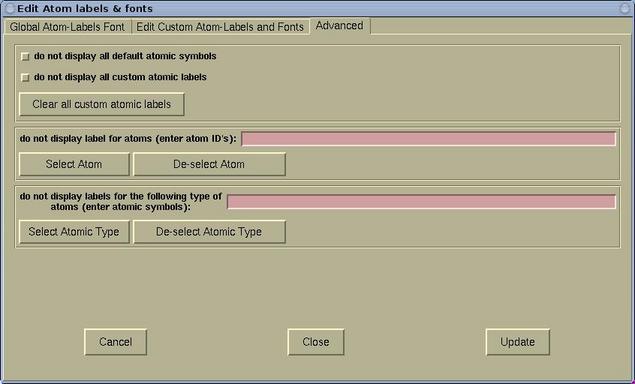
- The Advanced page is used for further
label manipulation. Here it is possible to toggle the
display of default and custom labels. It is possible
to toggle the display of labels for given individual
atoms or for given atomic types.
An atomic color can be set via menu:
Modify-->Atomic
Color
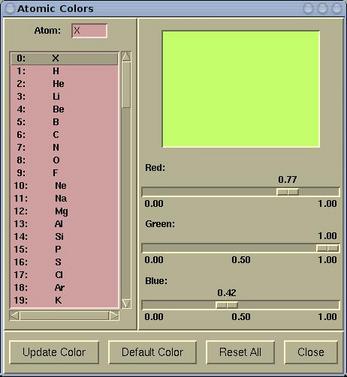
To modify an atomic color
do the following:
Select a particular element from the left listbox and
set the color by dragging the Red/Green/Blue scales.
When the color suit your needs, press the
[Update
Color] button, otherwise the setting will be lost.
Buttons at the bottom of the
Atomic Colors
window have the following function:
|
[Update Color]
|
updates the atomic color of selected element
|
|
[Default Color]
|
resets the atomic color of selected element
back to its default value
|
|
[Reset All]
|
resets all atomic colors back to default
values
|
|
[Close]
|
closes the Atomic Colors window,
otherwise does nothing
|
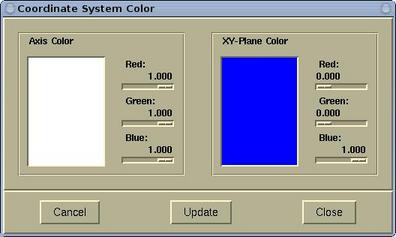
The color of the Coordinate system can be set via
menu:
Modify-->Atomic
Radius .
Atomic radius and other related items can be set
via:
Modify-->Atomic
Radius
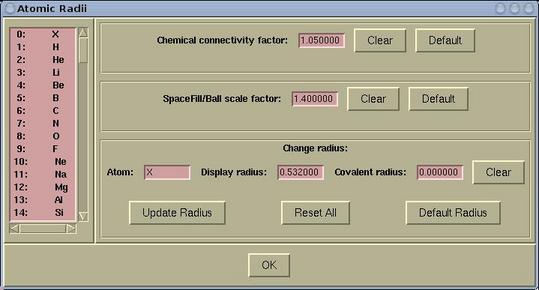
The following parameters can be set here:
|
chemical connectivity factor
|
determines, whether to draw the bond between
two atoms. The bond between two atoms is
drawn when the distance is less than the sum
of their covalent radii times the chemical
connectivity factor
|
|
spacefill scale factor
|
determines the size of the spacefills and
balls. The spacefill radius is:
rspacefill =
                                    spacefill_scale_factor *
                                    ratomic
where ratomic is a
display radius of the corresponding atom.
|
|
display radius
|
it determines the display-size of a given
atom.
|
|
covalent radius
|
well, everybody knows what it is ...
|
To modify either chemical connectivity
factor or spacefill scale factor do the
following:
In the corresponding entry widget enter a value and
press the [OK] button, which is at the bottom
of the window.
To modify the display radius or the
covalent radius do the
following:
First, select a particular element from the left
listbox and enter a new value in the corresponding
entry. Then press the [Update Radius] button,
otherwise the setting will be lost.
Buttons in the Atomic Radii window have the
following function:
|
[Clear]
|
clears a value in the entry to null string
|
|
[Default]
|
sets a default value
|
|
[Update Radius]
|
updates the covalent radius of selected
element
|
|
[Reset All]
|
resets the covalent radius of all elements
back to default values
|
|
[Default Radius]
|
resets the covalent radius of selected
element back to its default value
|
|
[OK]
|
updates chemical connectivity factor
and spacefill scale factor and
closes the Atomic Radii window
|
A tessellation factor can be set via menu:
Modify-->Tessellation
Factor . Then one simply enter a new
value. Quite trivial.
Here I would like to explain what the
tessellation factor is. This factor
determines the quality of the structure display
(balls, bonds, vectors). It has nothing to the with
the quality of an isosurface display. The greater the
value of tessellation factor the better the
quality of display.
According to the value of tessellation
factor the quality of the display can be
classified as:
|
quality
|
tessellation factor
|
|
bad
|
1-20
|
|
moderate
|
20-40
|
|
good
|
>40
|
Please note that
tessellation
factor is just a hint for
XCrySDen, since the
program will make some tuning according to the size of
the displayed structure (for big structures the
tessellation factor is internally reduced by some
factor).
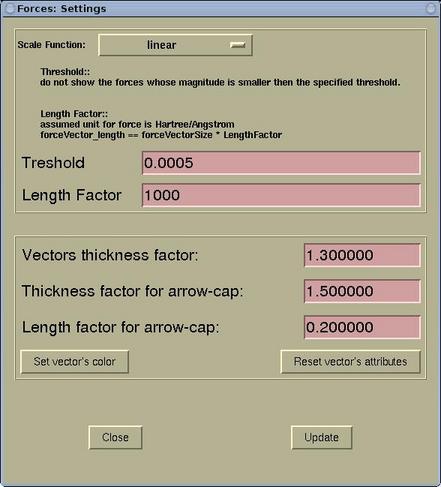
A setting of the force display can be edited via
menu:
Modify-->Force
Settings . Forces are rendered as arrows
and the lengths of the display arrows represent the
force magnitudes. Here one can specify the (i) scale
function, (ii) threshold, and (iii) length factor. In
addition, the display attributes of force arrows ban be
set (aspect and color).
|
Scale Function
|
can be set to: linear, logarithmic, square
root, cubic root, exponential, and exp(x*x).
According to my experiences the most useful
scale for the visualization of forces is
linear. However if one has a structure where
the force sizes range over the orders of
magnitude, then the logarithmic scale would
be better. In this case a force of 0.01
Ryd/Bohr would be displayed as a vector of 2
arbitrary length units in size, while the
force of 0.001 Ryd/Bohr as 1 arbitrary length
units in size.
|
|
Threshold
|
don't display forces below a given threshold
|
|
Length factor
|
controls the visual length of the displayed
force-vectors. The assumed force unit is
Hartree/ANGSTROM and a force of 1
Hartree/ANGSTROM will be rendered as 1
ANGSTROM long if the length factor is equal
to 1. The actual displayed length can be
calculated as:
length = lengthFactor *
                                    forceMagnitude
|
|
Vector thickness factor
|
determines how thick is the force arrow.
|
|
Thickness factor for arrow-cap
|
determines how thicker is the arrow-cap with
respect to arrow's line.
|
|
Length factor for arrow-cap
|
determines the length of the arrow-cap in
terms of the fraction of the arrow's length.
|
|
[Set vector's color]
|
Here the color for the force arrows can be
set.
|
Warning: press the [Update] button to
load the new setting and to update the display.
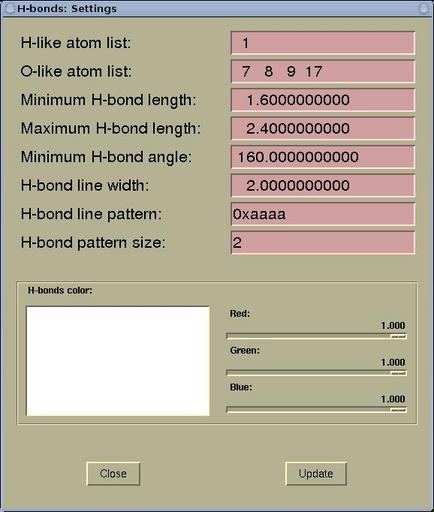
A setting of the display of the hydrogen bonds can
be edited via menu:
Modify-->H-bonds Settings .
The display of the H-bonds can be controlled by the
following parameters in the
H-bonds: Settings
window.
|
H-like atom list
|
here the atomic numbers for the H-like atoms
are specified. In fact, it should be only
hydrogen, but having the possibility to enter
also other atoms make larger display
flexibility. ( For example, there
can be two different types of H atoms in a
given molecule, and one would like to display
them differently. Hence in the structure file
(such as XSF)
the two types can be represented by H and
He.)
|
|
O-like atoms list
|
the list of the electro-negative atoms (enter
atomic numbers) such as O, N, F that can form
the hydrogen bond
|
|
Minimum H-bond length
|
is a minimal allows length of the H-bond
(used to distinguish between the normal
chemical bond and the hydrogen bond)
|
|
Maximum H-bond length
|
the maximum length between the H and the
other atom to be still considered as the
H-bond
|
|
Minimum H-bond angle
|
the minimum A-H---B bond angle to be still
considered as the H-bond
|
|
H-bond line width
|
the thickness of the displayed H-bond (the
H-bond is displayed as line)
|
|
H-bond line pattern
|
the dashing pattern of the lines that
represent the H-bonds (in hexadecimal form,
e.g. 0xeafa)
|
|
H-bond pattern size
|
the dash length of the lines that represent
the H-bonds
|
|
H-bonds color
|
the display color of the H-bonds
|
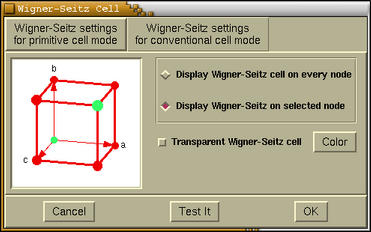
A setting of the Wigner-Seitz cell display can be
edited via menu:
Modify-->Wigner-Seitz Cell
Settings . The following window pops-up
when this options is selected.
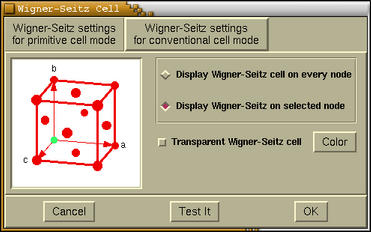
At the top of this window two tab buttons
are located. These are
[Wigner-Seitz setting for
primitive cell mode]> and
[Wigner-Seitz
setting for conventional cell mode]. Under the each
tab we can set the display of the Wigner-Seitz cells
for the appropriate unit-cell display-mode.
Below the tab buttons a frame with several widgets is
located. On the left the appropriate lattice-type is
displayed, while on the right the following items
widgets (widgets) are mapped:
-
[Display Wigner-Seitz cell on every node]
-
displays the Wigner-Seitz cell on very lattice
point.
-
[Display Wigner-Seitz cell on selected node]
-
displays the Wigner-Seitz cell only on selected
lattice points. This selection is done by
mouse-clicking the lattice points displayed on the
left side unit-cell-display window.
-
[Transparent Wigner-Seitz cell]
-
toggles the transparency of the displayed
Wigner-Seitz cells.
-
[Color]
-
sets the color of the Wigner-Seitz cells.
Warning:
The [Test It] button should be pressed to load
new setting and update the display of the
Wigner-Seitz cells. The [Cancel] button
disables the display of Wigner-Seitz cells, while
[OK] button merely closes the Wigner-Seitz
Cell window (Test-It button should be
pressed prior to load the setting).
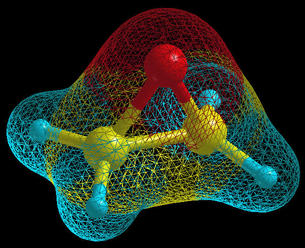
A setting of the Molecular Surface Settings can be
edited via menu:
Modify-->Molecular Surface
Settings .
In
XCrySDen this term is
used for a special king of plots. One purpose of this
plots is yet another display-mode of a molecule. Unlike
the ball&stick it is not build from simple
graphical primitives like spheres and cylinders, but
rather resembles the molecular charge density display.
An oxirane molecule is displayed on the below figure in
the ball&stick display-model with the molecular
surface, which is displayed in
wire mode.
The molecular surface is build with the
following recipe:
-
on each atomic
center put the following Gaussian function:
fa(x) = 2 * exp[
                            -ln(2)/ra2 *
                            |xa - x|2
                            ],
where the x_a is the position
of the atom A, and r_a is some
specific radius for the atom A (usually covalent or
van der Waals radius). This Gaussian function has
the following properties: (i) at the nucleus center
A its values is 2, and (ii) at the
|x_a - x| =
                                r_a
it
equals to 1 (i.e. 50% of its maximum value).
- calculate the 3D grid of points inside an
appropriate box, which embeds the molecule.
- specify an isovalue for the molecular surface,
which should be in the [0,2] range (a good value is
1).
- triangulates and render the isosurface.
The following window appears when the
Modify-->Molecular
Surface Settings menu option is
selected.
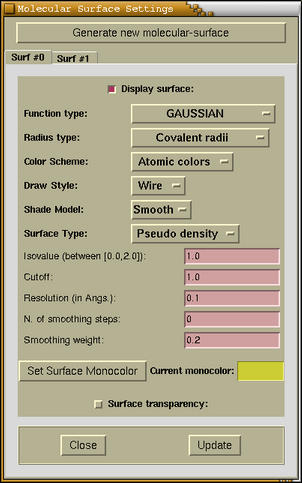
At the top of the window the
[Generate
new molecular-surface] button is located. It
generates new molecular surface. The properties of each
newly generated molecular surface are set to some
preset-default values, but you can control them by
pressing an appropriate tab button. The tab buttons are
located just below the
generate button. There
are plenty of widgets on each tab-page.
-
[Checkbutton: Display surface]
-
Toggles the display of current molecular surface.
-
[Optionmenu: Function type]
-
Here we can chose among different functions. These
are the functions alike the above Gaussian function. The
following functions beside the above Gaussian are
available:
-
EXPONENTIAL
-
an exponential function, with the similar
properties as above Gaussian function, namely:
(i) at the nucleus center A its values is 2,
and (ii) at the
|x_a - x| =
r_a it equals to 1 (i.e. 50% of its
maximum value).
-
constant GAUSSIAN
-
alike GAUSSIAN function, but the
r_a for all the atoms is taken to
be constant and is set to 1 ANGSTROM.
-
constant EXPONENTIAL
-
alike EXPONENTIAL function, but the
r_a for all the atoms is taken to
be constant and is set to 1 ANGSTROM.
-
distance FUNCTION
-
in each point of the 3D grid the distance to
the nearest atom is stored. This is useful for
the gap analysis.
-
[Optionmenu: Radius type]
-
Chooses the radius-type of
r_a among
covalent and van der Waals radius
-
[Optionmenu: Color Scheme]
-
Chooses among Atomic colors and
Monocolor. When the surface is colored in
atomic-colors then it inherits the color from the
nearest atom. On the other hand the mono-colored
surface has a single color, which can be set by
pressing the [Set Surface Monocolor] button.
-
[Optionmenu: Draw Style]
-
Sets the draw-style of the surface (solid, wire,
dot).
-
[Optionmenu: Shade Model]
-
Sets the shade-model of surface (smooth, flat).
-
[Optionmenu: Surface Type]
-
Sets the surface type, which can be either a
Pseuodo-Density or Gap analysis.
The Pseuodo-Density is the type of surface
that was explained above.
It name comes from the fact that these plots look
alike the charge-density plots. On the other hand,
the Gap analysis is available only for
periodic structures. These plots are useful for the
examination of open structures as they really plot
the holes (i.e. vacancies) inside the structure. A
distance Function function is useful for
this purpose, but other functions will do as well.
Here is an example of a Chabazite crystal:
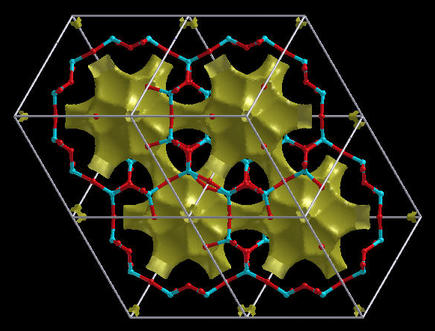
Note: for Gap analysis
the isovalue is not confined to the range
[0,2].
-
[Entries: Isovalue, Cutoff, Resolution, N. of
smoothing steps, Smoothing weight]
-
The isovalue is the value at which the
molecular surface will be tessellated; the
cutoff is the margin around the
bounding-box that embeds the molecule; the
resolution specify the resolution for the
grid calculation - the quality of molecular surface
depends heavily on this parameter. The last two
parameters are for surface-smoothing. This doesn't
work well, but maybe for some cases should produce
a nicer surface.
-
[Button: Set Surface Monocolor]
-
Sets the color of the molecular surface for the
monocolor scheme.
-
[Checkbutton: Surface transparency]
-
Toggles the transparency of the surface
-
[Button: Close]
-
Closes the Molecular Surface Settings
window.
-
[Button: Update]
-
Important: this button should be pressed to
load new setting and update the surface display
The animation can be controlled by the
Animation Control Center window, which is
accessible via
Modify-->Animation Settings
.
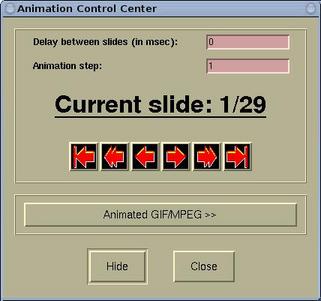
On this window we can set the delay (in
msec) between slides, the animation step, and there are
the playing buttons (from left to right:
to the
first, animate backward, one step back, one step
forward, animate forward, and
to the
last).
To enhance the performance of the animation we can
either switch to Lighting-Off mode or reduce
the tessellation factor.
The [Hide] button hides the Animation
Control Center window. Hiding means that window
is iconified, i.e. the window disappears and its icon
appears on XCrySDen main render
window. By mouse-cliking the icon the window will
appear again.
The [Animated GIF/MPEG >>] button is
enabled only when the GIF and/or MPEG encoders are
defined in the the $HOME/.xcrysden/custom-definitions
file. By pressing this button, new information will
appear on the window aimed at creating animated-GIF
and MPEG movies. Read More
...
The number of displayed crystal unit cells can be
set via
Modify-->Number
of Units Drawn menu, where we simply
specify the number of unit cells to be drawn in each
crystallographic direction.
BEWARE: don't specify to large numbers, for
example 10x10x10, since it will either take a long
time to render the crystal or the program will run
out of memory.


![[Figure]](img/xcrysden-picture-small-new.jpg)