The Results are in!
 See the Survey (193 kb PDF) |
 View the Poster (2.2 Mb PDF) |
 Read the Proceedings (258 kb PDF) |
[Summary of Results] [Demographics] [Responses]
[Our Favorite Quotes] [For Further Reference]
Summary of Major Results
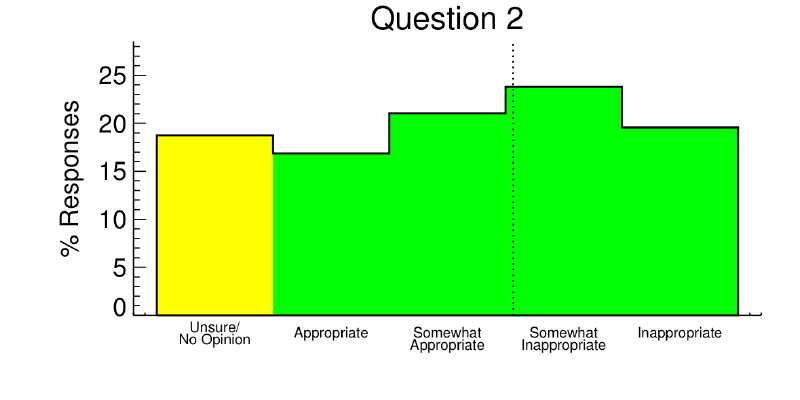
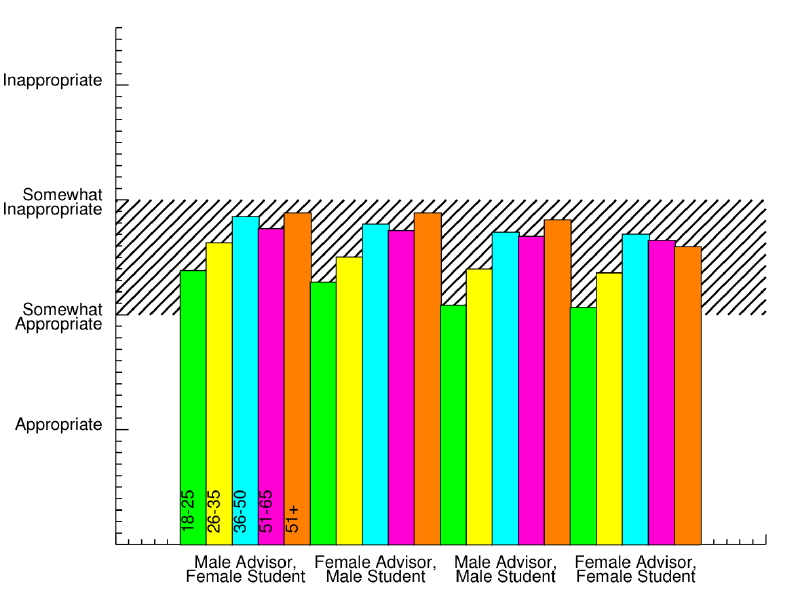
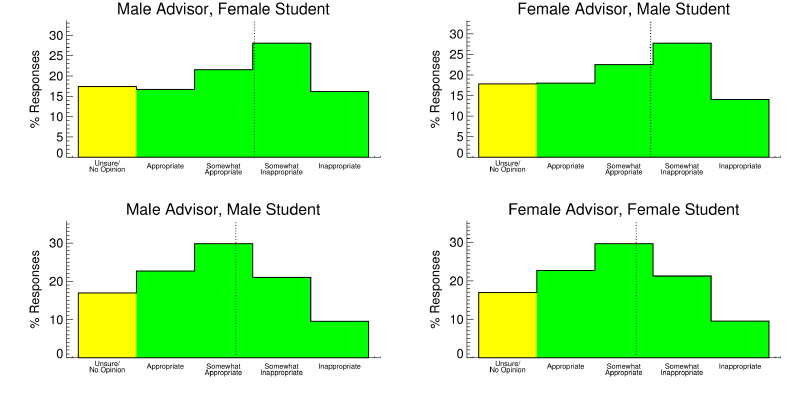
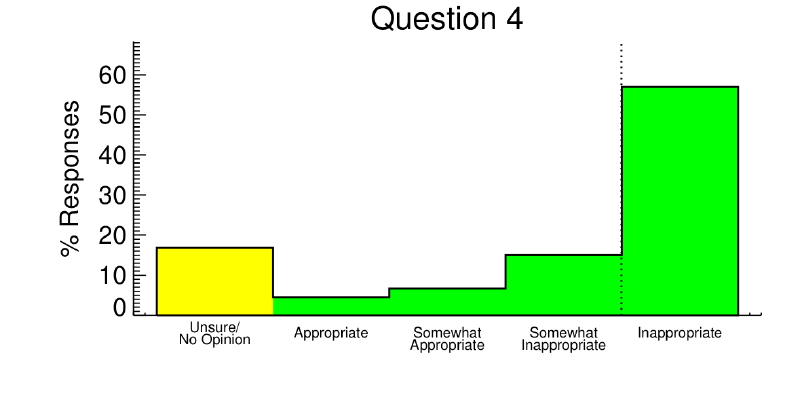
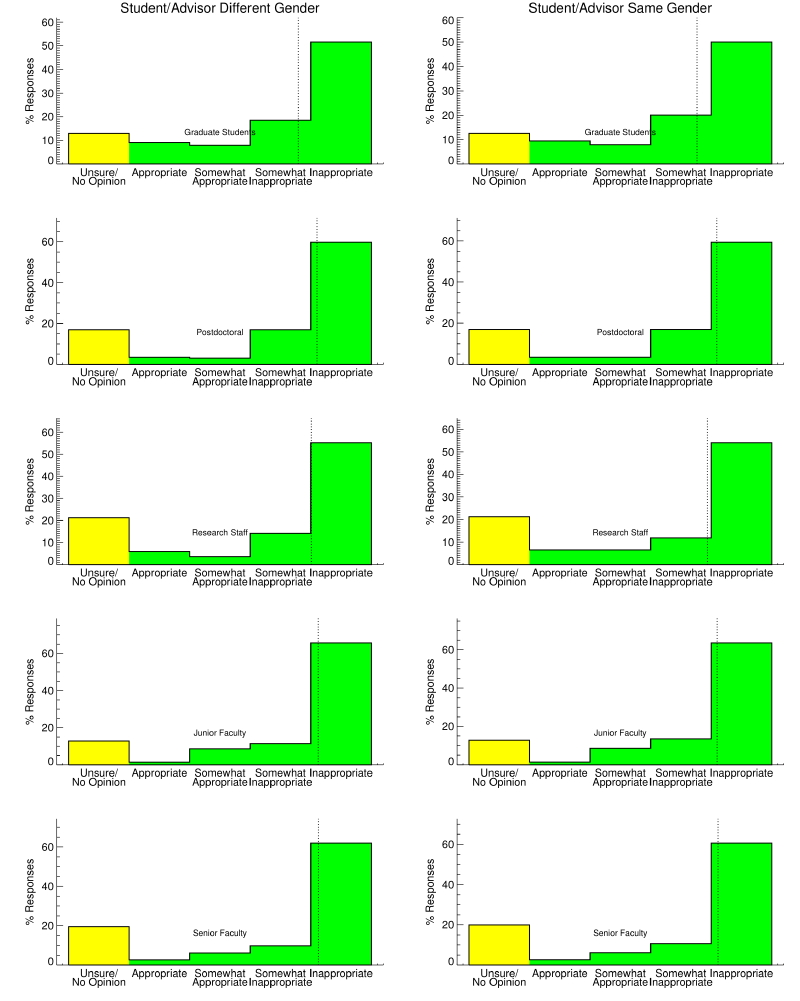
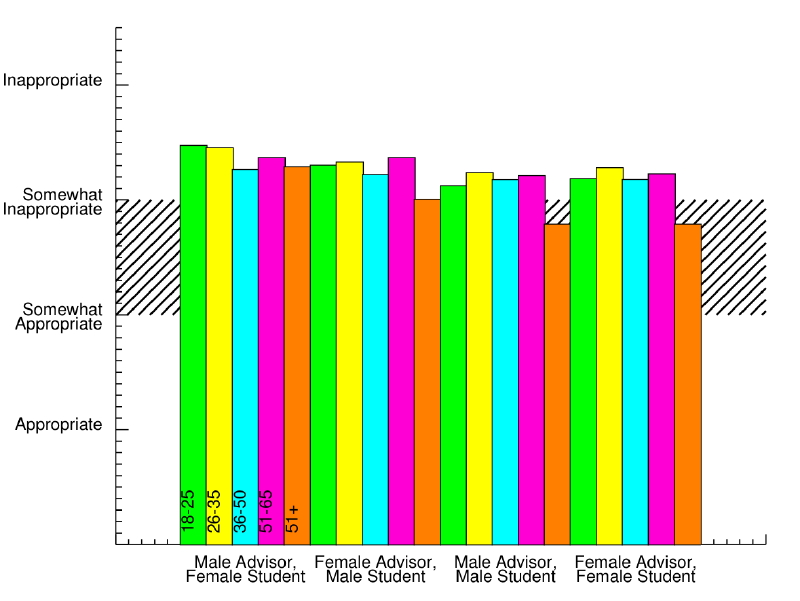
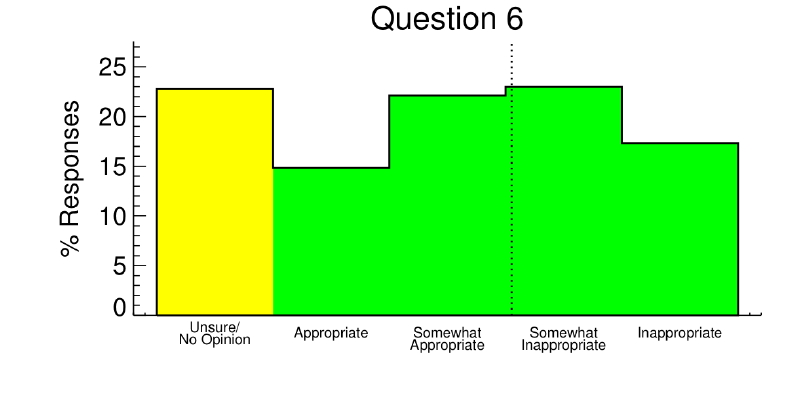
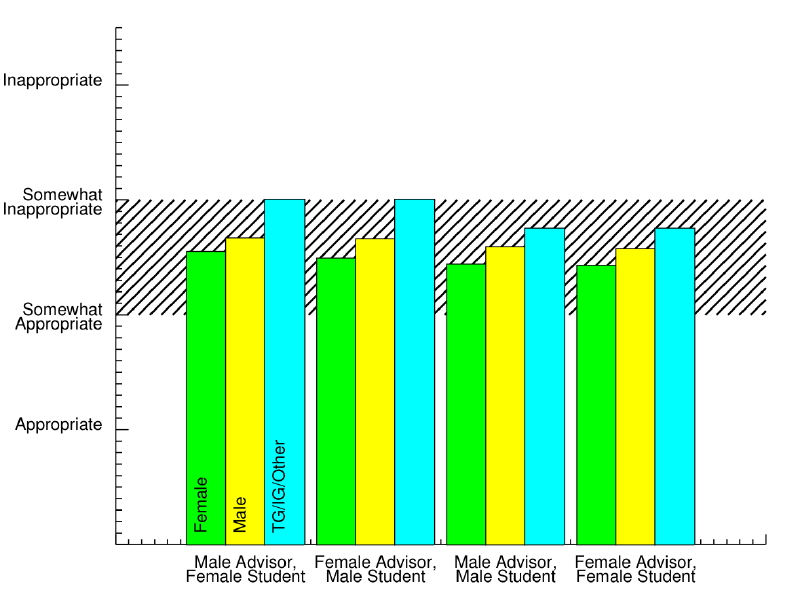
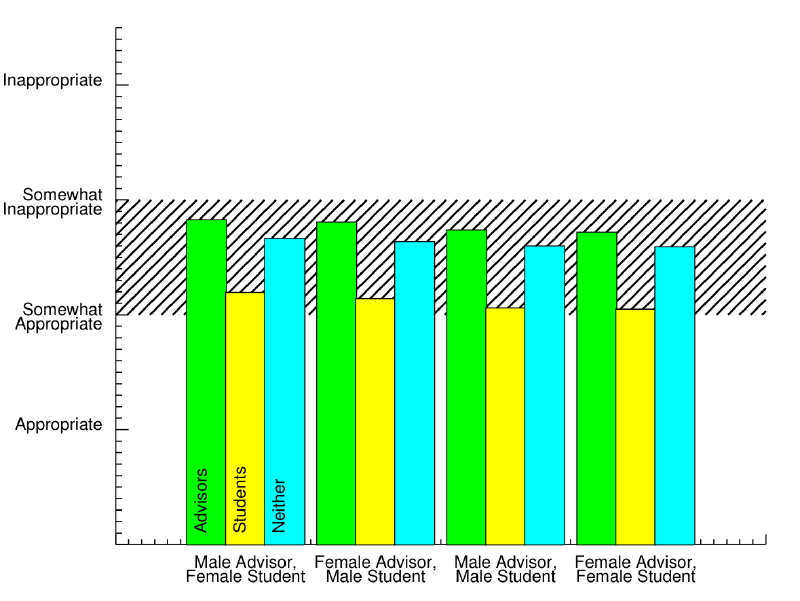
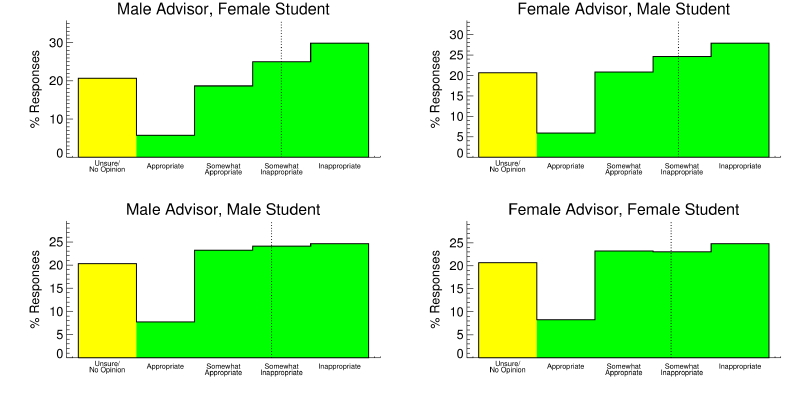
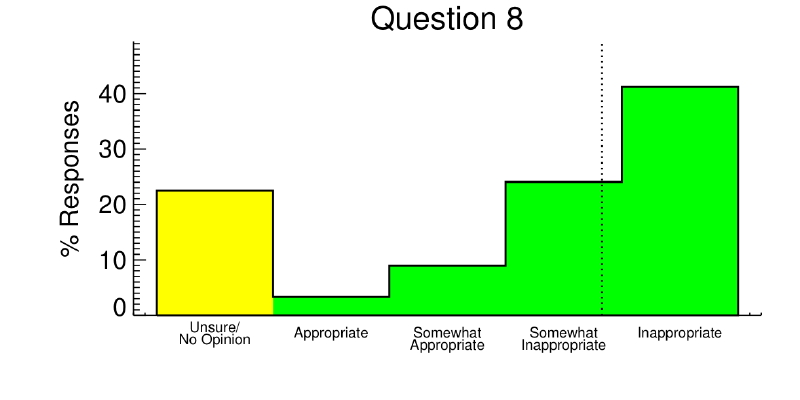
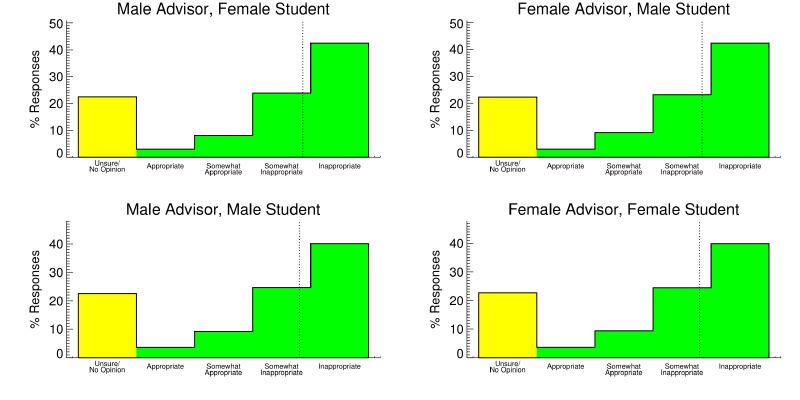
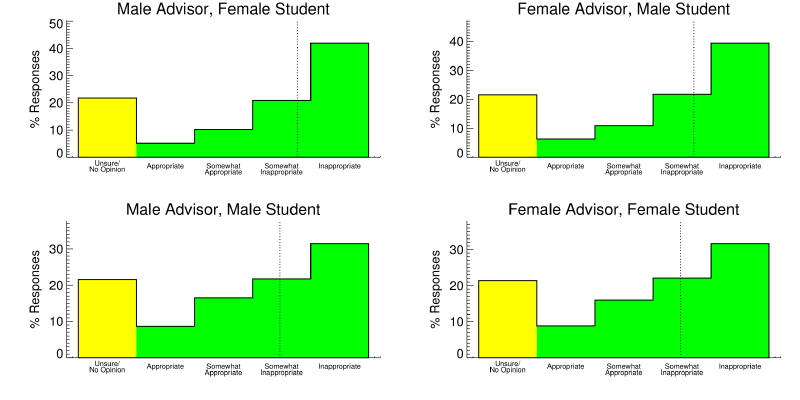
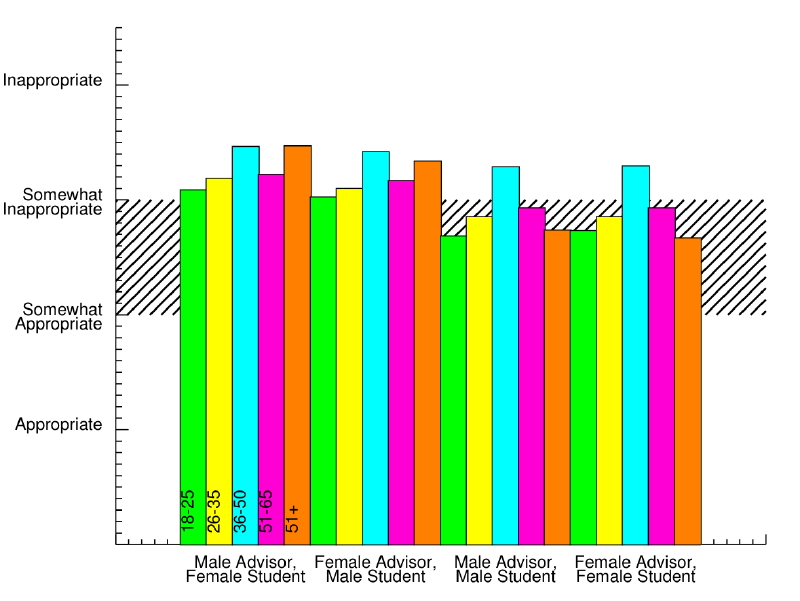
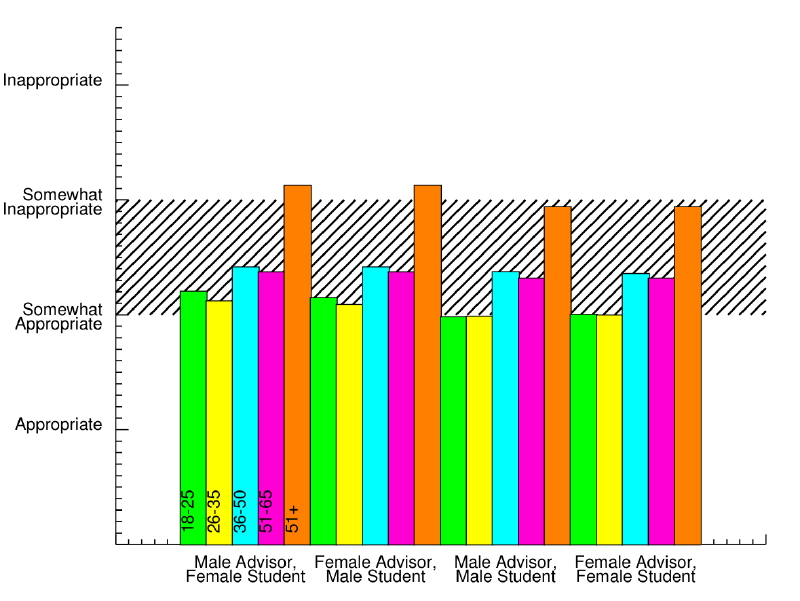
- Perceptions of appropriateness vary considerably in the astronomical community at all levels, even for situations that might be deemed "obvious".
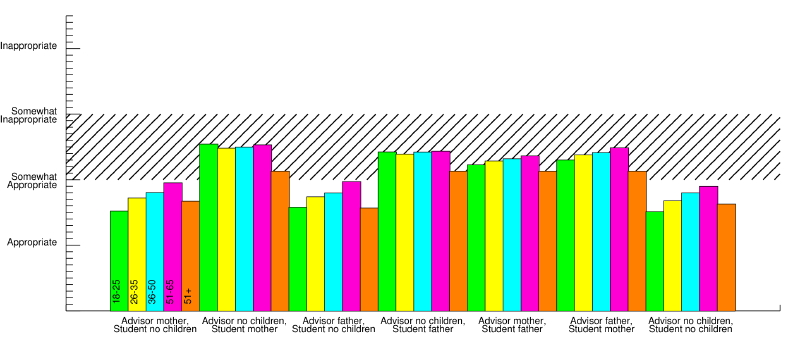
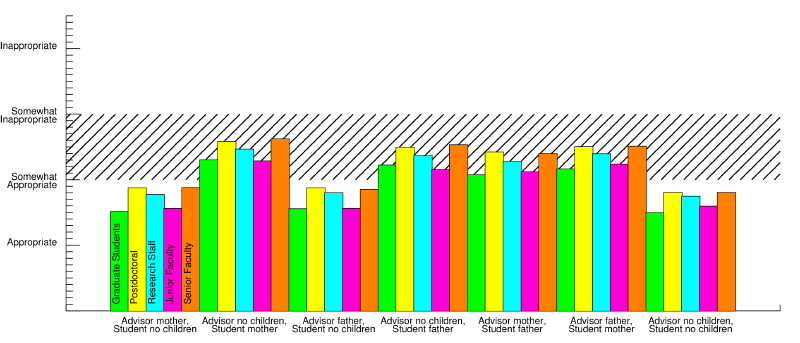
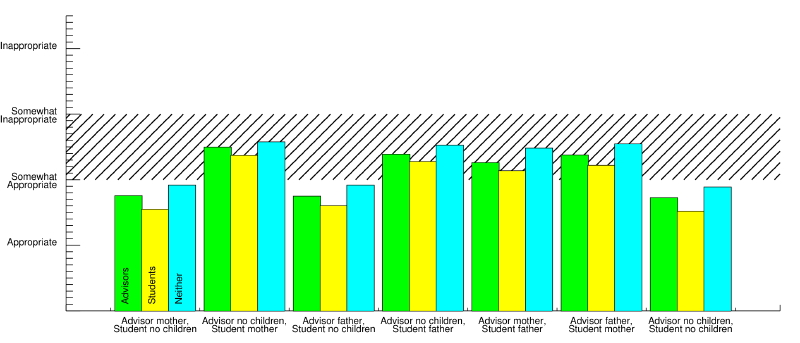
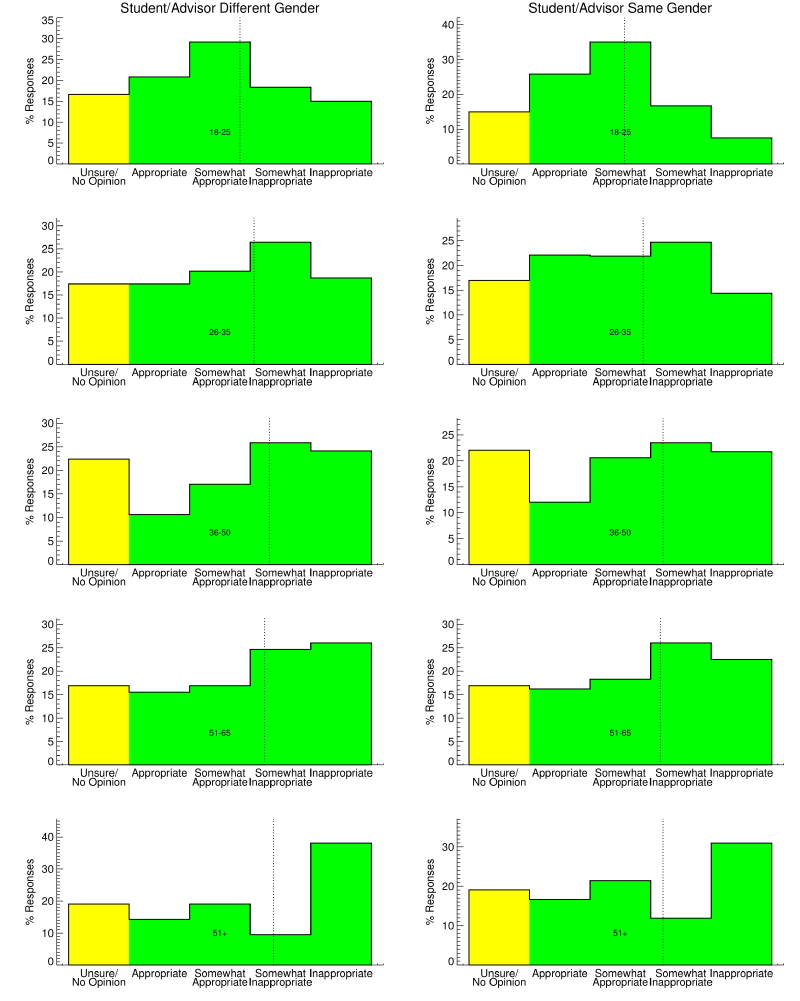
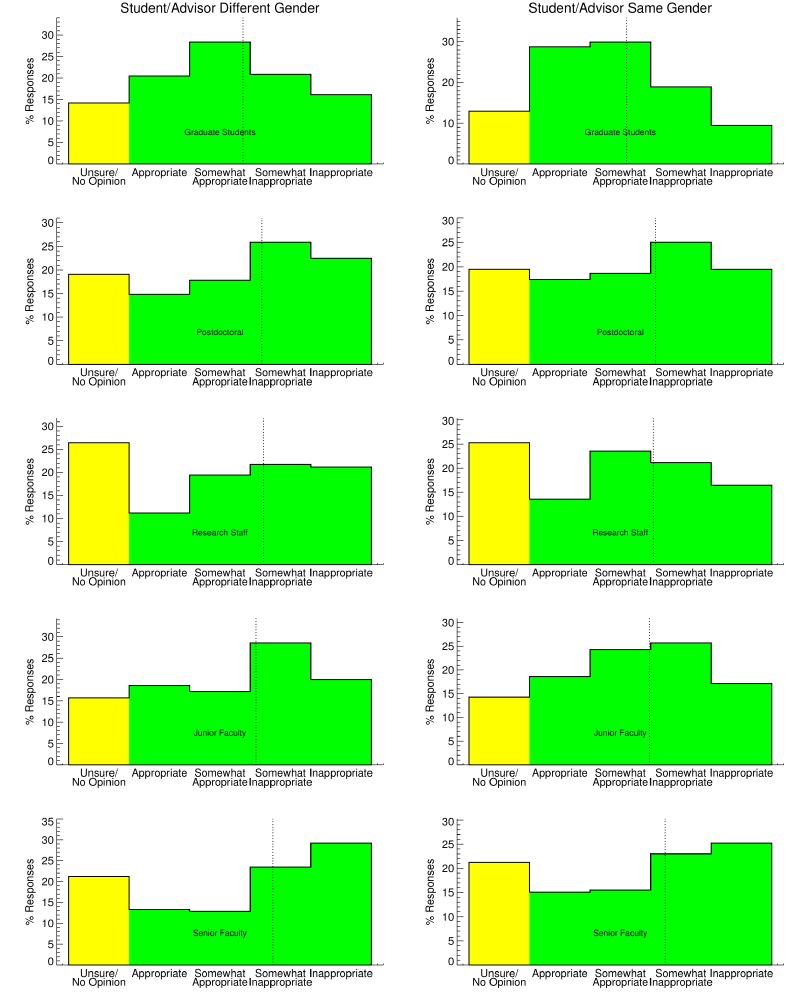
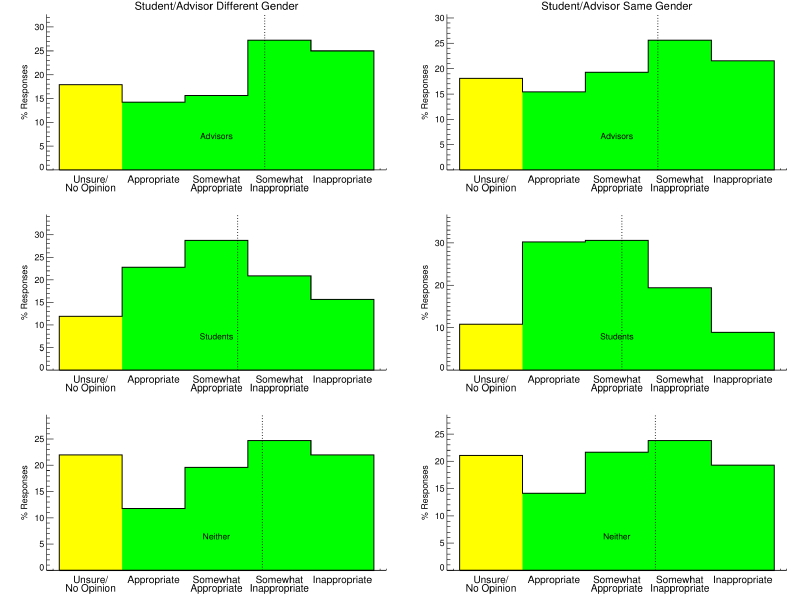
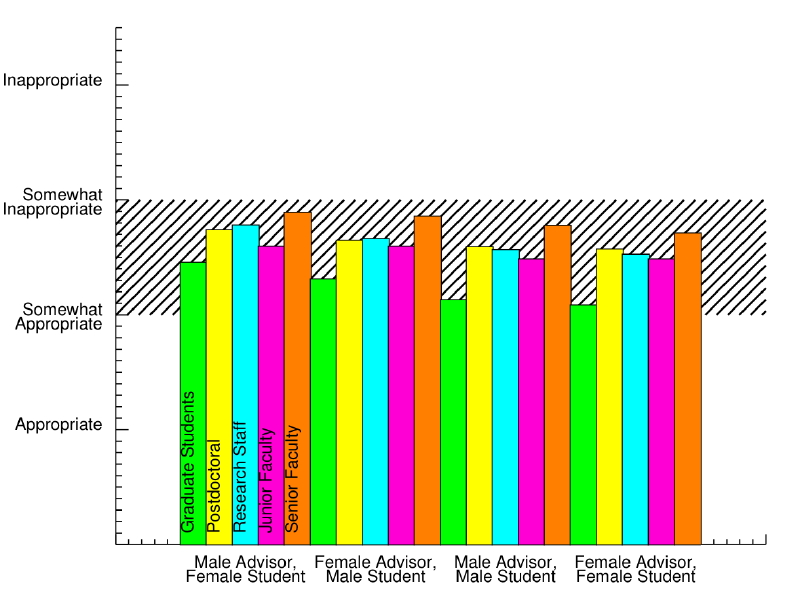
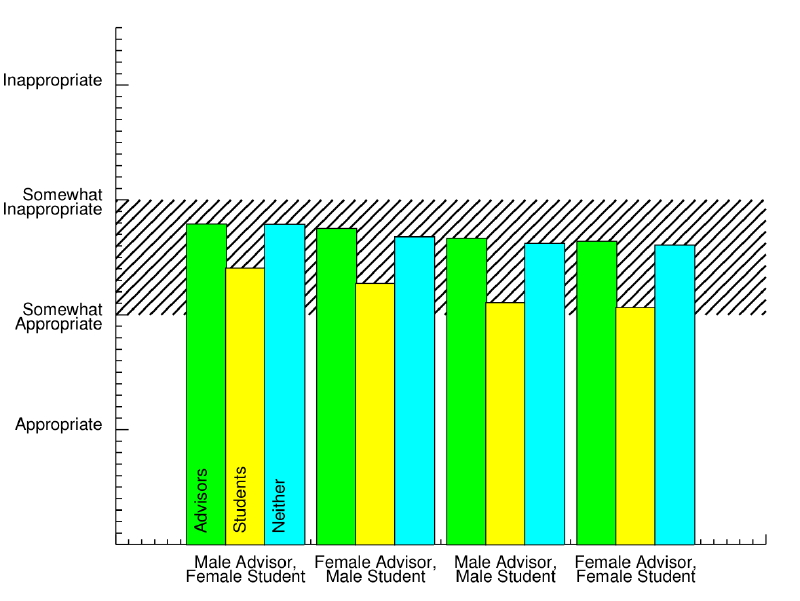
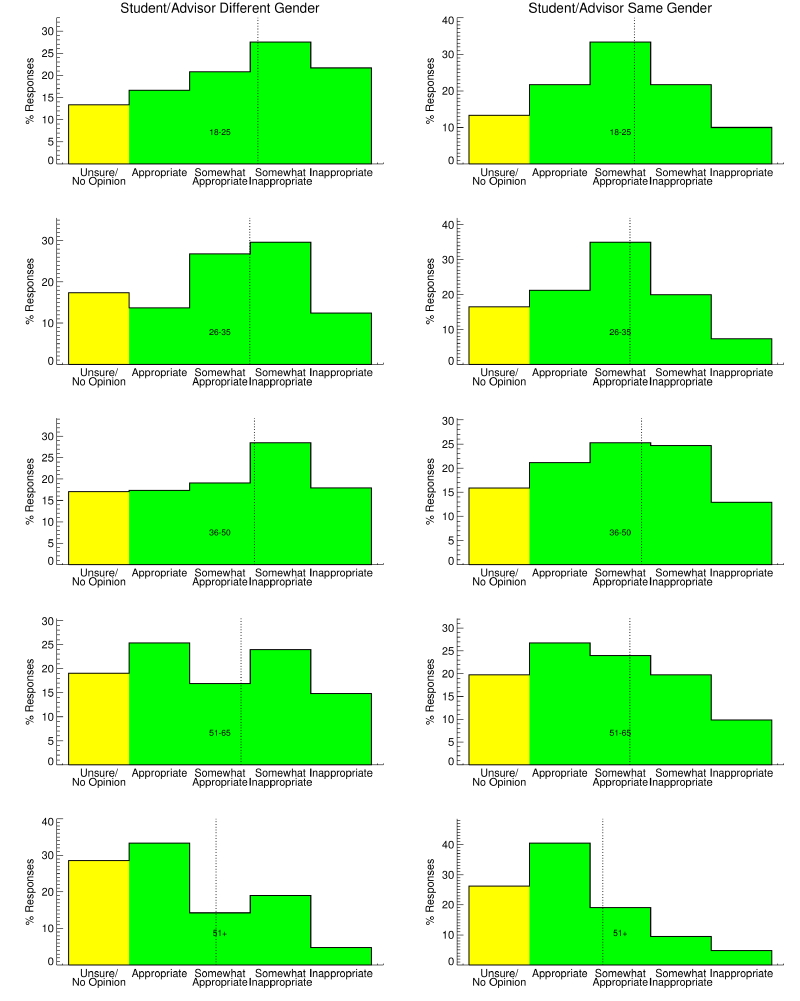
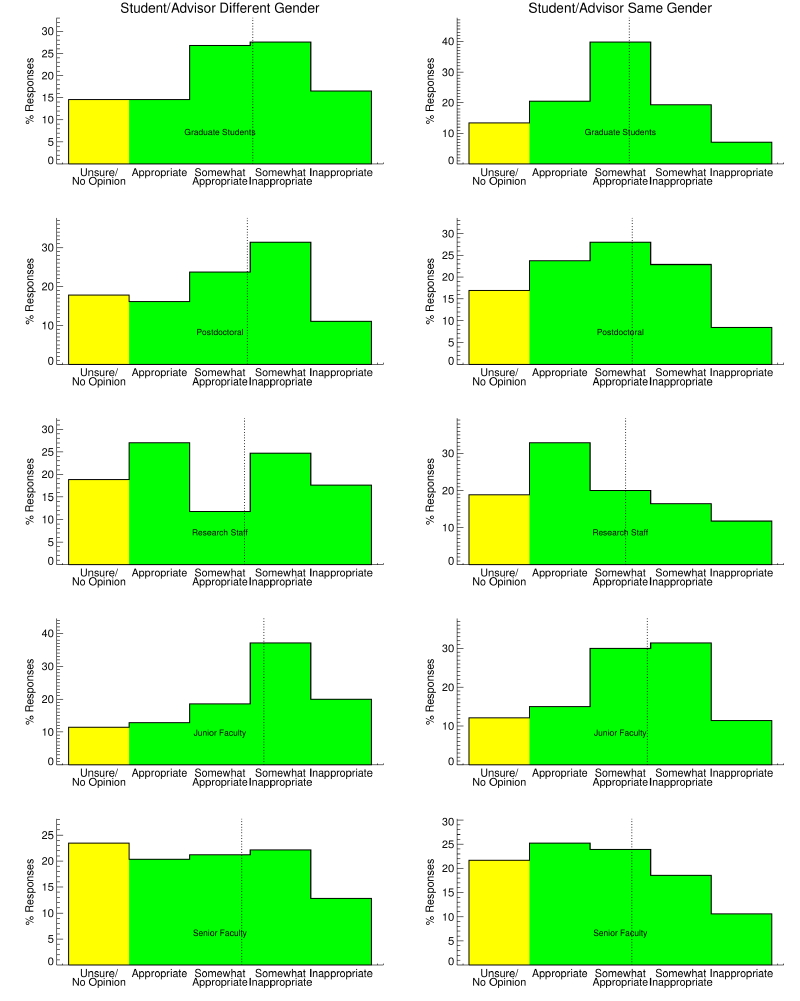
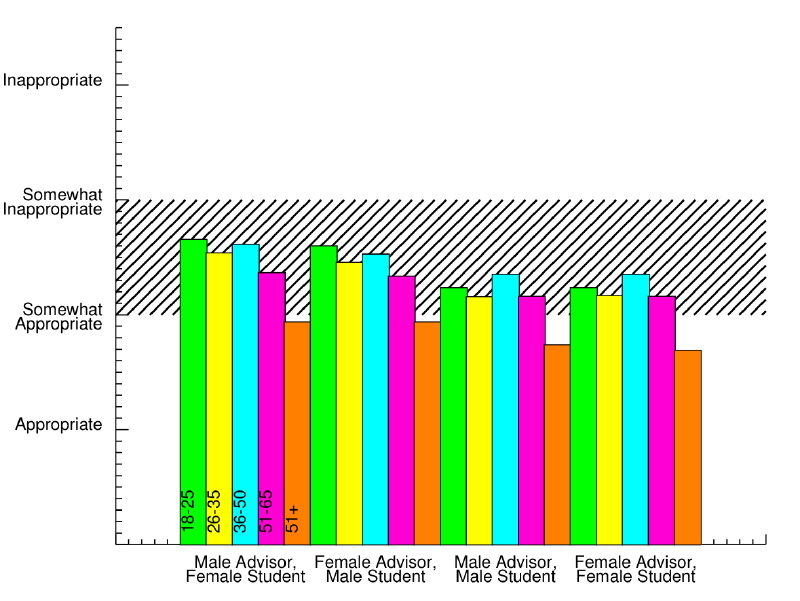
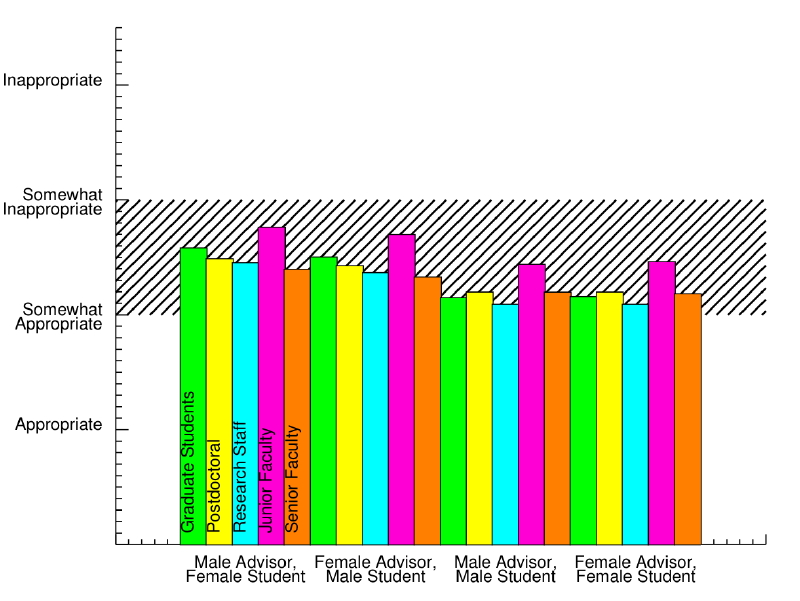
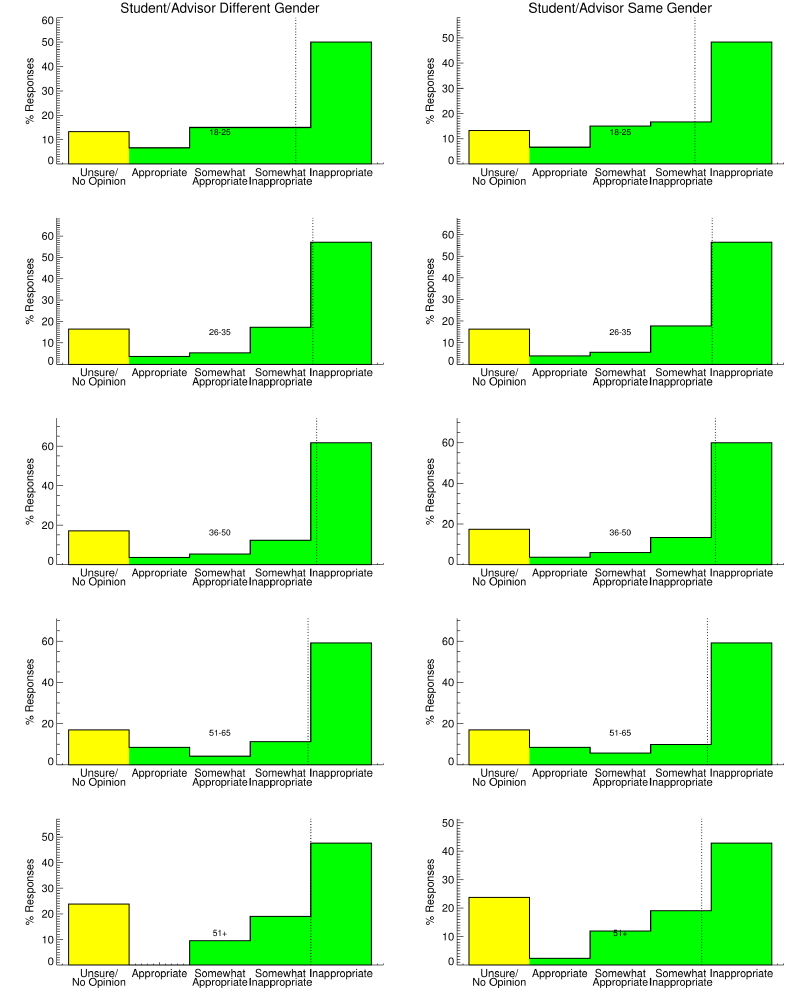
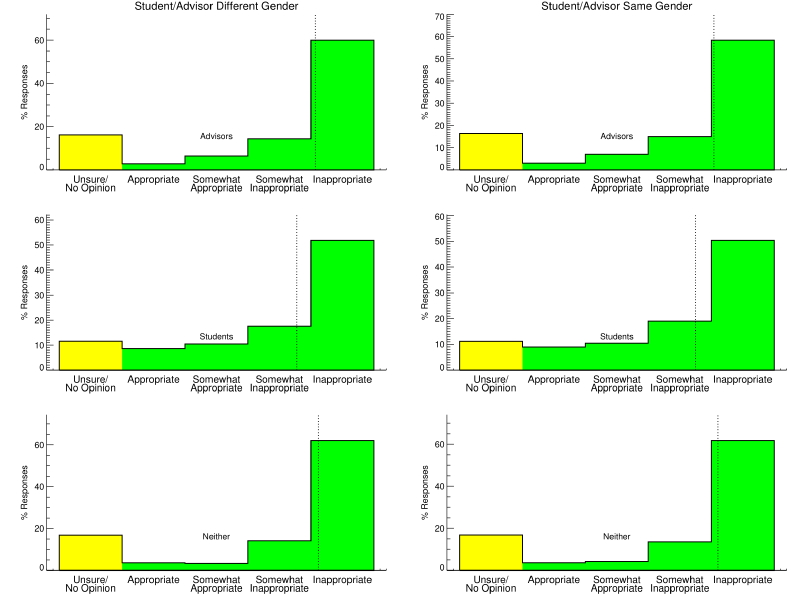
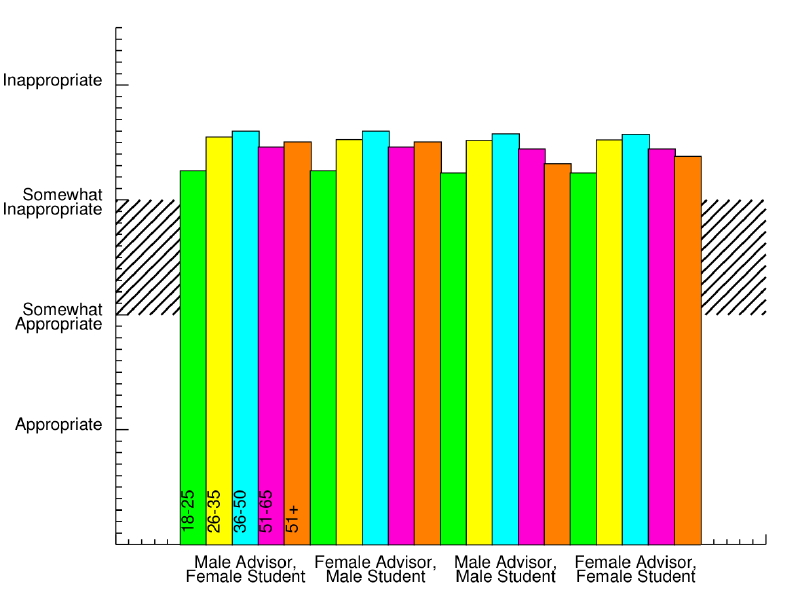
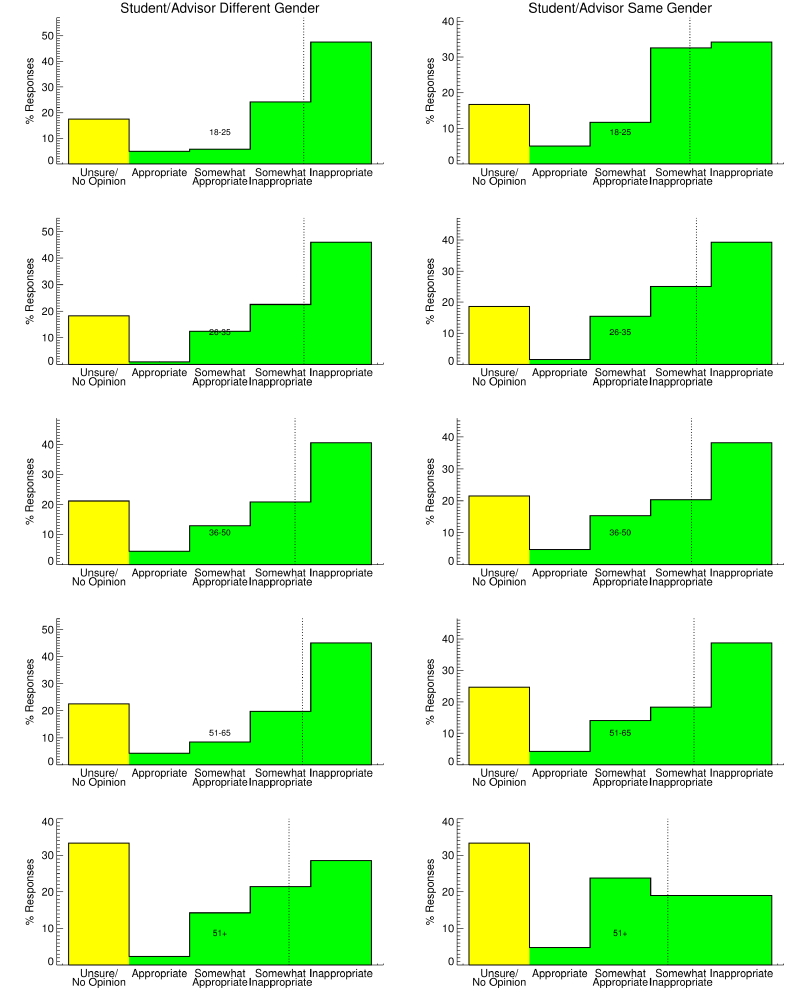
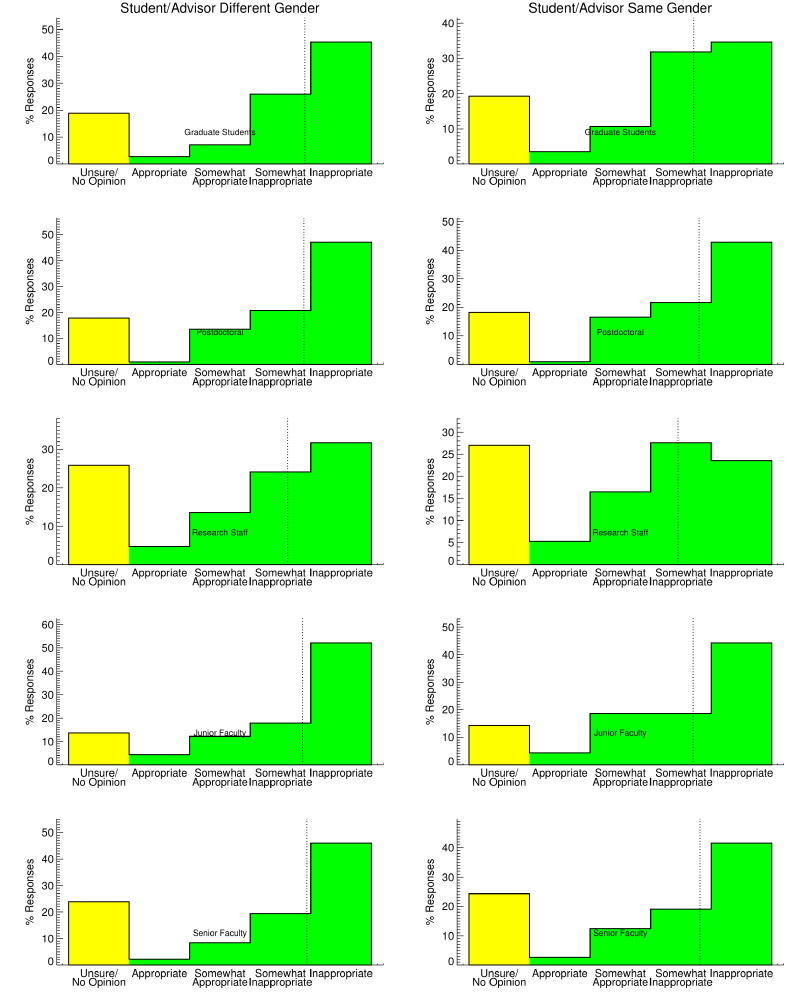
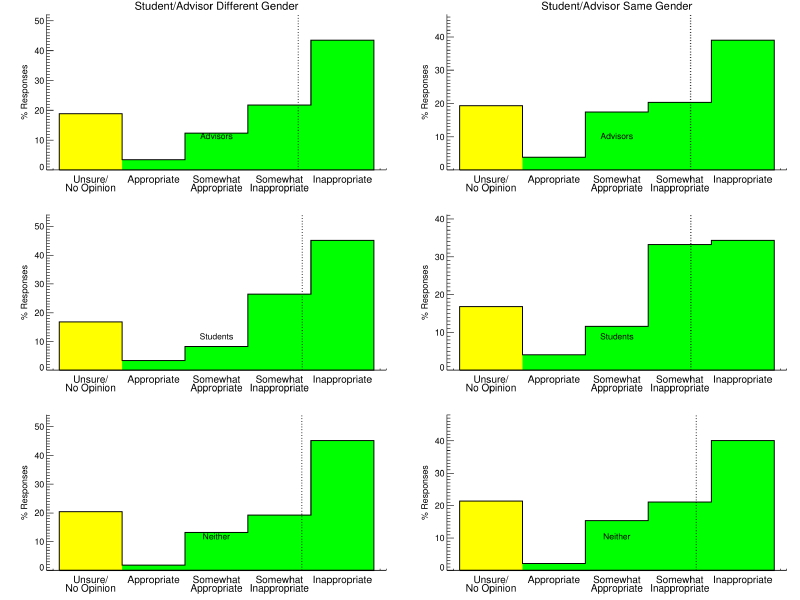
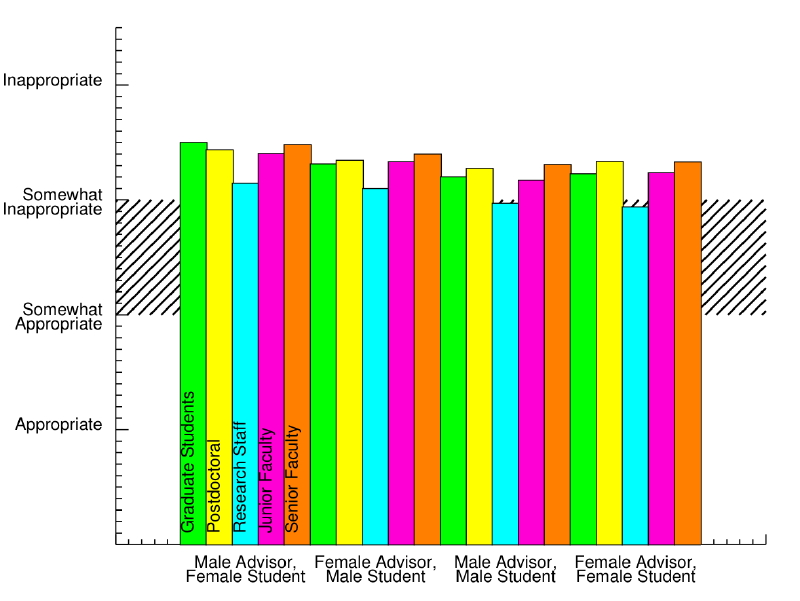
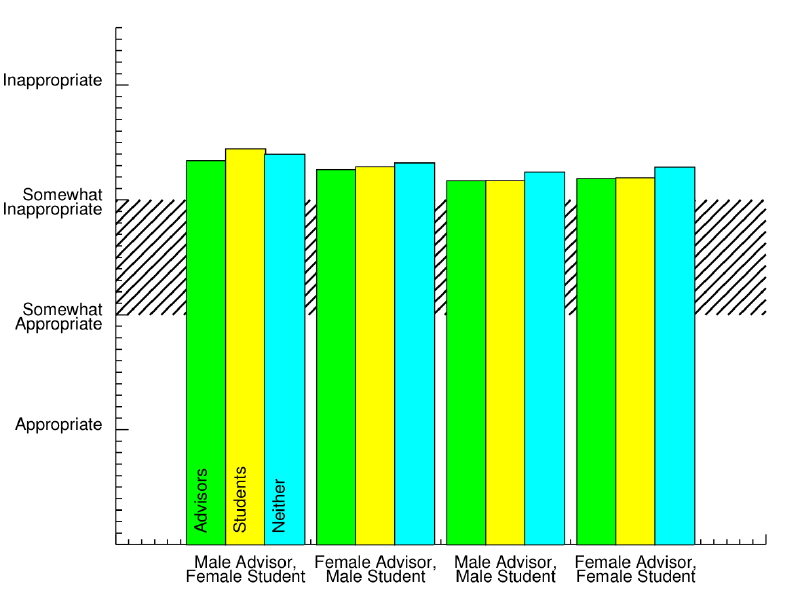
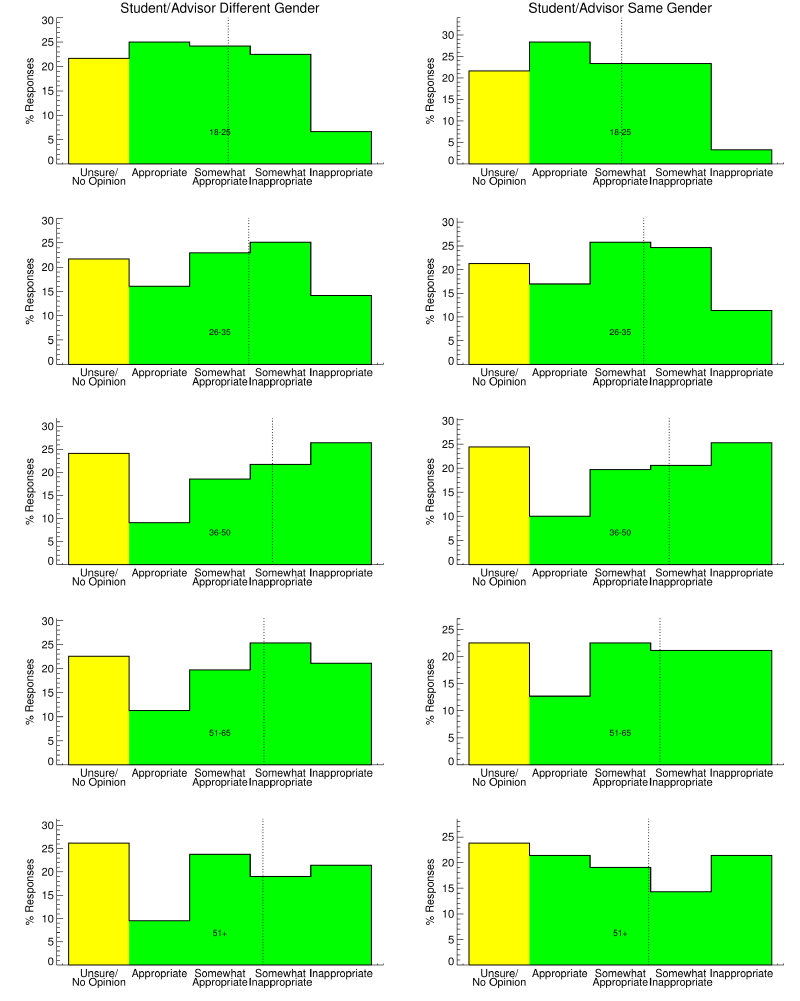
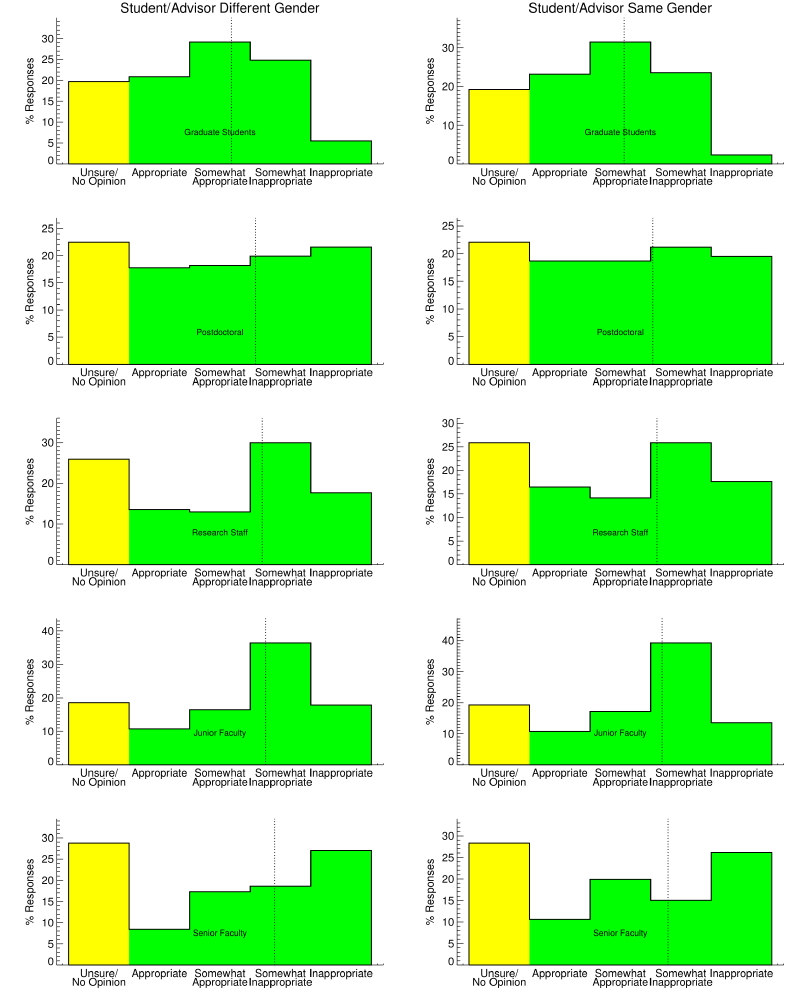
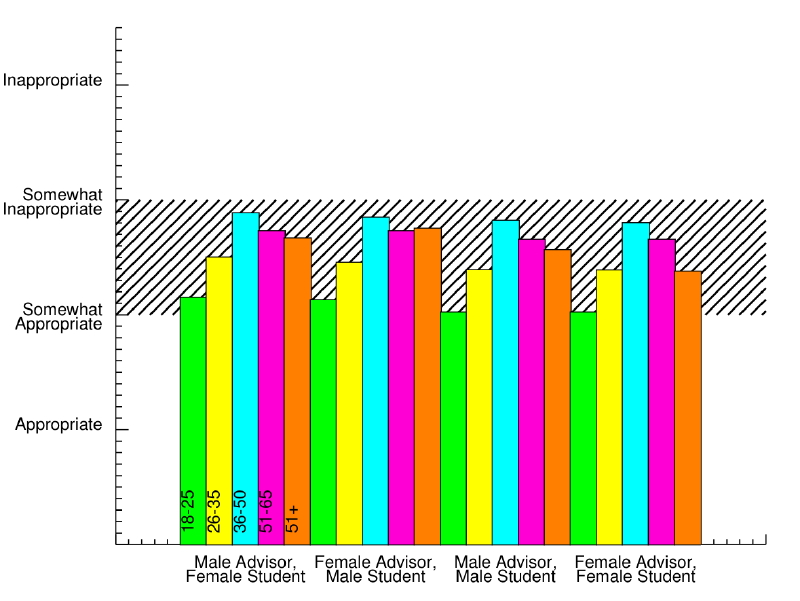
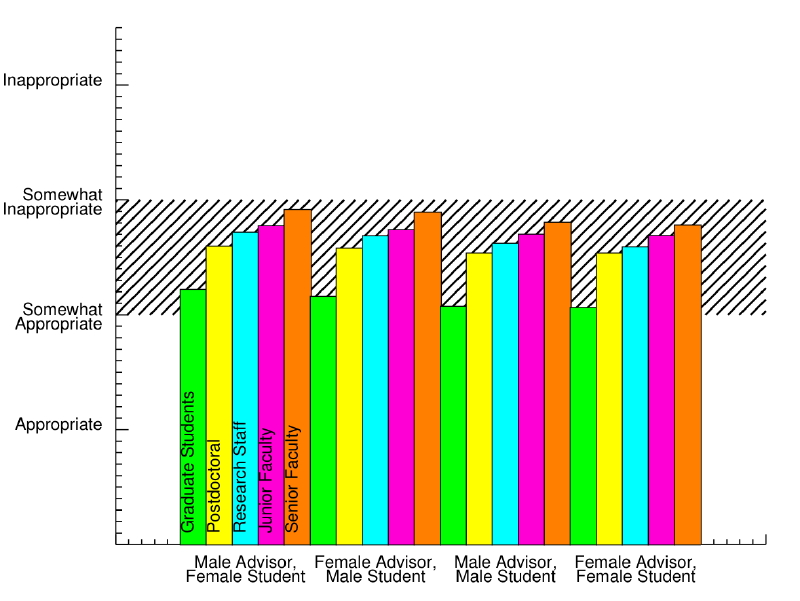
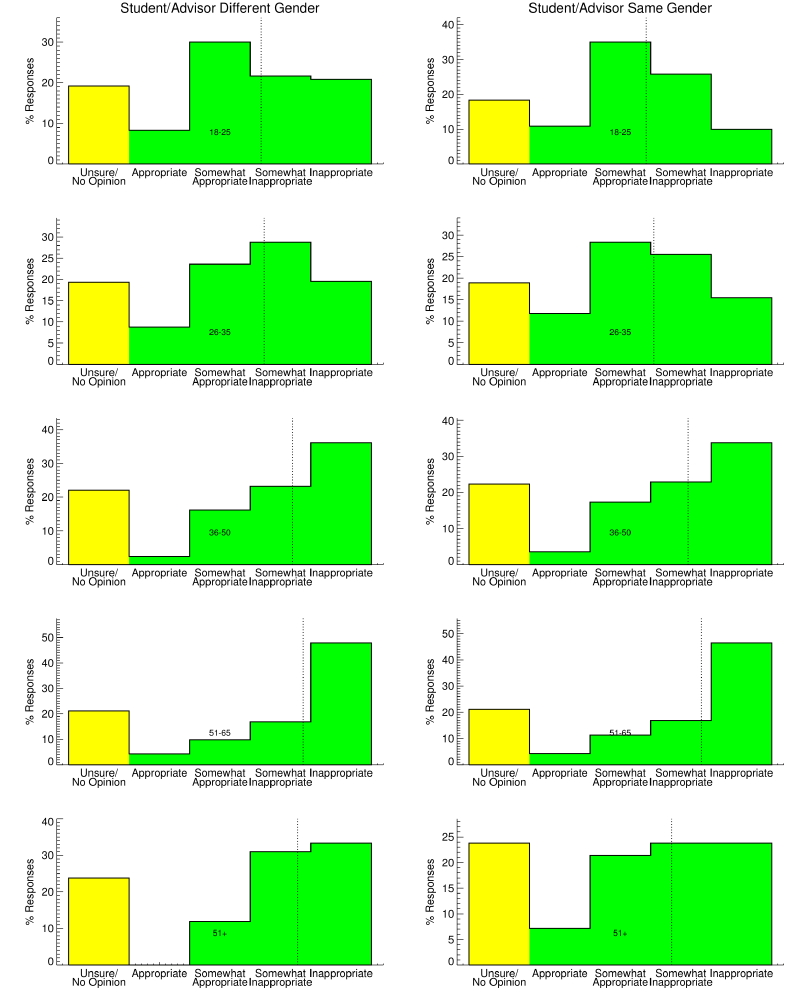
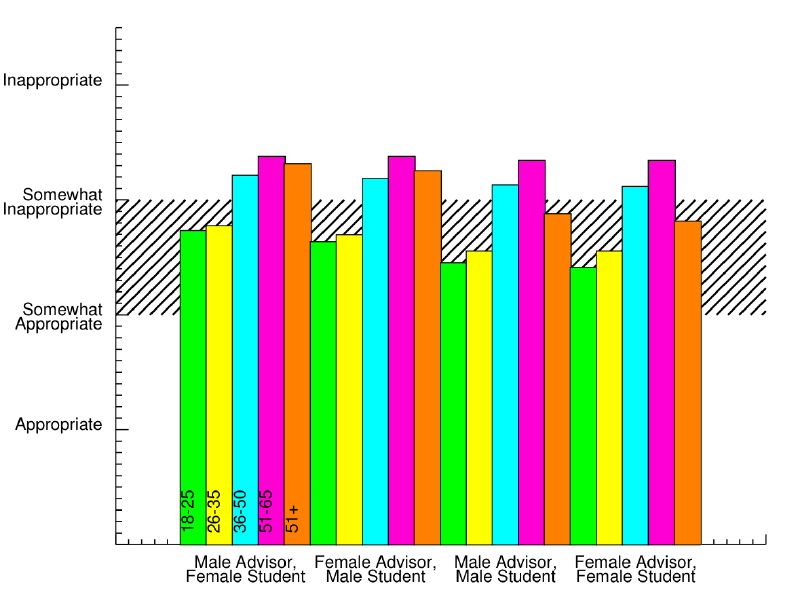
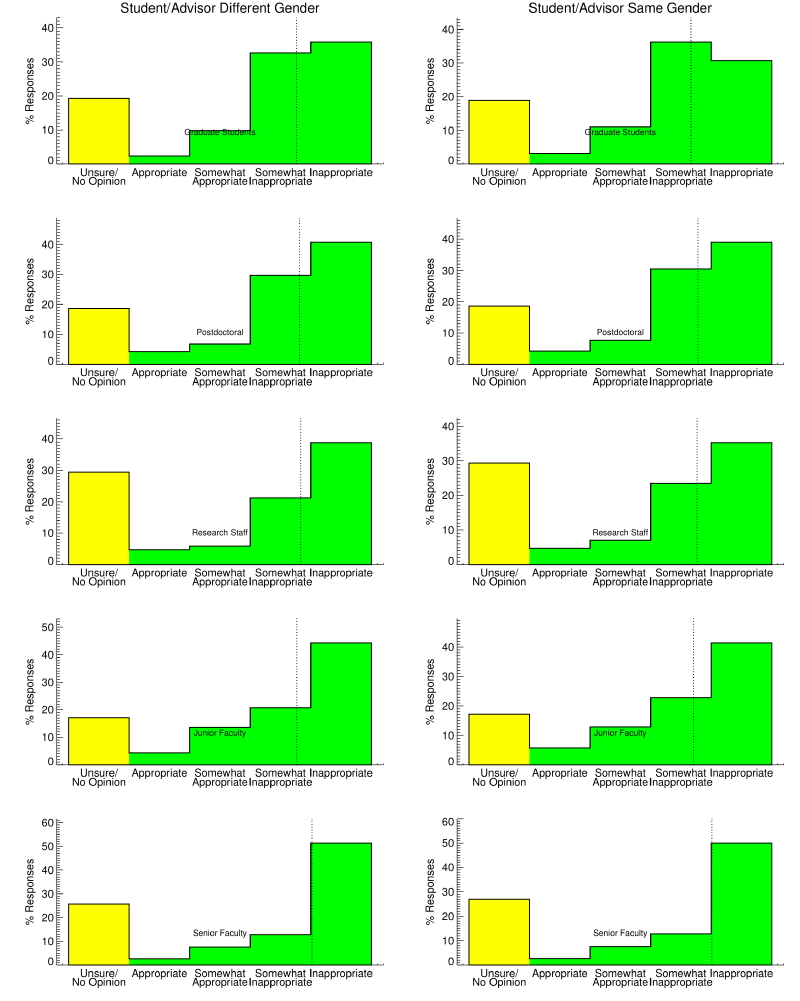
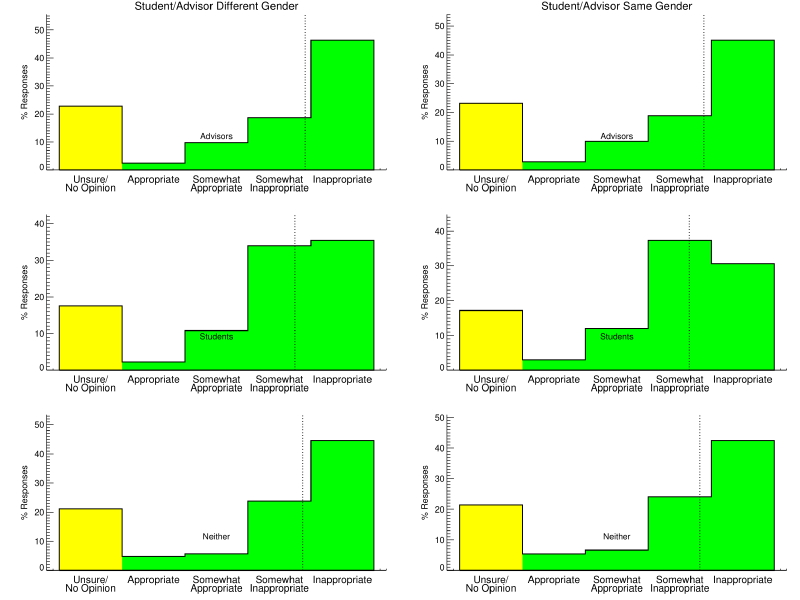
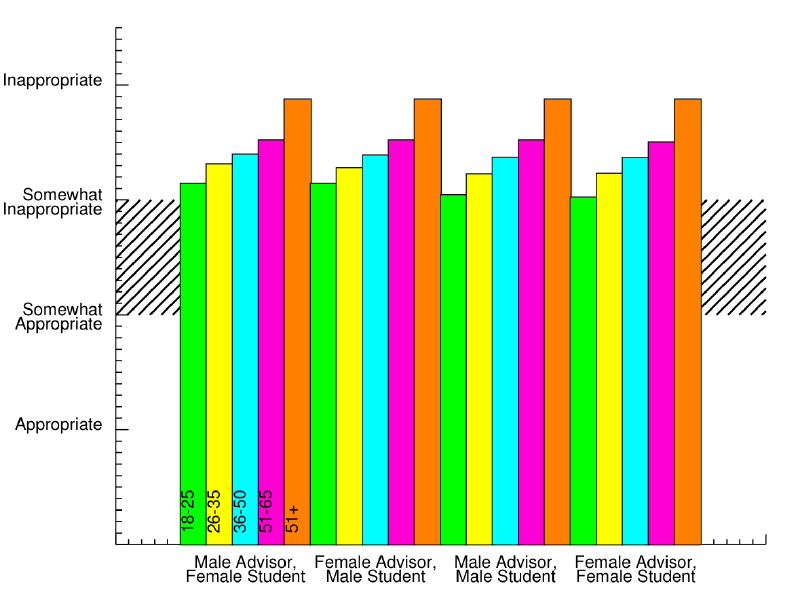
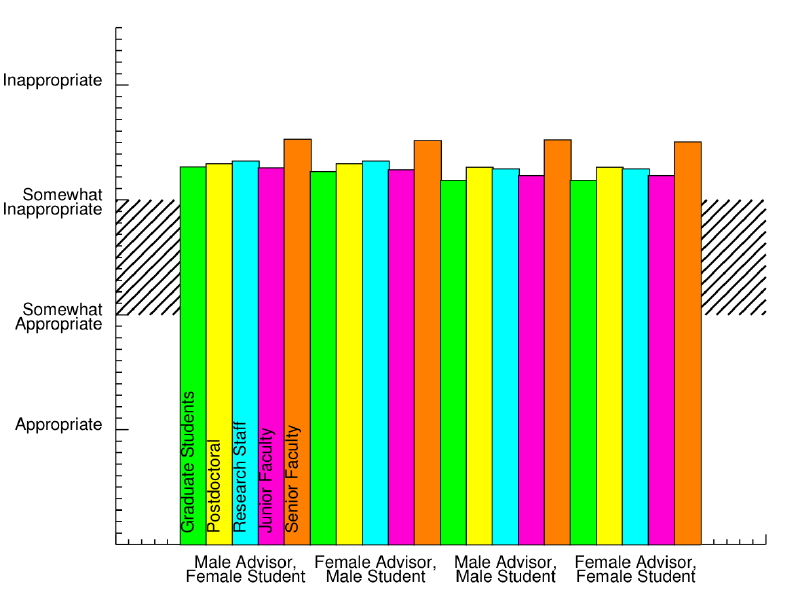
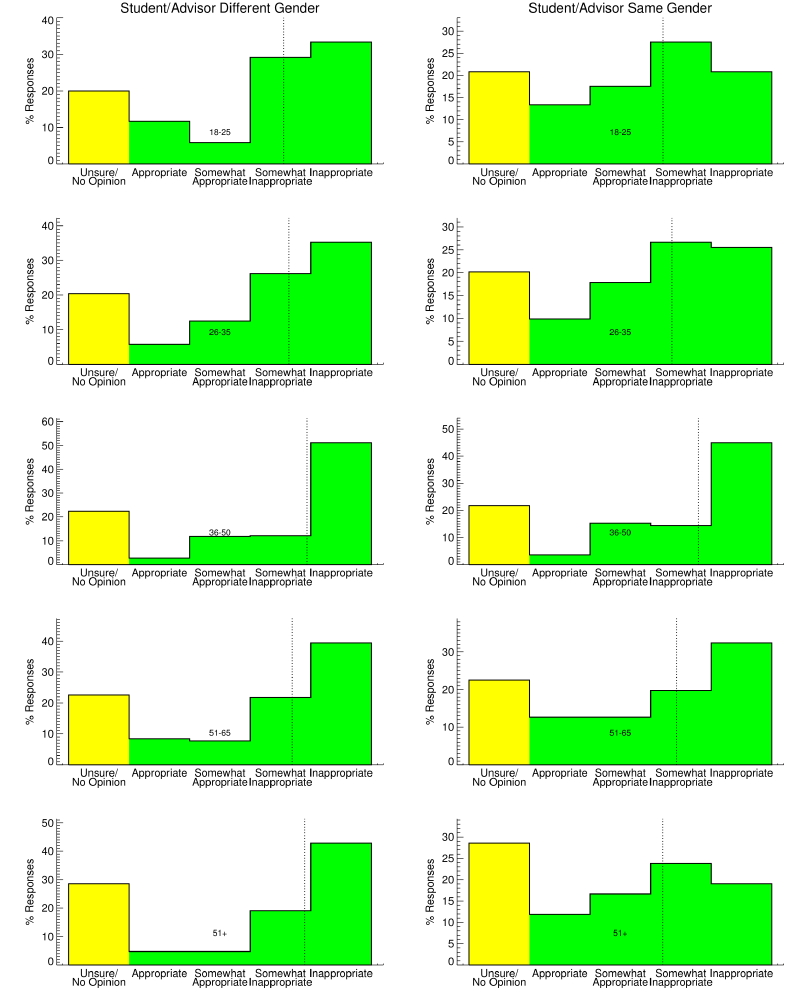
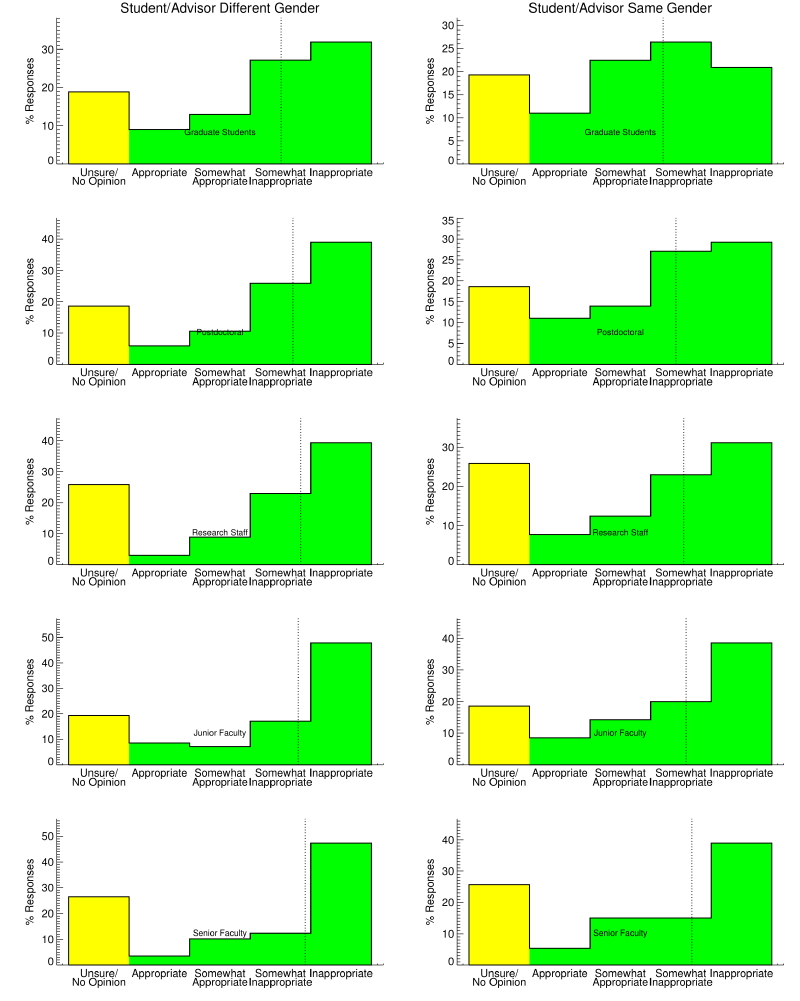
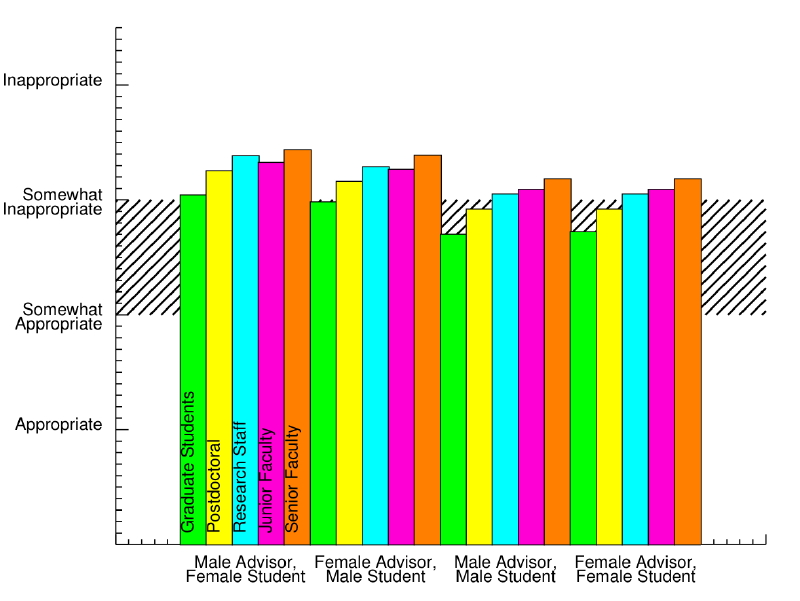
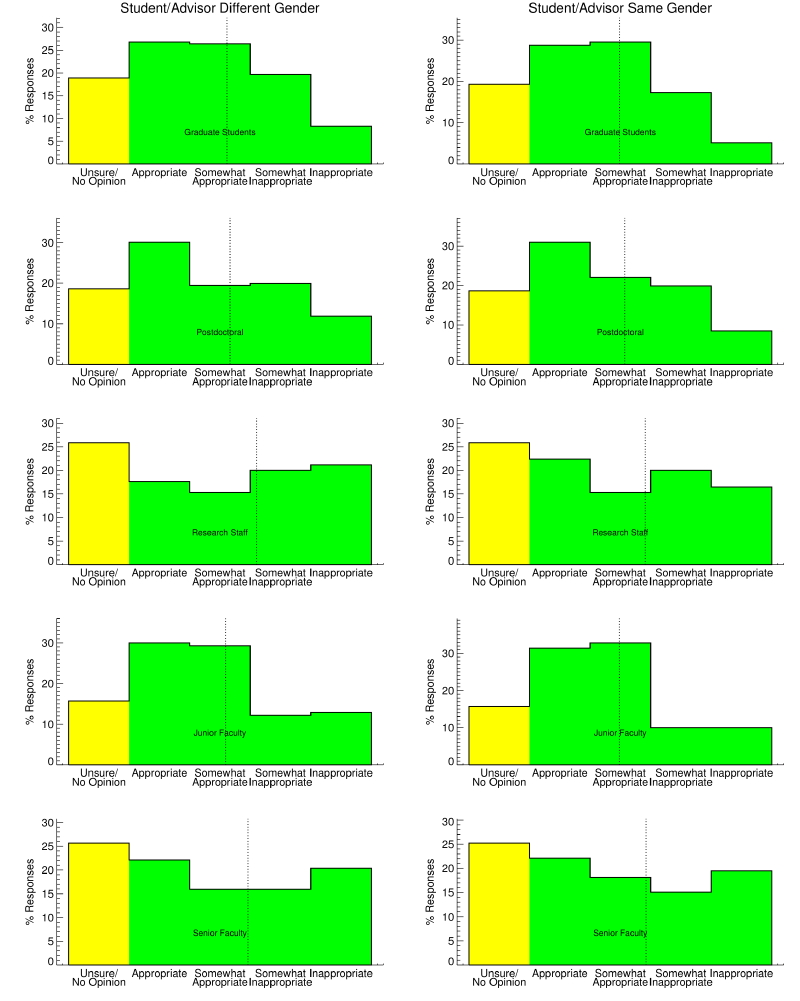
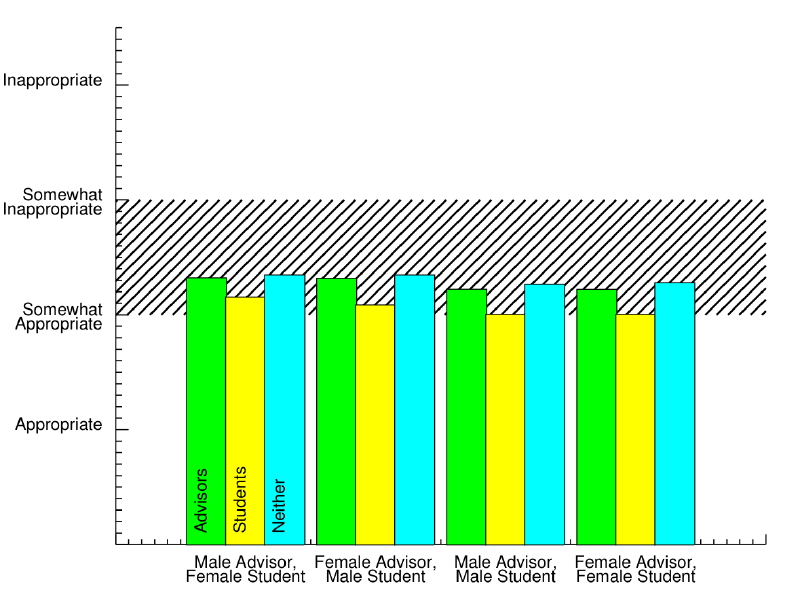
- Perceptions of appropriateness vary with age and professional status, with younger astronomers and those at earlier stages in their careers (students, postdocs) typically viewing behaviors as more appropriate. In particular, there were frequently differences in perceptions of appropriateness between students and advisors.
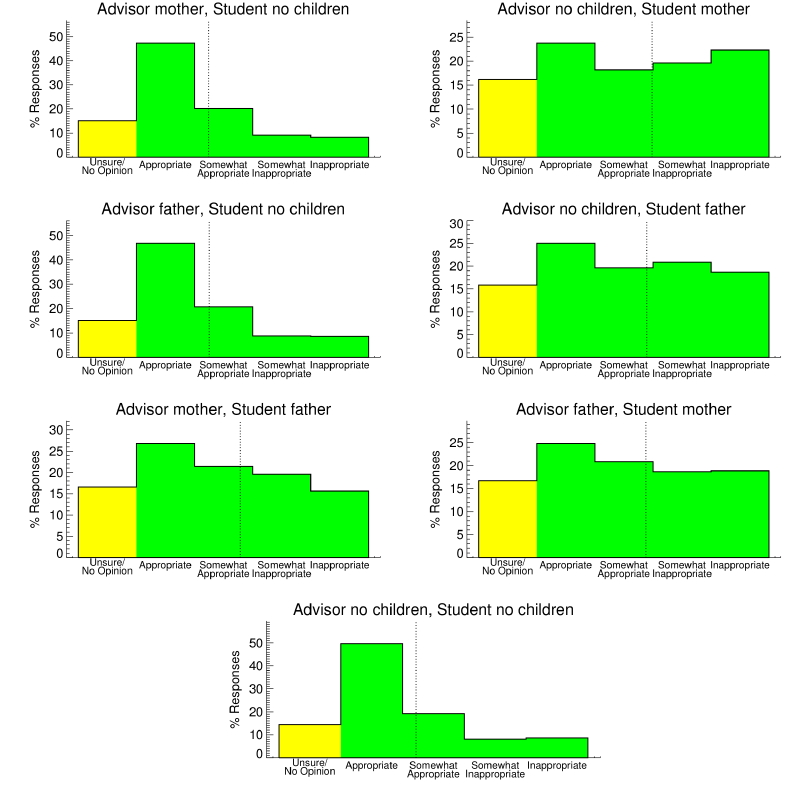
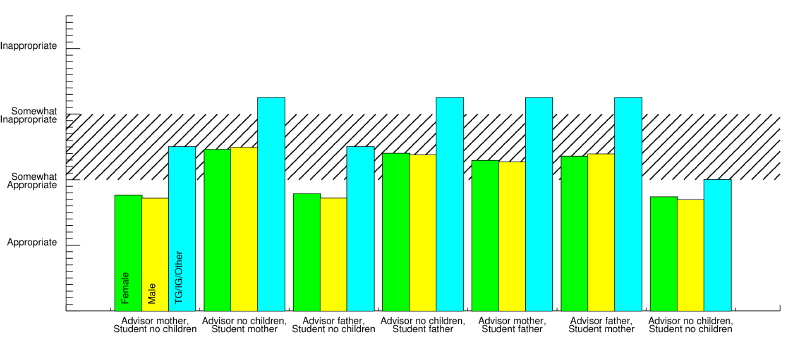
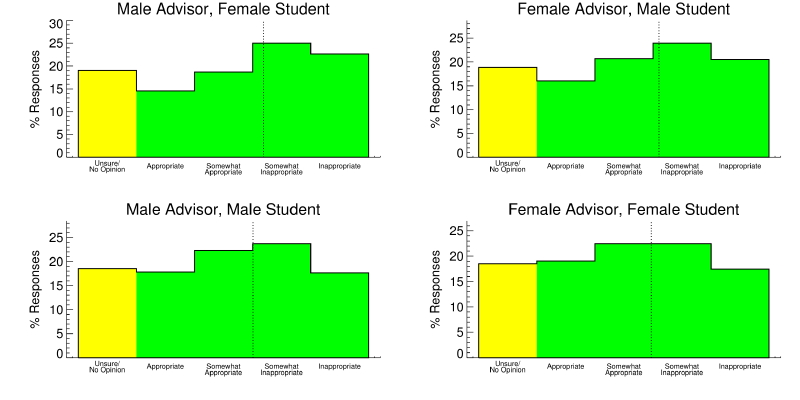
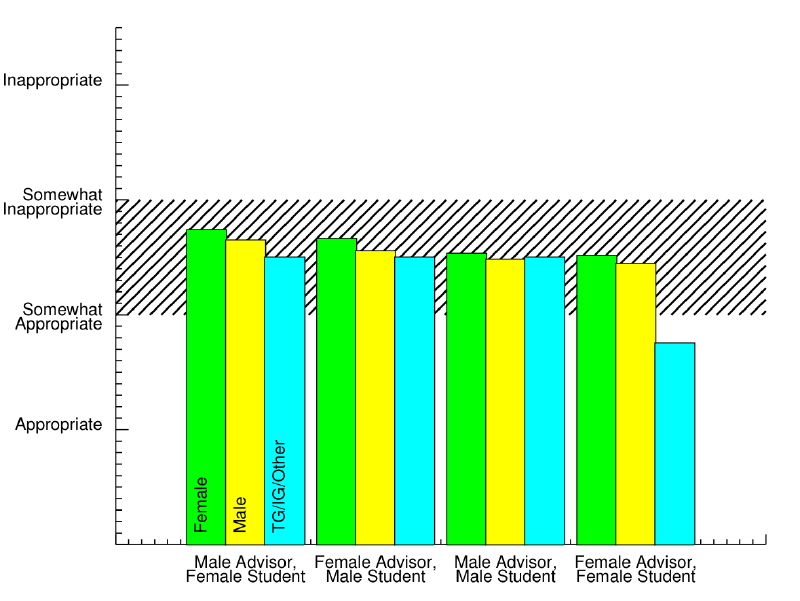
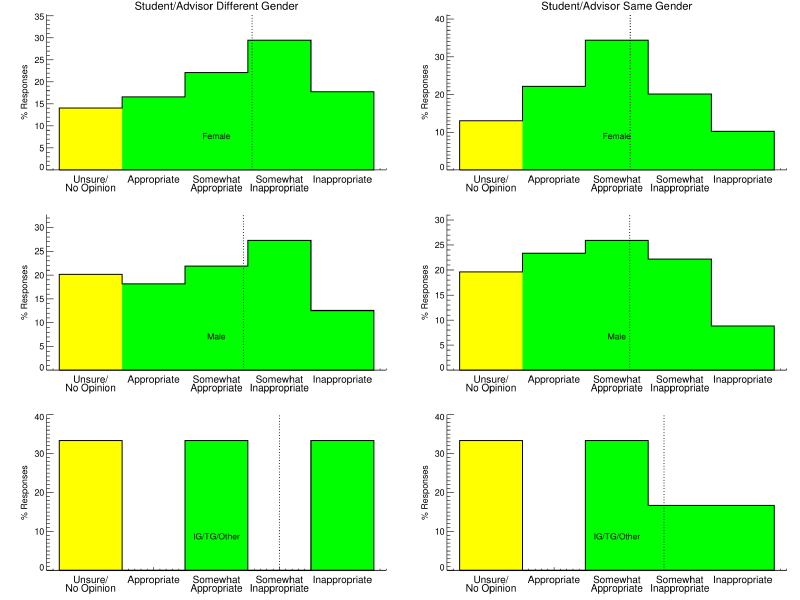
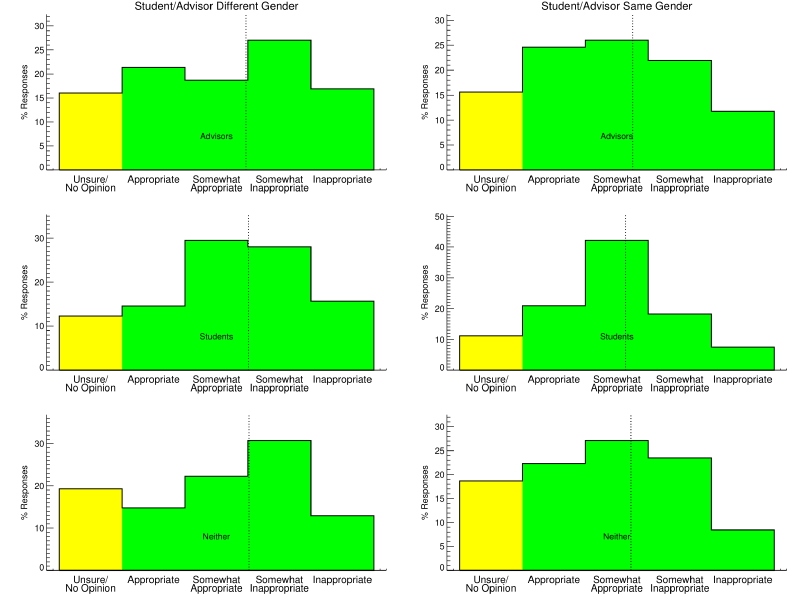
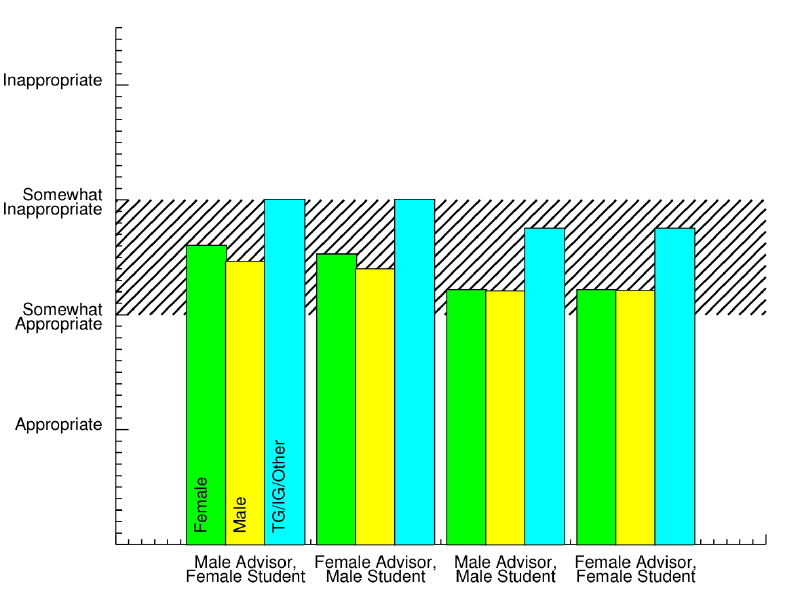
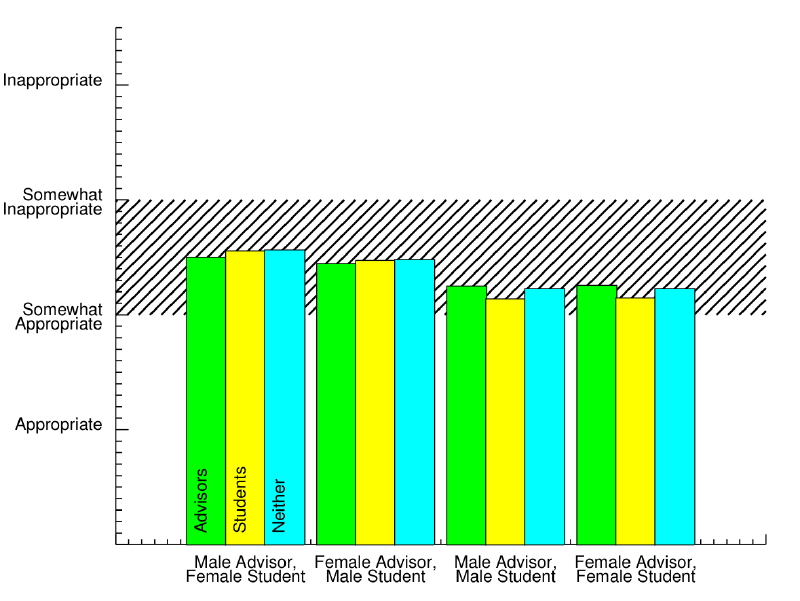
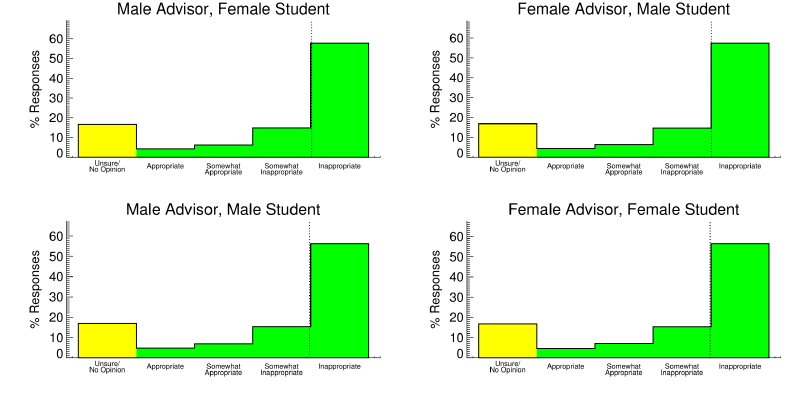
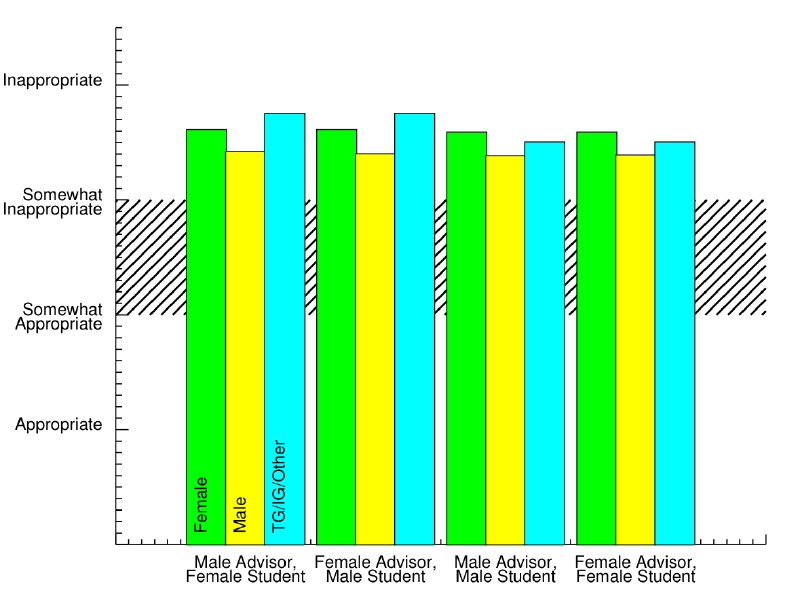
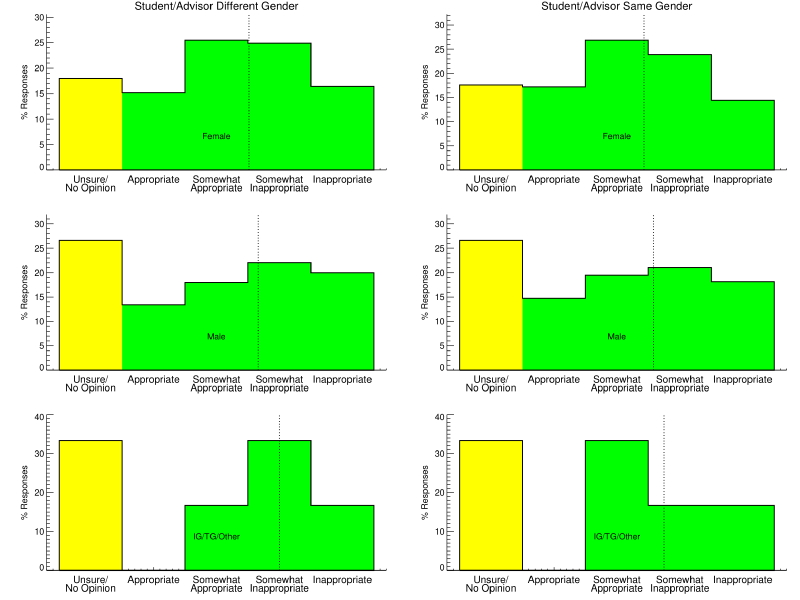
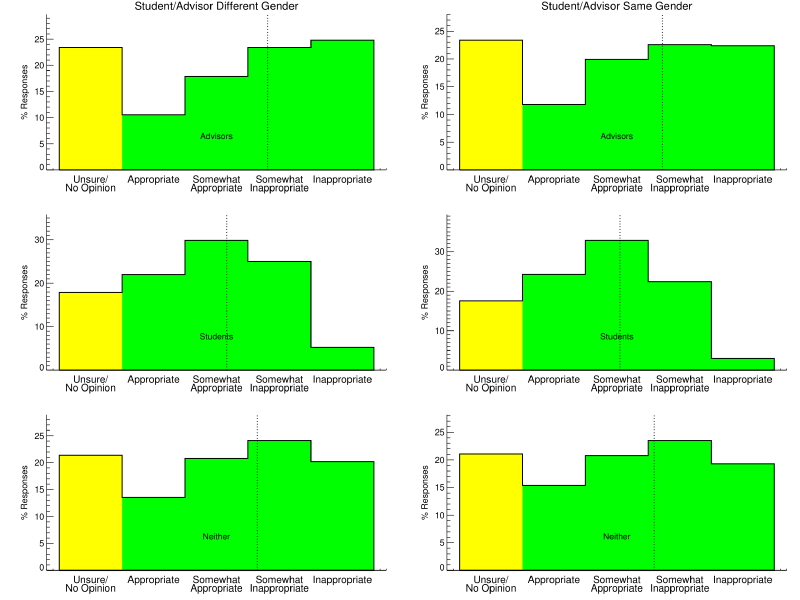
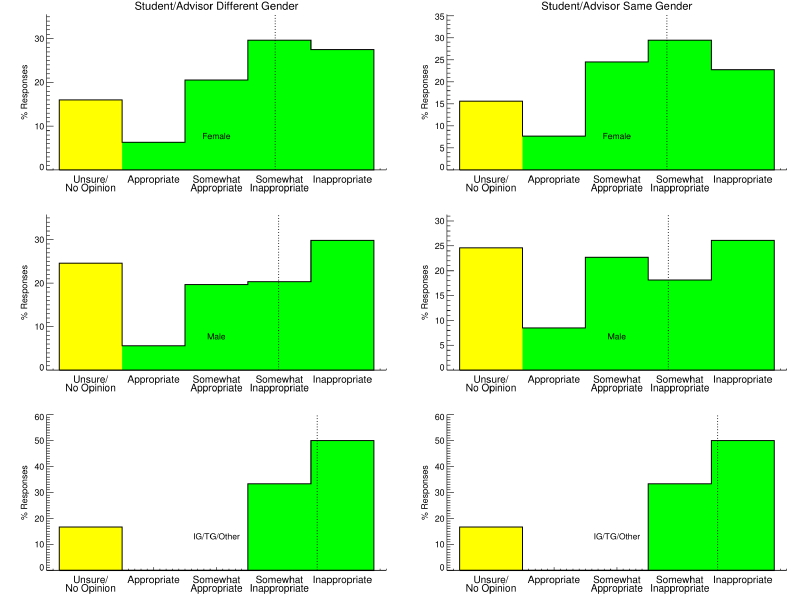
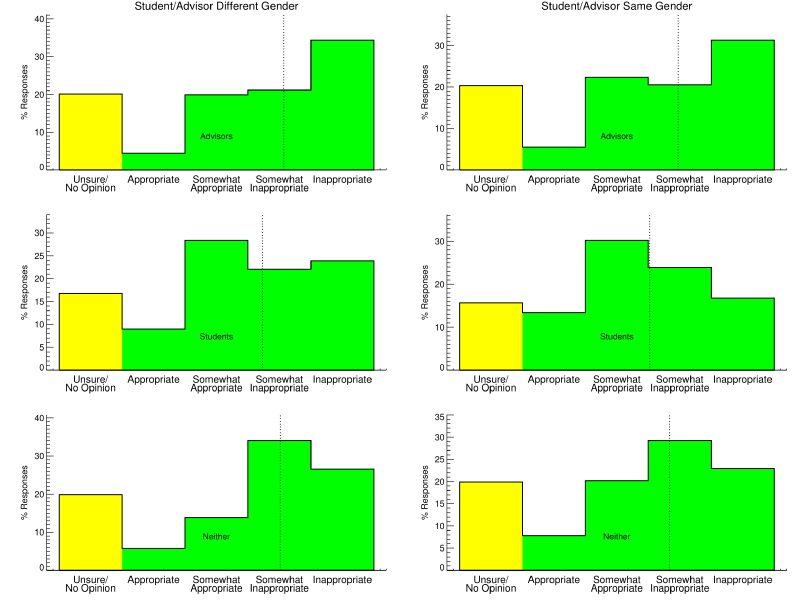
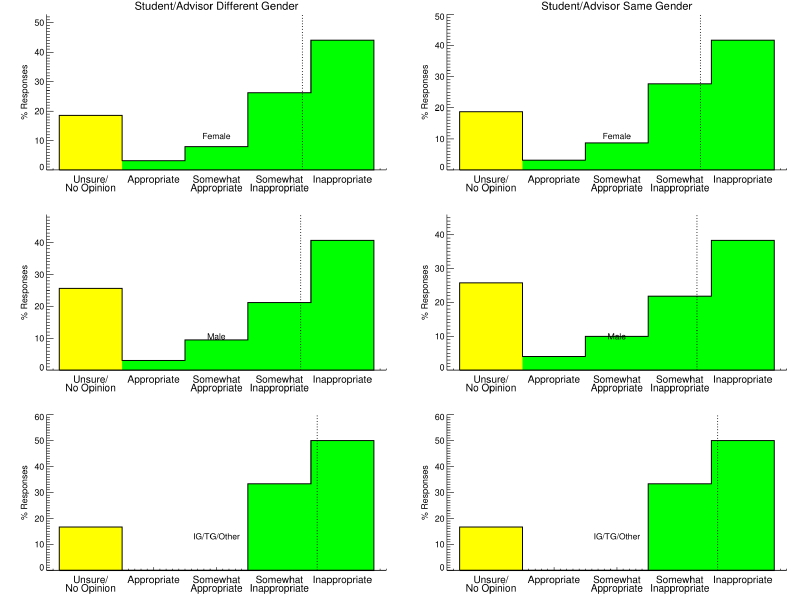
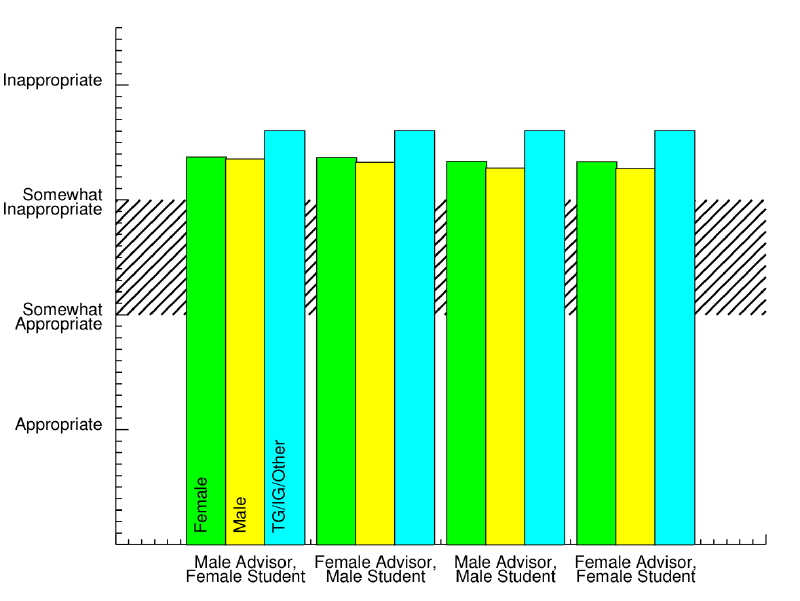
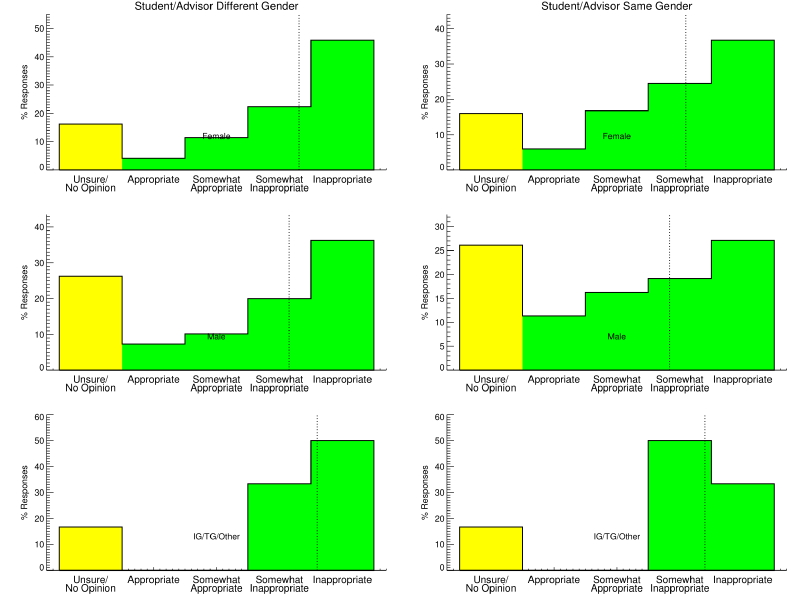
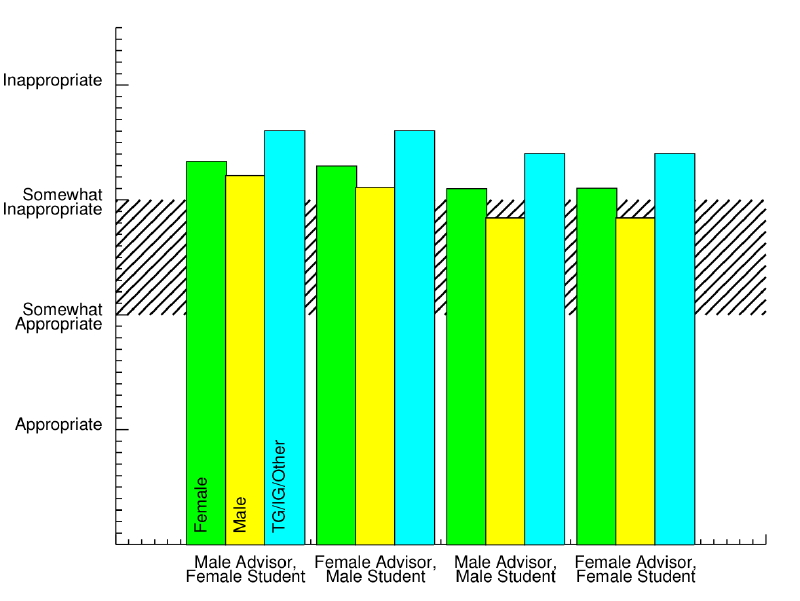
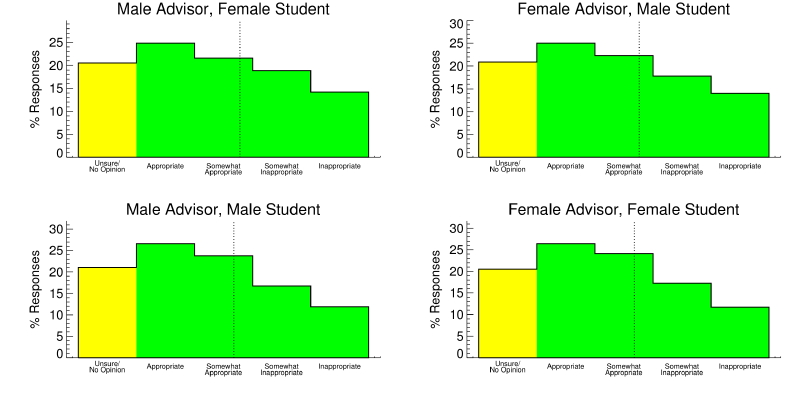
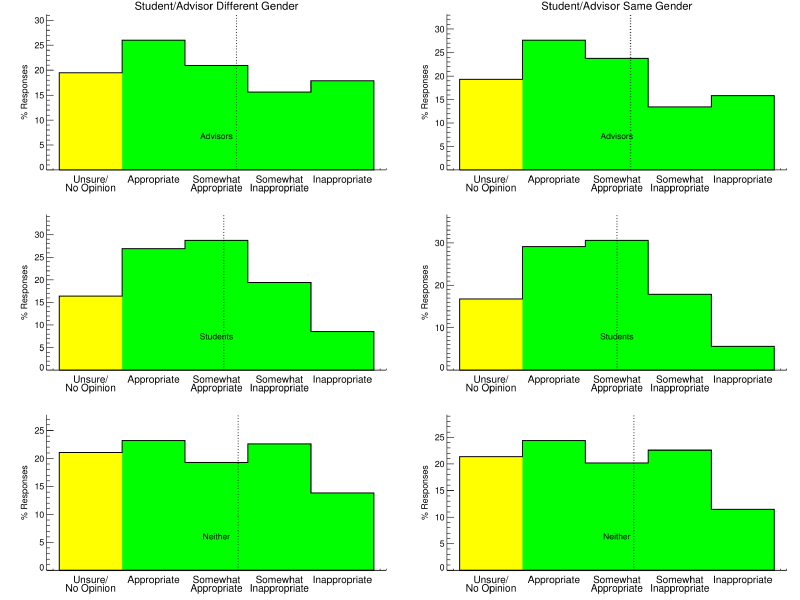
- On average, scenarios were seen as more inappropriate for student/advisor pairs with different genders than pairs with the same genders. Given that female students are less likely to have a same-gender advisor than male students (see Demographics below), this trend may have a negative affect on young women's student/advisor relationships.
- Our survey attracted a small fraction (8%) of highly negative and fearful criticism, overwhelmingly from men. There unfortunately appears to be continued resistance to open discussion of appropriate behaviors between students and advisors.
- A likely biased respondent sample (higher fraction of female participants than current demographics),
- No consideration of sexual orientation and possible heterosexual bias (relevant to our third conclusion above),
- No consideration of cultural background, and
- The inherent limitations of sampling complex social relationships with a generalized survey dependent on accurate self-reporting.
Demographics


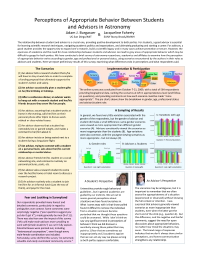
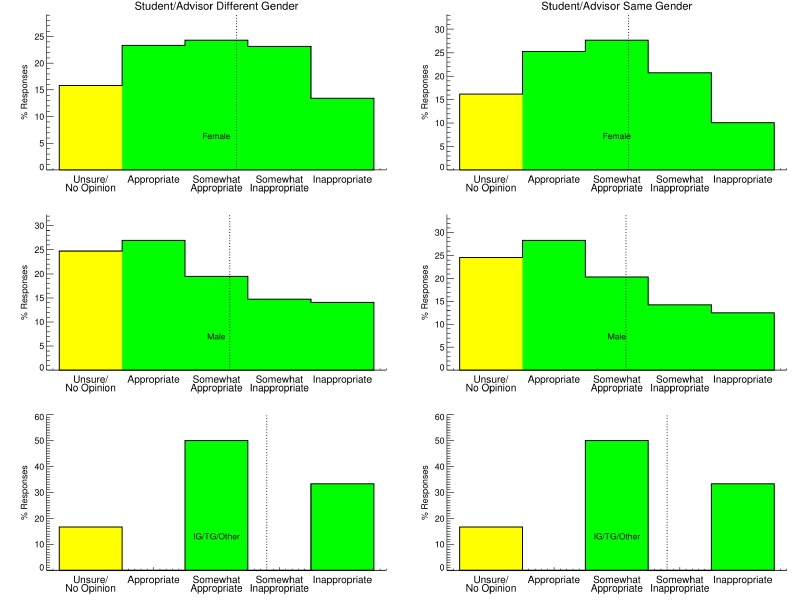
A total of 579 respondents took the survey, with 453 (78.2%) completing all questions. The pie charts above (upper left figure) show their breakdown in gender, age, professional status and student/advisor role. There was only a slight majority of male respondents over female respondents (53.1% versus 45.7%), although males were more overrepresented in senior positions (staff and faculty; lower left figure) in line with current demographics (e.g., Hoffman & Urry 2004). Females accounted for 54.1% of our student respondents, but only 38.7% of our postdoc, staff and academic faculty respondents (this is above the 20-30% of professional astronomers who are female, suggesting our sample is probably biased toward more women). The majority of respondents were in the 26-35 (41.5%) or 36-50 (31.0%) age brackets. We had fairly even representation among graduate students (23.4%), postdoctoral researchers (21.4%), junior faculty (12.9%), senior faculty (20.5%) and research/teaching/technical staff (15.8%), with the overwhelming majority of respondents based in an academic institution (75.6%) and/or doing research as their primary work (83.7%). Just under half of the respondents (44.6%) reported that they were currently an advisor, and just under a third (30.9%) reported that they were currently a student.
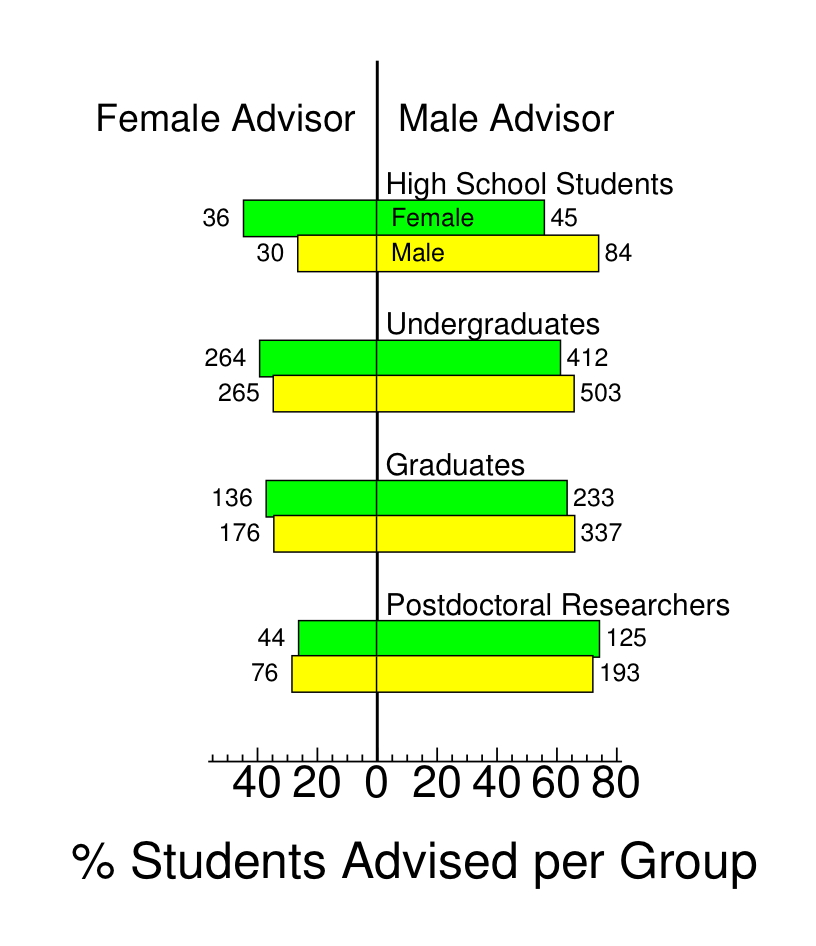
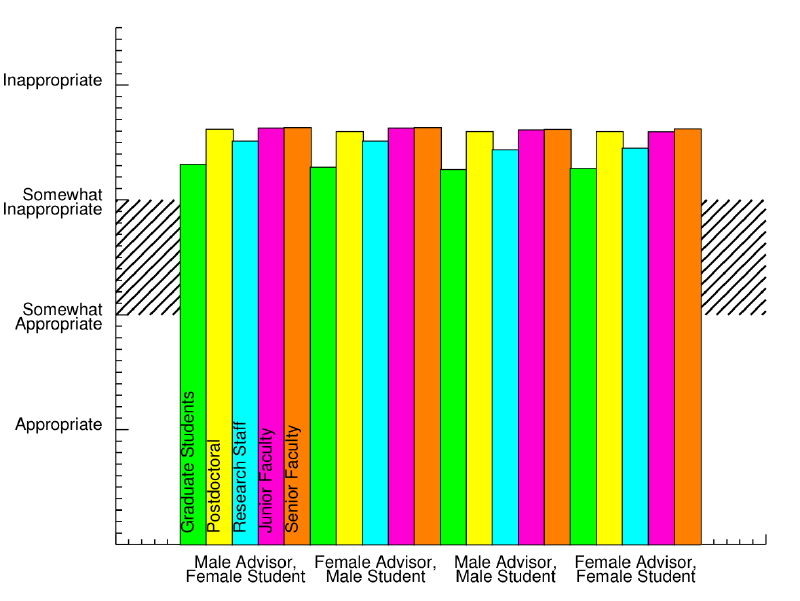
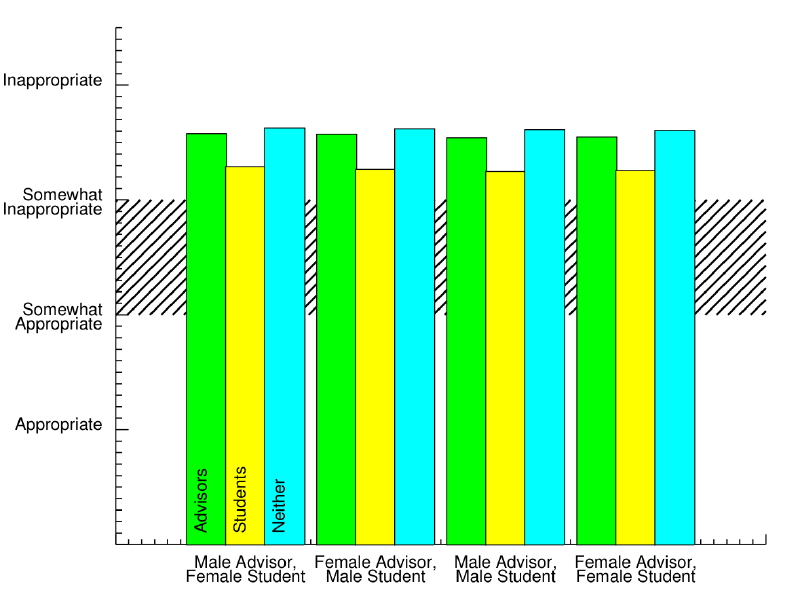
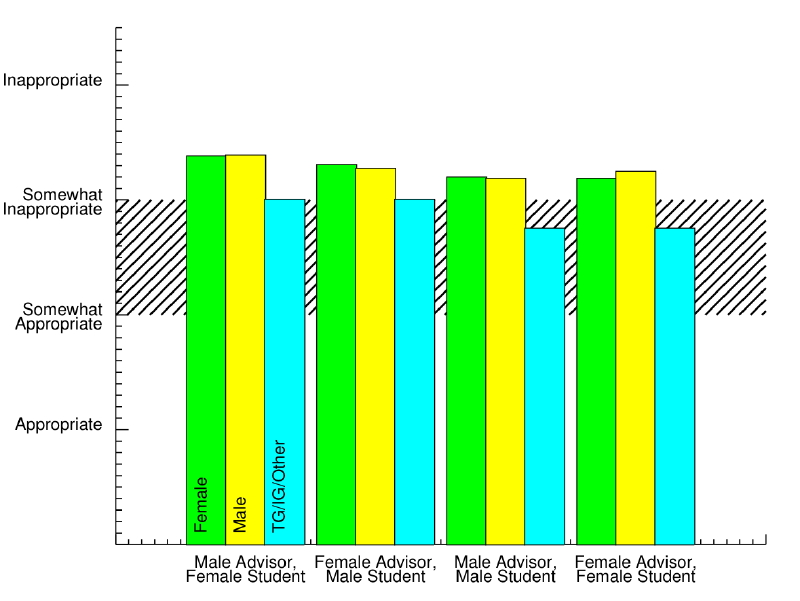
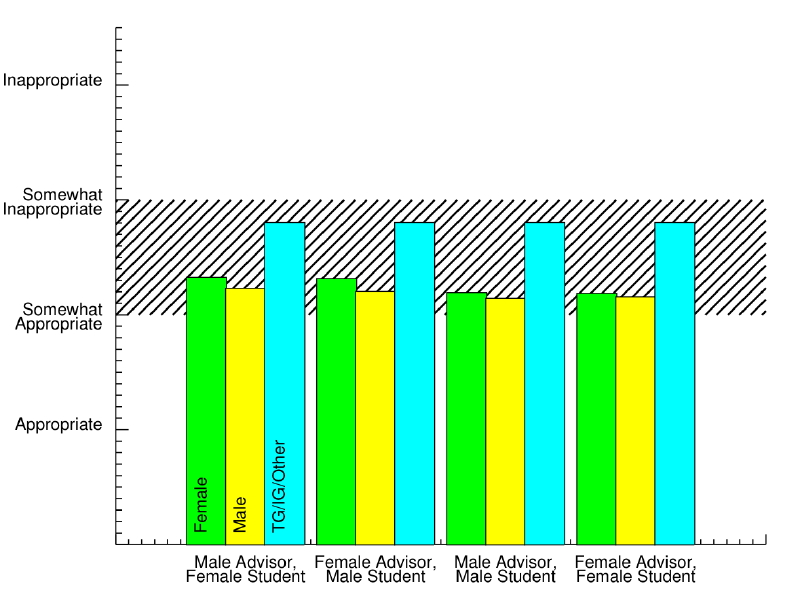
One statistic we were able to measure with our biographical data was the fraction of students with advisors of the same or different genders (this touches specifically on point 3 in the Summary above). The 252 respondents who were advisors reported the number and gender of the 2959 high school, undergraduate and graduate students, and postdocs, they had advised over the past 5 years. The figure at left breaks these numbers down by education level and student gender, and displays the fraction of those students advised by female and male advisors. As one progresses through the academic stages, the fraction of female students advised by female advisors drops precipitously, from 44.4% at high school to 26.0% at the postdoctoral level. In contrast, 65-74% of male students are advised by male advisors at these educational levels. As such, female students are far more likely to face cross-gender issues with their advisors than male students during their education, and increasingly so as they progress in their careers.
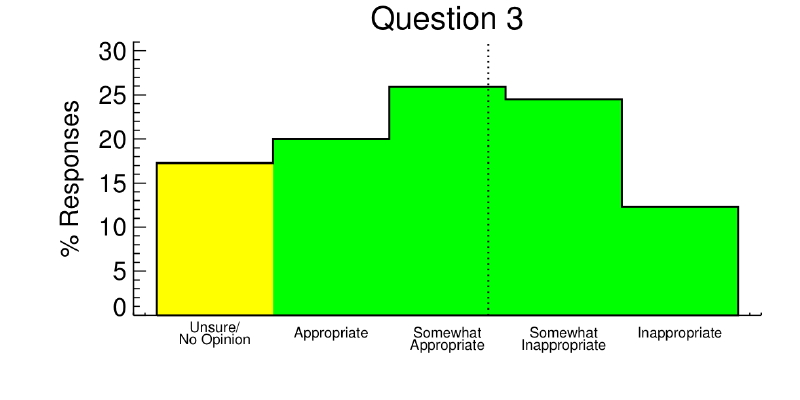
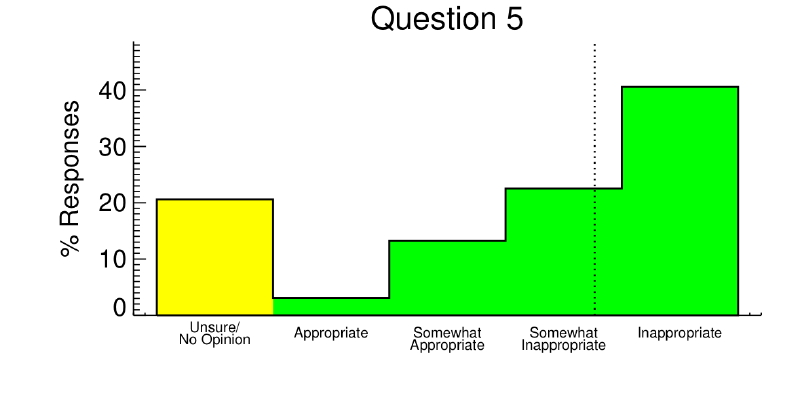
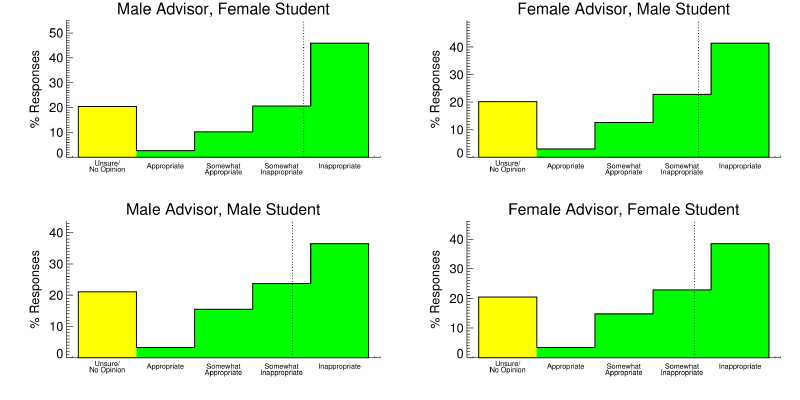
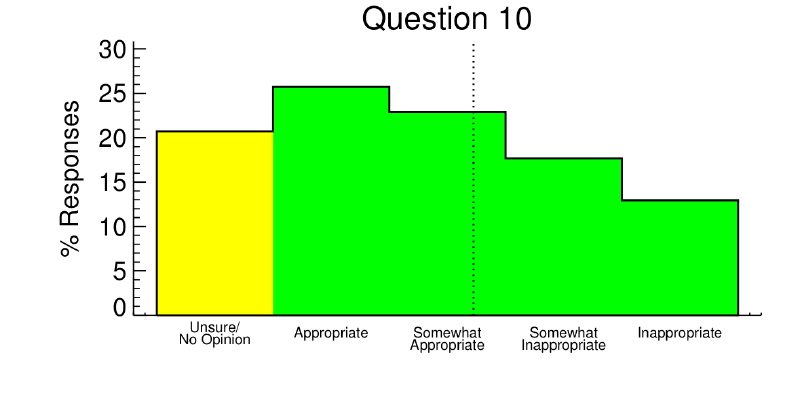
Responses
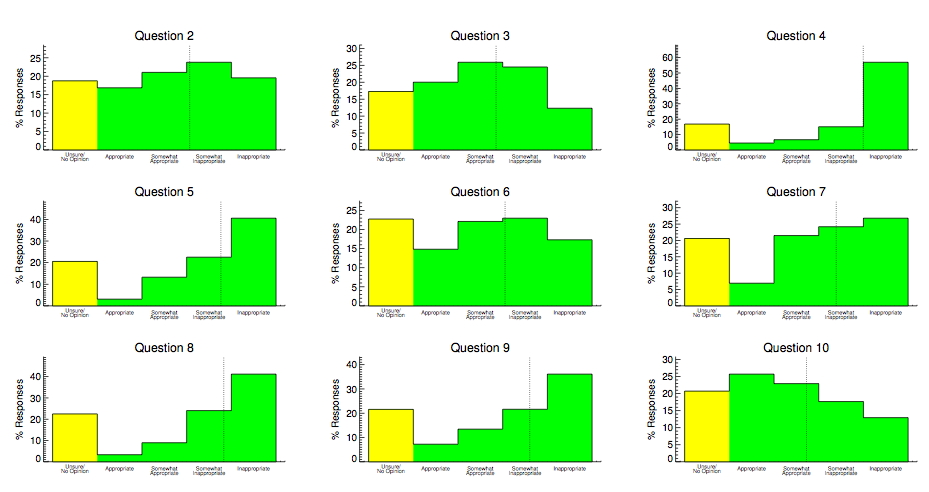
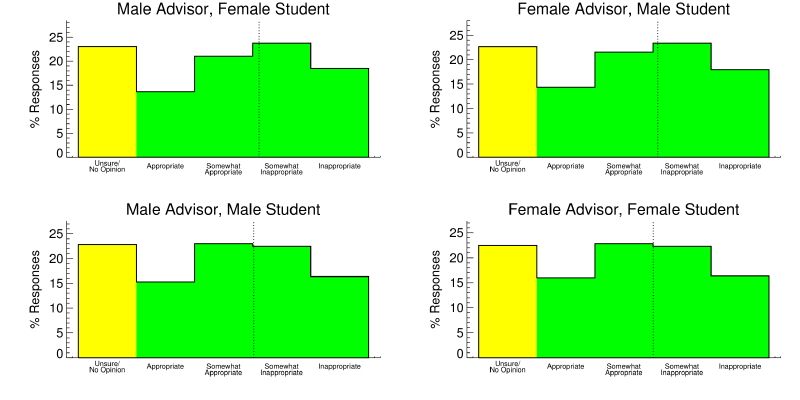
Summary of all responses for Scenarios 2-10
Our Favorite Quotes
- For a lot of these situations context makes a big difference.
- My concern is that this will make male advisors more unwilling to work with female students, which will prevent them from advancing their careers, and make the work place even more male dominated than it already is.
- Because this comes from the Women in Astronomy group, it also suggests that you are seeking responses related to gender discrimination
- As I get older, the sexual tension decreases, which makes it easier to connect with women and men on an equal basis.
- If the advisor is a dork and appears to lack social graces and/or fails to tune in to social queues, the behavior isn't threatening.
- Personal experience is not enough of a guide because women and men, students and advisors, see things differently
- I hope this survey will not be misinterpreted or misused based on the responses it will receive, since in answering the questions I personally felt that there is much opportunity for that to happen.
- Just because some of these scenarios seem a bit "creepy" doesn't mean that they are ALWAYS inappropriate between consenting adults.
- I'm a little disappointed you didn't ask anything about the obviously inappropriate behaviors that go on.
- your questions suggest you just don't get it.
- it seems that this survey is made by aliens for aliens (or worse by mathematicians who include all possible permutations of a question). No interactions between _real_ people are considered, and as such it will be fairly useless, I guess.
- You can't lay down hard and fast rules and legislate this.
- Hugging is a borderline issue. Californians are huggers but this can be misinterpreted.
- Any of these situations could be completely innocent and they seem to suggest that we should do nothing for fear of being labeled "a dirty old man" (or dirty old woman for that matter).
- I had another postdoc advisor (a few years later) that complained he would never hire another female postdoc because they were always at an age where they wanted and had children (I was pregnant at the time, and he knew it).
- I'm very pleased you folks are doing this survey, this is an extremely valuable and easily overlooked community service.
- There seems to be an implied bias towards heterosexuality in this survey.
- In all of the cases presented, the appropriateness depends so crucially on the actual AND perceived intentions
- I am concerned by the fact that gender and age are parameters in this survey.
- There seems to be some over-sensitivity in the survey to things that are "just business".
let's not destroy human nature and its warm side simply because a few people are overzealous or others are over sensitive.
- Many of the scenarios described made heterosexual assumptions that don't really apply in my case or in those of gay/lesbian students and advisors.
- Sketchy advisors tend to get a reputation.
some questions are not appropriate and carry an inferred inappropriateness because they are asked.
- I learned that appearances can be misinterpreted by others, sometimes deliberately, and it is best to keep things professional.
- Every situation listed in this survey could be seen as either appropriate OR inappropriate. It completely depends on the people involved.
- Speaking as a professional in their late thirties - I see an increasing trend towards blurring the line between faculty and students.
- I worry more about the obviously inappropriate behavior I occasionally see, rather than the borderline behavior.
- a lot of these scenarios do border on inappropriate - having these happen to me would (and the ones that I experienced did) raise a red flag with me, so that I would pay closer attention to those more subtle clues
- I hope this survey, which seems to be geared negatively towards advisor-student friendliness, doesn't make my advisor stop being friendly to me, out of fear of seeming inappropriate!
- you're trying to get an outside view (and thus by definition one without context) of an intrinsically personal (and thus subjective) relationship between two people. Surely all you're going to record is the social stereotypes of your respondents?!
For Further Reference
- Conference page for Women in Astronomy 2009 where other results from the conference are provided.
- AAS Committee on the Status of Women provides a nice list of advisement tips particularly (but not exclusively) for female students/postdocs. They also maintain statistics on gender parity in astronomy.
- She is an Astronomer, a Cornerstone Project of the International Year of Astronomy 2009.
- The Women in Astronomy blog, run by several active contributors to the field.
- My blog post describing the gender match-up between students and advisors in astronomy in greater detail.
- Mentornet: a nonprofit e-mentoring network for engineering, science and mathematics, particularly but not exclusively for women and others underrepresented in these fields.
- Howard Hughes Medical Institute provides several useful resources, including Entering Mentoring and Making the Right Moves: A Practical Guide to Scientific Management for Postdocs and New Faculty.