Warm Up Lab
11.s946: Mini-Class on Urban Analytics and Spatial Data Management
Massachusetts Institute of TechnologyFall 2017
Welcome to 11.S946! The goal of this session is twofold: to make sure that your machine has the software configuration required to complete the class exercises, and to get you familiar with the data.
Software Tools
You will need these three open source software to complete the labs: 1) PostgreSQL with PgAdmin IV, 2) QGIS, and 3) R with Rstudio.
PostgreSQL is an object-relational database management system (ORDBMS) that functions as a database server to store multiple datasets. The data for the class sits on a Postgres server, to which you have access now through your credentials. PgAdmin is a client-side user interface tool to connect to PostgreSQL and retrieve records from the relational database server using queries written in Structured Query Language (SQL).
PgAdmin will be helpful to explore the data in Postgres using queries. However, you cannot visualize the data or do statistical analysis in PgAdmin. For this purpose, we will use QGIS and R. QGIS can connect to PostgreSQL to load geospatial data, to display and manipulate it using the power of GIS. The ArcMap part of ArcGIS can do the same thing. If you prefer ArcMap to QGIS, you are free to use it, although the examples and materials of the class rely primarily on QGIS.
The R Project provides free and open source software for statistical computing and graphics, while RStudio is a free and open source integrated development environment (IDE) for R. In plain English, RStudio is a software wrapper that gives a more visual and user-friendly experience to R. (Nevertheless, the command language used by R remains elegant but tricky and unforgiving.) In the labs, you will connect R to PostgreSQL, similar to what you do with QGIS, to load the datasets from the server onto your statistics platform.
Software Configuration
There are different configurations that might require additional tweaks, depending on your machine and the operating system that you are using. Lets review them.
Using a CRON Desktop
Your configuration should be all set, whether you choose to boot into Windows or macOS.
Using Your Laptop
On Windows 7, 8, or 10 using 64-bit hardware
Make sure that you have installed PgAdmin IV, QGIS 64-bit, R 64-bit (any version after 3.2, 3.3 recommended). ArcGIS is optional.
On Mac.
In this case, you have two alternatives. The first one is to install PgAdmin IV, QGIS 64-bit, and R 64-bit versions for Mac. The second option is to have installed the Virtual Machine (VM) made available by CRON for DUSP students, which already contains R, RStudio and PgAdmin IV versions for Windows. If you decide to go for the VM option, please install QGIS in your VM as it was not included in the configuration file.
Using a VPN
On either Mac or Windows, if you are off campus, you will need a Virtual Private Network (VPN) to establish a connection to MIT, in order to connect to our Postgres server. MIT IST recommends using Cisco AnyConnect Secure to establish a VPN (For installation instructions and download, refer to https://ist.mit.edu/cisco-anyconnect). Note again that you only need the VPN if connecting from off campus.
Data
To get you familiar with the dataset, we will explore the files stored in PostgreSQL using PgAdmin and QGIS.
Exercise 1: phpPgAdmin
Open the following address in your web browser: http://cronpgsql.mit.edu/phppgadmin/. Login using your credentials. Explore the
tables in the database class946, under the schema called vmtdata.
The files with a name starting with a leading g_ correspond to geometry
data with geospatial information. Please, refer to the data dictionary for
further reference to the contents of each table: (http://web.mit.edu/11.s946/www/ClassData/data_dictionary.xls.
The files without the leading g_ are tabular information without geometry.
Exercise 2: PgAdmin IV
Open PgAdmin IV and under the Browser window,
right click on Servers, then select the options Create
and Server. This opens a new window; enter the name you want for
the connection, and switch to the Connection tab. Enter your credentials,
and the host and port as specified in Figure 1. For security reasons, do not
select the option Save password. Hit Save.

Figure 1. New server connection to Posgres in PgAdmin
This creates a new connection that you should
see on the left pane of the window. Double click on it and enter your password.
If the connection is successful, you should see a list of available database
and schemas. Browse through the class946 database and select the vmtdata schema. Explore the tables. (HINT: right click on a table and select the
option View Data/View Top 100 Rows).
Finally, at the top of the menu, select the Tools
tab and the option Query Tool. This will open a new window on
your right. Do here a query on the Census block groups to retrieve the rows
with an income per capita greater than $30,000. Execute your query.
SELECT *
FROM vmtdata.demographic_bg
WHERE inc_capita>30000;
You can save your query by selecting the option Save from the icon in the top of the menu. We could also perform a simple query by joining the tables using a common column. For instance, lets join the vmt_250m and built_environment_250m tables to merge population density and total vehicle miles traveled.
SELECT t1.g250m_id, t1.vmt_tot_mv, t2.popden
    FROM vmtdata.vmt_250m t1
      INNER JOIN vmtdata.built_environment_250m t2
      ON (t1.g250m_id=t2.g250m_id)
    WHERE vmtdata.vmt_vin > 15000;
This query lists the 1488 metro Boston grid cells for which the estimated annual mileage per vehicle exceeds 20k miles. If you are not very familiar with SQL, we encourage you to look at this tutorial from W3 Schools: https://www.w3schools.com/sql/
Exercise 3: QGIS.
Open QGIS Desktop and start by providing the information needed to connect QGIS to data on our
Postgres server. From the top menu of QGIS, select the Layer tab, then
click on the Add Layer option, and then the option Add
PostGIS Layer. This will open a new window, in which you will specify a
new connection as shown in Figure 2.
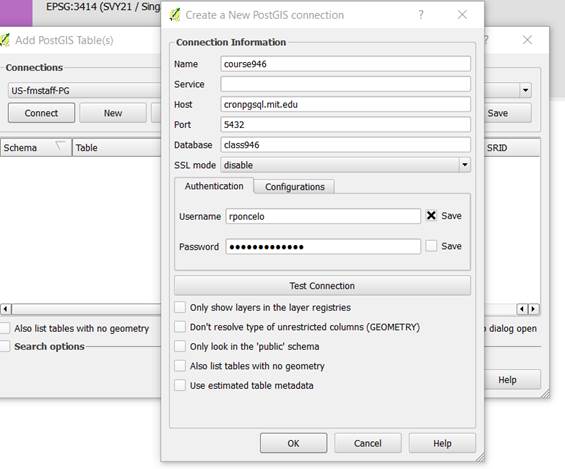
Figure 2. Adding a new server connection in QGIS.
Test the connection to confirm that
it is working. Then, be sure not to save the password and hit OK
to close the window. (Note: You should not save the password since saving
it will allow Postgres access to anyone who has a copy of your saved QGIS project
file. If you also choose not to save the username, then other users with
permission to access the class946 database will also be able to enter their
own credentials and utilize your saved QGIS project. This approach can help
with group work.)
Now that you have setup your
PostGIS connection, choose the Layer/Add Layer tab once
again and then choose Add PostGIS to connect to your newly added
connection. Click the 'Connect' button to see what tables are available.
Click the also list tables with no geometry box so you can see
the tabular data as well as the boundary files. Scroll to the vmtdata schema
that should show at the bottom of the window and try to add any layer(s) to the
map. We suggest that you add vmt_250m and g_bos_vmt_grid
so you have the data table with VMT estimates plus a geometry file with only
the grid cells in metro Boston. Explore the two layers by right-clicking them
and choosing open attribute table and properties. You may
say your QGIS project so you can pick up where you left off by choosing Project/Save
As from the main QGIS tabs.
To provide you with a simple QGIS
startup project, we have saved the file 11s946_qgis_startup.qgs in the ClassData
folder of our class locker: You can access this file via: http://web.mit.edu/11.s946/www/ClassData/11s946_qgs_startup.zip.
Download and open this file. Note that QGIS will prompt you for Postgres
credentials in order to access the class data on the Postgres server. You may
have to enter your credentials once for each connected data layer.
This QGIS startup project
includes the vmt_250m table plus the boundary files for
Massachusetts cities and towns; for the 2727 traffic analysis zones (TAZ) in metro
Boston; and for the 53 thousand 250x250m grid cells in metro Boston that
contain VMT estimates. Open the attribute table for g_taz2727_codas and use
the select features using an expression tool to select those TAZ with
codas=1. This value tags the TAZ that are considered suitable for further
development. You may also want to turn on the g_bos_vmt_grid layer and
find the grid cell with the largest number of registered vehicles (the no_vin
column in the vmt_250m table). Dont worry if you are not familiar with
the look and feel of QGIS and Postgres SQL queries. We will have a lot more
time (and help) to get comfortable during the next few weeks. For todays
warmup lab, the goal is to make sure you have a working computer setup to
access all the required tools and data.
Final Comment: tables and geometry stored in PostgreSQL are also accessible as .csv and shapefiles either from the class locker or from the following link: http://web.mit.edu/11.s946/www/ClassData/data.zip
If you prefer to rely on other tools or programing languages instead of accessing the Postgres database server, you are free to access the same data on your own (e.g. with Python, Matlab, MS-Access, or Excel).
Created by Roberto Ponce Lopez (2017);
Modified by Joe Ferreira and Roberto Ponce Lopez (2017)
Last modified: October 11, 2017 [rponcelo]
Back to DUSP | CRON | MIT | MiniClass Homepage