|
Hedonic Quality Adjustment Methods for
College Textbooks in the U.S. CPI
by Mike Reese
The College textbooks item category has been in the Consumer
Price Index (CPI) since 1964. College textbooks, along with
Elementary/high school textbooks, and Reference books make
up the Consumer Price Index aggregate index Educational books and
supplies. Educational books and supplies had a relative
importance of .196 in the CPI-U All Items, as of December 1999. The
Educational books and supplies index is published monthly at the
U.S. level, while none of the aggregate's three components are published.
College textbooks is by far the largest component.
College textbooks includes any book, which, according to the
outlet, has been designated by the college, department, or professor, as a
required text for a course offered by the college during the academic
period. Only new books are priced. Used books are included in the item
category's weight, but excluded from pricing to avoid the difficulty
finding comparable items over time.
College textbooks has a relatively high number of replacements
(which occur when the book that has been followed is no longer sold in the
outlet) and in many cases the replacement is not comparable to its
predecessor. For example, over the one year time period from June 1998 to
May 1999, the CPI priced a total of 948 quotes for the College
textbook category. From this full year of quotes, 113 quotes (12%)
were replacements. Of the 113 replacements, 40 quotes (35%) were deemed to
be either comparable or able to be quality adjusted, and thus could be
used in the CPI. The remaining 73 quotes (65%) were not comparable, and
were deemed to be eligible for other processing where estimated price
change is used based on price movement of comparable replacement items.
Ultimately, this meant that 1 out of every 13 priced quotes in this item
category over the course of a year were non-comparable replacements. These
figures led to the conclusion that College textbooks more than qualified
as a candidate for hedonic regression analysis.
The idea behind hedonic models is that items can be thought of as
bundles of item characteristics. Hedonic models estimate values for the
individual characteristics of a good or a service.1 Parameter
values from hedonic models can be used by CPI analysts to calculate
changes in quality between two items with different characteristics.
Most hedonics studies have historically been performed on items such as
apparel and appliances, where the purchaser determines the demand for the
product. The demand for college textbooks is not determined by the
bookstores or the college students that purchase books. Instead, demand is
determined by third persons within the college, such as the
professors.
Basic Data
Data for this study were from the March 1999 CPI data base. There were
338 observations. The CPI defined each item category with a checklist. The
checklist identified specifications that define the various items that
fall in the category. The checklist specifications correspond to the
characteristics that the hedonics need. Even though the College textbook
checklist is not lengthy, a number of important specifications were
isolated. 'Price' was used as the dependent variable in the original
regression models. The independent variables selected were as follows:
- Book cover -- Separate variables were created for hard book covers
and soft book covers.
- Degree status of intended student and course -- Individual variables
were developed for both graduate and undergraduate courses.
- Book size -- Six different variables needed to be set up for
different sizes of books. The book sizes recognized (in inches) were 8.5
X 11, 8.5 X 9.5, 8.5 X 5.5, 7 X 10, 6 X 9, and Other.
- Book pages -- Seven different variables were created for different
book lengths. The page categories listed were (a) under 150, (b) 151 -
300, (c) 301 - 500, (d) 501 - 800, (e) 801 - 1150, (f) 1151 - 1500, and
(g) over 1500.
- Course subjects -- Numerous variables were developed for different
course subject matters. In some cases, related subject matters had to be
combined to form broader categories. This is the list of course
variables that were set up:
| Accounting |
Anthropology |
Biology |
| Business |
Calculus |
Chemistry |
| Computer |
Economics |
Education |
| Engineering |
English |
Geography/Geology |
| History |
Mathematics |
Medical/Dental |
| Music |
Philosophy |
Physics |
| Political Science |
Psychology |
Sociology |
- Book features -- Some books have special features or extra items
included. Three different variables were set up to account for these
areas.
(1) Book has spiral binder feature
(2) Book has color plate(s) feature
(3) Book includes workbook, study guide, kit or disk
- Individual major publisher -- Textbook publishers are important to
this model. Studies have shown that approximately 65% of the fees paid
for college textbooks are retained by the publishers.2 The
possibility exists that part of the price of a textbook may be tied up
in publisher name recognition. However, the quotes in this item category
list far too many publishers to create an individual variable for each
one. Eight of the larger, more well-known educational publishers that
priced eight or more books on the data base were isolated as individual
major publisher variables. All other publishers were grouped in a
'Not-major publisher' variable.
- Separate variables were also considered for size of city and CPI
region of the country where each bookstore can be found.
- Separate variables were established for the type of business
(university bookstore, community college bookstore, independent
bookstore contracted by the college, etc.) that was recorded for each
quote.
A number of programs were run to clean-up the college textbook data in
preparation to run the regressions. During this process, a total of 123
quotes were deleted from consideration, reducing the usable sample from
338 to 215 quotes. The remaining quotes were deemed to be more than
adequate to build the regressions.
Starting the Regressions
The first models were run using the linear equation. The reference or
base variables (dummy variables left out to avoid overdetermining the
model) were soft cover book, undergraduate student, 8.5 X 11 book size,
under 150 pages length, music subject, no special features/extra items
included, not-major publisher, city size C (smallest cities), region 3
(south), and business type #1 (full price department store).
Model One
| R-Square = 0.7853 |
Adj R-Square = 0.7146 |
| |
Parameter |
|
Confidence |
| Variables |
Estimate |
T-Value |
Level |
| Intercept |
26.0389 |
1.82 |
.0712 |
| Hardcover |
16.5311 |
6.35 |
.0001 |
| Graduate |
-6.3808 |
-1.71 |
.0898 |
| 8.5 X 9.5 |
1.0227 |
0.35 |
.7292 |
| 8.5 X 5.5 |
-3.6952 |
-0.65 |
.5191 |
| 7 X 10 |
-9.3458 |
-2.78 |
.0071 |
| 6 X 9 |
-5.2436 |
-1.37 |
.1738 |
| Other size |
-24.6604 |
-2.57 |
.0110 |
| 150 - 300 pages |
4.2437 |
0.49 |
.6272 |
| 301 - 500 pages |
16.2103 |
2.01 |
.0463 |
| 501 - 800 pages |
23.9299 |
2.97 |
.0034 |
| 801 - 1150 pages |
32.5776 |
4.02 |
.0001 |
| 1151 - 1500 pages |
37.7258 |
4.25 |
.0001 |
| Over 1500 pages |
29.1186 |
3.13 |
.0021 |
| Accounting |
5.9230 |
0.63 |
.5284 |
| Anthropology |
-12.9323 |
-1.22 |
.2239 |
| Biology |
4.5510 |
0.53 |
.5957 |
| Business |
8.1798 |
1.01 |
.3141 |
| Calculus |
23.8364 |
2.25 |
.0261 |
| Chemistry |
4.7471 |
0.58 |
.5611 |
| Computer |
4.5494 |
0.54 |
.5915 |
| Economics |
1.2976 |
0.15 |
.8829 |
| Education |
3.5848 |
0.42 |
.6772 |
| Engineering |
11.8162 |
1.32 |
.1880 |
| English |
-15.4790 |
-2.10 |
.0374 |
| Geog/Geology |
0.6969 |
0.07 |
.9471 |
| History |
-16.8010 |
-1.80 |
.0734 |
| Mathematics |
6.6082 |
0.84 |
.4047 |
| Medical/ Dental |
-6.0850 |
-0.74 |
.4606 |
| Philosophy |
-17.4590 |
-1.93 |
.0556 |
| Physics |
4.2108 |
0.46 |
.6484 |
| Political_Sci |
-2.6557 |
-0.25 |
.8042 |
| Psychology |
-7.0803 |
-0.83 |
.4078 |
| Sociology |
-.5456 |
-0.06 |
.9557 |
| Workbook |
2.0671 |
0.54 |
.5933 |
| Spiralbinder |
-2.2916 |
-0.40 |
.6864 |
| Colorplates |
2.4775 |
0.55 |
.5850 |
| Region_1 |
4.5097 |
1.52 |
.1304 |
| Region_2 |
1.5441 |
0.55 |
.5812 |
| Region_4 |
1.9766 |
0.69 |
.4886 |
| Citysize_A |
0.9416 |
0.26 |
.7922 |
| Citysize_B |
-0.6049 |
-0.17 |
.8682 |
| Type_bsns#2 |
1.8107 |
0.24 |
.8143 |
| Type_bsns#3 |
2.6902 |
0.35 |
.7308 |
| Type_bsns#4 |
2.5478 |
0.31 |
.7594 |
| Type_bsns#5 |
14.6046 |
1.27 |
.2070 |
| Majorpub#1 |
1.5458 |
0.37 |
.7145 |
| Majorpub#2 |
7.5808 |
1.25 |
.2145 |
| Majorpub#3 |
5.6281 |
1.13 |
.2596 |
| Majorpub#4 |
-2.4457 |
-0.42 |
.6757 |
| Majorpub#5 |
1.0125 |
0.22 |
.8233 |
| Majorpub#6 |
5.0210 |
1.47 |
.1425 |
| Majorpub#7 |
-.7989 |
-0.14 |
.8882 |
| Majorpub#8 |
4.6649 |
1.36 |
.1746 |
Model One Analysis
The first linear model had some encouraging results. The R-Square of
.78 and the adjusted R-Square of .71 meant that three-quarters of the
dependent variable 'Price' had been explained. The intercept parameter
estimate seemed high at $26, especially since many books on the data base
had a retail price of $15 to $30. However, this was more easily understood
when viewing the independent variables. The preferred T-Values were
figures above 2.0, while the preferred confidence intervals were figures
under .05.
The variables for cover type, degree status, and number of pages
modeled reasonably on the whole. Hard cover books are more expensive than
soft cover books. Model One bore out this fact with the parameter estimate
that hard cover books are $16 more expensive than soft cover books. The
Degree status variable yielded borderline, yet surprising results. Most
people intuitively believe that graduate level books cost more than
undergraduate books. Model One listed graduate books as slightly more than
$6 cheaper than undergraduate books. There were some successes with the
number of pages variables. The statistics with higher significance
belonged to the middle variables representing book sizes from 300 to 1500
pages. The variable for the shortest books had poorer T-statistics, but
not poor enough to justify its deletion. The variable for the longest
books possessed excellent statistics, however contrary to expectations it
possessed a lower parameter value than the variable for the next smaller
group of books.
The different course subject variables yielded mixed results. Some
possessed significant statistics, while others did not. The seemingly
surprising fact that the sign for around one-third of the subjects was
negative simply meant that the excluded subject (music) did not represent
the books that were the cheapest on average. This also explained the high
intercept value of $26, since a $20 book could be explained by taking the
$26 intercept and subtracting one of the negative course subject parameter
values.
None of the eight variables for the individual major educational
publishers tested as significant. However, since publishers receive a
large chunk of textbook revenue, these variables should be considered
further. Possibly combining these publishers can produce significant
results.
A number of variables tested poorly enough to consider deletion. Most
of the book size variables did not model very well. The majority of them
did not test as significant. The 8.5 X 9.5 size variable possessed a
positive sign contrary to expectations, plus the parameter estimates did
not relate well to each other compared with each book size. The variables
for book features/extra items fared poorly, which was surprising.
Intuitively, one would think that providing more features with the product
would add product value. The variables for city size, region of the
country, and business type modeled poorly. All of these variables were
deleted in the next iteration, removing them from further consideration.
Linear Model Modifications
Many changes were made to the input data from Model One in order to
make improvements. The following are the bulk of the changes that were
made to ultimately arrive at the successful Model Two:
Some combinations were created with the number of pages variables that
had borderline performances in Model One. The variables for under 150
pages, and 151 to 300 pages were combined to form a variable for 300 or
less pages. Also, the variables for 1151 to 1500 pages and over 1500 pages
were combined to form a variable that covered any book over 1150 pages.
The other three number of pages variables were allowed to remain as they
were.
The eight individual major publisher variables were all combined
together to form one large major publisher variable. The hope was that the
major publishers as a unified group variable can produce significant
results.
One of the first changes for the course subjects variables was to
change the excluded variable in the model. Model One seemed to indicate
that History books were, on average, the cheapest. Changing the reference
variable to History books allowed the remaining course subject variables
to all display positive values, as well as significantly lowering the
intercept parameter estimate. The mixed performances from the course
subjects variables led to combining of related variables to form broader
variable categories --
BUSACCMP = Business, Accounting, & Computers combined.
BIOCHPHY = Biology, Chemistry, & Physics/Physical Science
combined.
GENERCLS = All other subject variables combined; exceptions noted in
the following.
NOTE -- Calculus, Engineering, English, History & Mathematics were
allowed to remain as individual variables.
NOTE -- Other variable combinations, such as combining Psychology and
Sociology, were tried. None produced significant results.
Model Two
| R-Square = 0.7373 |
Adj R-Square = 0.7189
|
| |
Parameter |
|
Confidence |
| Variables |
Estimate |
T-Value |
Level |
| Intercept |
7.5533 |
1.67 |
.0968 |
| Hard cover |
18.5322 |
8.45 |
.0001 |
| Graduate Student |
-7.3860 |
-2.54 |
.0119 |
| 301 - 500 Pages |
13.9461 |
3.60 |
.0004 |
| 501 - 800 Pages |
19.5668 |
5.46 |
.0001 |
| 801 - 1050 Pages |
26.9218 |
6.65 |
.0001 |
| 1051 or more Pages |
29.2570 |
6.89 |
.0001 |
| BUSACCMP |
29.7708 |
7.49 |
.0001 |
| Calculus |
47.5284 |
6.41 |
.0001 |
| BIOCHPHY |
30.7441 |
7.34 |
.0001 |
| Engineering |
32.1264 |
5.25 |
.0001 |
| English |
5.4385 |
1.30 |
.1959 |
| Mathematics |
30.1641 |
7.13 |
.0001 |
| GENERCLS |
21.1149 |
5.36 |
.0001 |
| Major publisher |
4.4579 |
2.39 |
.0193 |
Excluded variables: Soft cover, Undergraduate student, Under 300 pages,
History, Not-major publisher
This model performed well. The R_Square value of almost .74 and the
adjusted R_Square value of almost .72 again indicated that around
three-fourths of the dependent variable 'Price' have been explained. The
signs for all of the independent variables appeared to be correct, and all
of the parameter estimates appeared to be acceptable.
The T-Values and confidence levels for almost all of the independent
variables were excellent. Among the exceptions, the statistics for the
Intercept were marginal and the statistics for English were poor. In this
case, the English variable was allowed to stand since no other variable
seemed appropriate to combine with English.
One surprising factor was that the Calculus variable was able to stand
on its own in all models, including Model Two. This subject seemed to defy
a combination with areas such as algebra and geometry in order to form a
comprehensive Mathematics variable. Today, most calculus books are deemed
to be expensive, and they seem to retain reasonable value when students
resell them as used books. On the other hand, the cleaned data base used
for this study had no more than five quotes where calculus was priced.
Therefore, the Calculus variable may need supplemental data in future
studies.
Model Two Testing
Two types of testing were planned for Model Two. Applications for both
types of testing are presented here.
- The first testing involved insertion of model parameter values to
determine book prices using college textbook descriptions from the CPI
data base. The calculated prices were then compared with actual data
base textbook prices. In the majority of cases the Model Two predicted
values produced estimates that deviated less than 15% from the data base
prices. Most of the exceptions were noted on lower priced books,
especially those with a retail price below $20.
- The second type of testing was carried out over a period of five
months. As non-comparable replacements arrived in the CPI office, Model
Two parameter values were applied to the quotes to see if the parameter
estimates could be used to quality adjustment the quotes. After this
testing period, a summary of the testing revealed that Model Two was
able to be successfully used to quality adjust approximately 85% of the
non-comparable replacements. The majority of the exceptions, again, were
textbooks priced below $20.
One example from this testing was a non-comparable replacement
involving the replacement of a college English book. The replacement book
provided a price increase of 24.5% for the quote. Application of parameter
estimates from Model Two reduced the quote price increase to 4.4%.
Additional Model Two Research
The largest concern from the Model Two textbook testing was that quotes
with lower prices (under $20) at times were not performing well. Since
number of pages seemed to be a very important price factor, a graph was
created to plot the price for each textbook compared to the corresponding
page range for each textbook. The theory was that lower priced textbooks
could conceivably require a different model than Model Two.
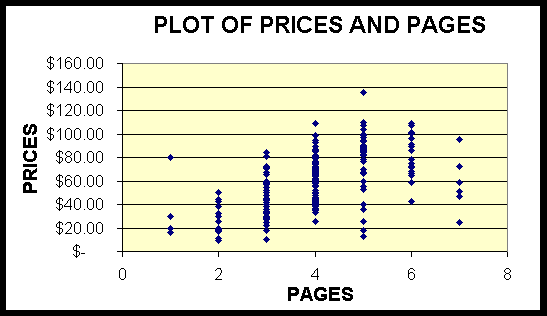
The above graph was created and analyzed. The numbers for 'pages' in
this graph corresponded to the page range variables as follows:
1 = under 150 pages
2 = 151 - 300 pages
3 = 301 - 500 pages
4 = 501 - 800 pages
5 = 801 - 1150 pages
6 = 1151 - 1500 pages
7 = over 1500 pages
The plot did not seem to indicate that a different model was needed for
lower priced textbooks. Surprisingly, the price for books with more pages
seemed to steadily rise with the page range until around 1000 to 1100
pages. At that point, there seemed to exist a condition of 'diminishing
returns' where more pages did not cost more money, and in many cases
actually cost less.
In order to more fully understand this situation, a correlation matrix
was created that examined data for the Model Two variables in correlation
with each other. The correlation data seemed to suggest that the above
plot could be explained by the relationship of different book subjects to
the number of pages and the book price.
More expensive books, such as calculus and other math books, did not
necessarily have a large number of pages. Many of these books were located
in the middle page ranges. On the other hand, many of the lower priced
textbooks, such as English books, had well over 1000 pages.
Model Three
Improvements for lower priced books could potentially be realized by
inserting the Model Two data in a format that utilizes a log-linear
equation. A third model was created using the same dependent variables
that had been used in Model Two. In Model Three the log of price was used
for the dependent variable, which established this as a log-linear
model.
| R-Square = 0.7158 |
Adj R-Square = 0.6959
|
| |
Parameter |
|
Confidence |
| Variables |
Estimate |
T-Value |
Level |
| Intercept |
2.7311 |
28.78 |
.0001 |
| Hard cover |
0.3273 |
7.12 |
.0001 |
| Graduate Student |
-0.1802 |
-2.95 |
.0035 |
| 301 - 500 Pages |
0.4445 |
5.47 |
.0001 |
| 501 - 800 Pages |
0.5957 |
7.93 |
.0001 |
| 801 - 1050 Pages |
0.6363 |
7.50 |
.0001 |
| 1051 or more Pages |
0.7283 |
8.19 |
.0001 |
| BUSACCMP |
0.6483 |
7.78 |
.0001 |
| Calculus |
0.9743 |
6.27 |
.0001 |
| BIOCHPHY |
0.6637 |
7.56 |
.0001 |
| Engineering |
0.7373 |
5.75 |
.0001 |
| English |
0.1893 |
2.16 |
.0323 |
| Mathematics |
0.6448 |
7.27 |
.0001 |
| GENERCLS |
0.5437 |
6.59 |
.0001 |
| Name publisher |
0.1176 |
2.97 |
.0034 |
Excluded variables: Soft cover, Undergraduate student, Under 300 pages,
History, Not-major publisher
This model also seemed to perform well. The R_Square of almost .72 was
quite similar to the R_Square value for Model Two. The T-Values and
confidence levels for most of the independent variables were excellent as
well. Unfortunately, testing led to Model Three's downfall.
Model Three was tested by inserting model parameter values to determine
book prices using college textbook descriptions. Some of the same quotes
from the data base that had been used to test Model Two were used to test
Model Three. Quotes were used that possessed a wide range of textbook
prices. In approximately 80% of the quotes tested the linear model
provided a better prediction of actual quote price than the log-linear
model.
To list an example, Model Two and Model Three parameter values were
applied to the textbook description for one particular mathematics book on
the CPI data base. The following were the results:
Actual quote price = $75.00
Predicted value using Model Two = $80.27
Predicted value using Model Three = $82.85
Therefore, the conclusion has been drawn that the Model Two linear
model has done a better job of modeling the college textbook entry level
item.
Model Two Usage in CPI
This researcher recommended that CPI management approve the Model Two
linear model for quality adjustment usage in College textbooks. In
the Spring of 2000, the CPI program management approved this model for use
in quality adjusting College textbook quotes. Announcements have
been made to the public beginning in April of 2000. Model usage is
scheduled to begin with the CPI for July 2000, in time for textbook
replacements in Autumn of 2000.
Hedonic Study Verification
In keeping with the CPI requirement that all hedonic studies must be
verified by other personnel skilled in the use of hedonics, this
college textbook hedonic study was reviewed and approved by staff
from BLS Price Index Number Research Division.3 Data from this
study have also been reviewed by the CPI Hedonics Team.
Further hedonics research is planned for college textbooks.
Experimental index calculations are planned using the data for the
upcoming Autumn college textbook quotes. Also, another hedonics
study using data from a newer CPI data base is planned within the next
year.
Notes
(1)"The Use of Hedonic Regressions to Handle Quality Change: The
Experience in the U.S. CPI;" by Dennis Fixler, Charles Fortuna, John
Greenlees, and Walter Lane, presented at the Fifth Meeting of the
International Working Group on Price Indices; August 1999.
(2)"Where the 'New' Textbook Dollar Goes",
www.nacs.org/public/research/higher_ed_retail.asp. These data reveal 75.9
cents of every dollar students pay for textbooks will be received by the
publishers. From this, 11.5 cents will be forwarded to the authors of the
textbooks. This leaves 64.4 cents out of every textbook dollar (or almost
65%) that will be retained by the publishers.
(3)The author wishes to thank Mary Kokoski of the BLS Price Index
Number Research Division for all of her contributions to the success of
this project.
Last Modified Date: October 16, 2001 |