8.1 Behavior of Two-Phase Systems
The definition of a phase, as given by SB&VW, is ``a quantity of
matter that is homogeneous throughout.'' Common examples of systems
that contain more than one phase are a liquid and its vapor and a
glass of ice water. A system which has three phases is a container
with ice, water, and water vapor.
We wish to find the relations between phases and the relations that
describe the change of phase (from solid to liquid, or from liquid
to vapor) of a pure substance, including the work done and the heat
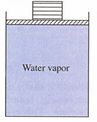
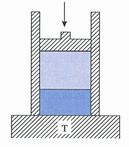
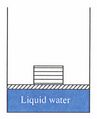
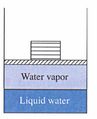
transfer. To start we consider a system consisting of a liquid and
its vapor in equilibrium, which are enclosed in a container under a
moveable piston, as shown in Figure 8.1. The
system is maintained at constant temperature through contact with a
heat reservoir at temperature  , so there can be heat transfer to
or from the system.
, so there can be heat transfer to
or from the system.
Figure 8.1:
Two-phase system in contact with
constant temperature heat reservoir
|
|
Figure 8.2:
 -
relation for a
liquid-vapor system
-
relation for a
liquid-vapor system
|
|
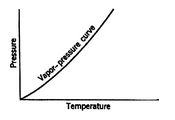
For a pure substance, as shown in
Figure 8.2, there is a one-to-one
correspondence between the temperature at which vaporization occurs
and the pressure. These values are called the saturation pressure
and saturation temperature (see Ch. 3 in SB&VW).
This means there is an additional constraint for a liquid-vapor
mixture, in addition to the equation of state. The consequence is
that we only need to specify one variable to determine the state of
the system. For example, if we specify
then
is set. In
summary, for two phases in equilibrium,  . If both phases are
present, any quasi-static process at constant
is also at
constant
.
. If both phases are
present, any quasi-static process at constant
is also at
constant
.
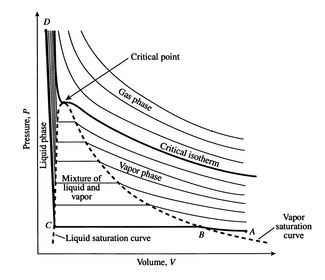
Let us examine the pressure-volume behavior of a liquid-vapor system
at constant temperature. For a single-phase ideal gas we know that
the curve would be
 . For the two-phase
system the curve looks quite different, as indicated in
Figure 8.3.
. For the two-phase
system the curve looks quite different, as indicated in
Figure 8.3.
Figure 8.3:
- diagram for
two-phase system showing isotherms
diagram for
two-phase system showing isotherms
|
|
Several features of the figure should be noted. First, there is a
region in which liquid and vapor can coexist, bounded by the liquid
saturation curve on the left and the vapor saturation curve on the
right. This is roughly dome-shaped and is thus often referred to as
the ``vapor dome.'' Outside of this regime, the equilibrium state
will be a single phase. The regions of the diagram in which the
system will be in the liquid and vapor phases respectively are
indicated. Second is the steepness of the isotherms in the liquid
phase, due to the small compressibility of most liquids. Third, the
behavior of isotherms at temperatures below the ``critical point''
(see below) in the region to the right of the vapor dome approach
those of an ideal gas as the pressure decreases, and the ideal gas
relation is a good approximation in this region.
The behavior shown is found for all the isotherms that go through
the vapor dome. At a high enough temperature, specifically at a
temperature corresponding to the pressure at the peak of the vapor
dome, there is no transition from liquid to vapor and the fluid goes
continuously from a liquid-like behavior to a gas-type behavior.
This behavior is unfamiliar, mainly because the temperatures and
pressures are not ones that we typically experience; for water the
critical temperature is
 and the associated
critical pressure is 220 atmospheres.
and the associated
critical pressure is 220 atmospheres.
There is a distinct nomenclature used for systems with more than one
phase. In this, the terms ``vapor'' and ``gas'' seem to be used
interchangeably. In the zone where both liquid and vapor exist,
there are two bounding situations. When the last trace of vapor
condenses, the state becomes saturated liquid. When the last
trace of liquid evaporates the state becomes saturated vapor
(or dry vapor). If we put heat into a saturated vapor it is referred
to as superheated vapor. Nitrogen at room temperature and pressure
(at one atmosphere the vaporization temperature of nitrogen is 77 K)
is a superheated vapor.
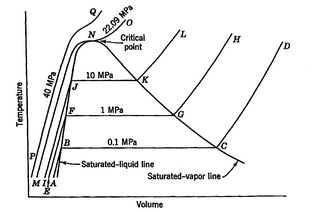
Figure 8.4:
Constant pressure curves in
-
coordinates showing vapor dome
|
|
Figure 8.4 shows lines of constant pressure in
temperature-volume coordinates. Inside the vapor dome the constant
pressure lines are also lines of constant temperature. It is useful
to describe the situations encountered as we decrease the pressure
or equivalently increase the specific volume, starting from a high
pressure, low specific volume state (the upper left-hand side of the
isotherm in Figure 8.3). The behavior in this
region is liquid-like with very little compressibility. As the
pressure is decreased, the volume changes little until the boundary
of the vapor dome is reached. Once this occurs, however, the
pressure is fixed because the temperature is constant. As the piston
is withdrawn, the specific volume increases through more liquid
evaporating and more vapor being produced. During this process,
since the expansion is isothermal (we specified that it was), heat
is transferred to the system. The specific volume will increase at
constant pressure until the right hand boundary of the vapor dome is
reached. At this point, all the liquid will have been transformed
into vapor and the system again behaves as a single-phase fluid. For
water at temperatures near room temperature, the behavior would be
essentially that of a perfect gas in this region. To the right of
the vapor dome, as mentioned above, the behavior is qualitatively
like that of a perfect gas.
Figure 8.5:
Specific volumes at constant
temperature and states within the vapor dome in a liquid-vapor
system
|
|
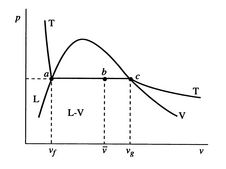
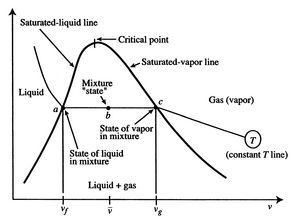
Referring to Figure 8.5, we define
notation to be used in what follows. The states  and
and  denote
the conditions at which all the fluid is in the liquid state and the
gaseous state respectively.
denote
the conditions at which all the fluid is in the liquid state and the
gaseous state respectively.
The specific volumes corresponding to these states are
For conditions corresponding to specific volumes between these two
values, i.e., for state  , the system would exist with part of the
mass in a liquid state and part of the mass in a gaseous (vapor)
state. The average specific volume for this condition is
, the system would exist with part of the
mass in a liquid state and part of the mass in a gaseous (vapor)
state. The average specific volume for this condition is
We can relate the average specific volume to the specific volumes
for liquid and vapor and the mass that exists in the two phases as
follows. The total mass of the system is given by
The volume of the system is
The average specific volume,
 , is the ratio of the
total volume to the total mass of the system
, is the ratio of the
total volume to the total mass of the system
The fraction of the total mass in the vapor phase is called
quality, and denoted by  :
:
In terms of the quality and specific
volumes, the average specific volume can be expressed as
In reference to Figure 8.6,
 ,
,
 .
.
Figure 8.6:
Liquid vapor equilibrium in a two-phase
medium
|
|
UnifiedTP
|
 []
[]
 []
[]