Given a charge distribution throughout all of space, the superposition integral can be used to determine the potential that satisfies Poisson's equation. However, it is often the case that interest is confined to a limited region, and the potential must satisfy a boundary condition on surfaces bounding this region. In the previous section, we recognized that any equipotential surface could be replaced by a physical electrode, and found solutions to boundary value problems in this way. The art of solving problems in this "backwards" fashion can be remarkably practical but hinges on having a good grasp of the relationship between fields and sources.
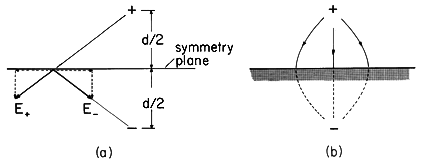
Symmetry is often the basis for superimposing fields to satisfy boundary conditions. Consider for example the field of a point charge a distance d/2 above a plane conductor, represented by an equipotential. As illustrated in Fig. 4.7.1a, the field E+ of the charge by itself has a component tangential to the boundary, and hence violates the boundary condition on the surface of the conductor.
Figure 4.7.1 (a) Field of positive charge tangential to horizontal plane is canceled by that of symmetrically located image charge of opposite sign. (b) Net field of charge and its image. To satisfy this condition, forget the conductor and consider the field of two charges of equal magnitude and opposite signs, spaced a distance 2d apart. In the symmetry plane, the normal components add while the tangential components cancel. Thus, the composite field is normal to the symmetry plane, as illustrated in the figure. In fact, the configuration is the same as discussed in Sec. 4.4. The fields are as in Fig. 4.4.2a, where now the planar= 0 surface is replaced by a conducting sheet.
This method of satisfying the boundary conditions imposed on the field of a point charge by a plane conductor by using an opposite charge at the mirror image position of the original charge, is called the method of images. The charge of opposite sign at the mirror-image position is the "image-charge."
Any superposition of charge pairs of opposite sign placed symmetrically on two sides of a plane results in a field that is normal to the plane. An example is the field of the pair of line charge elements shown in Fig. 4.5.6. With an electrode having the shape of the equipotential enclosing the upper line charge and a ground plane in the plane of symmetry, the field is as shown in Fig. 4.6.3. This identification of a physical situation to go with a known field was used in the previous section. The method of images is only a special case involving planar equipotentials.
To compare the replacement of the symmetry plane by a planar conductor, consider the following demonstration.
Demonstration 4.7.1. Charge Induced in Ground
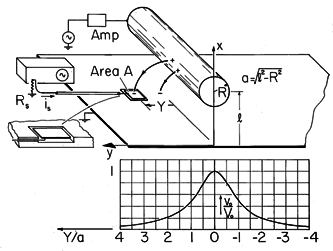
Charge Induced in Ground Plane by Overhead Conductor The circular cylindrical conductor of Fig. 4.7.2, separated by a distance l from an equipotential (grounded) metal surface, has a voltage U = Uo cos
t. The field between the conductor and the ground plane is that of a line charge inside the conductor and its image below the ground plane. Thus, the potential is that determined in Example 4.6.3. In the Cartesian coordinates shown, (4.6.18), the definitions of r1 and r2 with (4.6.19) and (4.6.25) (where U = V/2) provide the potential distribution
Figure 4.7.2 Charge induced on ground plane by overhead conductor is measured by probe. Distribution shown is predicted by (4.7.7).
The charge per unit length on the cylinder is [compare (4.6.27)]
In the actual physical situation, images of this charge are induced on the surface of the ground plane. These can be measured by using a flat probe that is connected through the cable to ground and insulated from the ground plane just below. The input resistance of the oscilloscope is low enough so that the probe surface is at essentially the same (zero) potential as the ground plane. What is the measured current, and hence voltage vo, as a function of the position Y of the probe?
Given the potential, the surface charge is (1.3.17)
Evaluation of this expression using (1) gives
Conservation of charge requires that the probe current be the time rate of change of the charge q on the probe surface.
Because the probe area is small, the integration of the surface charge over its surface is approximated by the product of the area and the surface charge evaluated at the position Y of its center.
Thus, it follows from (4)-(6) that the induced voltage, vo = -Rsis, is
This distribution of the induced signal with probe position is shown in Fig. 4.7.2.
In the analysis, it is assumed that the plane x = 0, including the section of surface occupied by the probe, is constrained to zero potential. In first computing the current to the probe using this assumption and then finding the probe voltage, we are clearly making an approximation that is valid only if the voltage is "small." This can be insured by making the resistance Rs small.
The usual scope resistance is 1 M\Omega. It may come as a surprise that such a resistance is treated here as a short. However, the voltage given by (7) is proportional to the frequency, so the value of acceptable resistance depends on the frequency. As the frequency is raised to the point where the voltage of the probe does begin to influence the field distribution, some of the field lines that originally terminated on the electrode are diverted to the grounded part of the plane. Also, charges of opposite polarity are induced on the other side of the probe. The result is an output signal that no longer increases with frequency. A frequency response of the probe voltage that does not increase linearly with frequency is therefore telltale evidence that the resistance is too large or the frequency too high. In the demonstration, where "desk-top" dimensions are typical, the frequency response is linear to about 100 Hz with a scope resistance of 1 M\Omega.
As the frequency is raised, the system becomes one with two excitations contributing to the potential distribution. The multiple terminal-pair systems treated in Sec. 5.1 start to model the full frequency response of the probe.
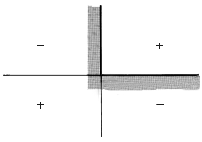
Symmetry also motivates the use of image charges to satisfy boundary conditions on more than one planar surface. In Fig. 4.7.3, the objective is to find the field of the point charge in the first quadrant with the planes x = 0 and y = 0 at zero potential. One image charge gives rise to a field that satisfies one of the boundary conditions. The second is satisfied by introducing an image for the pair of charges.
Once an image or a system of images has been found for a point charge, the same principle of images can be used for a continuous charge distribution. The charge density distributions have density distributions of image charges, and the total field is again found using the superposition integral.
Even where symmetry is not involved, charges located outside the region of interest to produce fields that satisfy boundary conditions are often referred to as image charges. Thus, the charge Q1 located within the spherical electrode of Example 4.6.4 can be regarded as the image of q.