
Deadlines
Useful links
channel.py -- virtual and IR channel interface
im1d.py -- image functions
brobot.png -- image
mandrils.png -- image
lab1.py -- lab1 functions
lab1_1.py -- template for Task #1
lab1_2.py -- template for Task #2
lab1_3.py -- template for Task #3
lab1_4.py -- template for Task #4
lab1.zip -- zip file with all of the above
Numpy docs,
tutorial,
examples
Matplotlib.pyplot
reference,
tutorial
Instructions
This lab is worth a total of 12 points.
You can work on your own machine or in the 6.02 lab (the departmental Athena cluster in 32-083), except for the Task 5, where you will need to use the infrared communications hardware in 32-083. We'll be staffing the lab and are happy to help with any questions you may have -- check the Lab Hours webpage for the schedule.
If you work on your own machine, you'll need to download and install the software we'll be using. Stand-alone installers exist for almost any modern computing environment. For package-based systems, there are packages you can install to supply the needed software. You'll need:
If you're working at home, use "idle -n" to edit and run your code -- an integrated development environment makes the work go more swifly.
If you use an Athena workstation, issue the "add 6.02" command to gain access to the 6.02 locker which has all the needed software installed. After adding the course locker, run the Python IDE using the idle602 command.
PLEASE NOTE: If you run Python files using the command "python filename.py", the matplotlib plots will NOT SHOW UP unless you sprinkle your code with p.show() commands. We recommend that you use idle602 -n on the Athena workstations, and at home use idle -n (or if you like, ipython), and run your programs inside the IDE. Of course, you are welcome to use what works best for you. When using the IR hardware, you must use idle602 or python602 as otherwise python will not know about the hardware.
Goal of Lab 1
In this first 6.02 lab, you will be examining the problem of sending greyscale images across a communication channel. We hope this concrete example will help you become familiar with some basic issues in analog and digital communication while also helping you become adept at using two tools that we will rely on extensively throughout the course, the matplotlib plotting function pyplot and the numpy.array object.
Background
Consider the problem of sending a greyscale image from one computer to another across a wire-link based communication system.
In general, images on a computer (or a digital camera) are stored as two-dimensional matrices of pixels, where in the case of greyscale images, each pixel is a single number that represents intensity. For our greyscale image implementation in Python, the intensity of a pixel is represented using a floating point number whose value is between zero and one. As one might expect, zero represents black, one represents white, and values in between represent shades of grey. Our Python implementation also uses a representation that collapses the two-dimensional matrix of pixels into a one-dimensional numpy array. As an example, in our implementation, a 64x64 pixel greyscale image is stored as a 4096-element numpy array of floating point numbers whose values are between zero and one. As you will see in the Python code fragments below, representing an image as a one-dimensional array makes subsequent processing simple, but one must somehow keep track of the number of rows in the original image. Aside from this caveat, using one-dimensional numpy arrays of floating point numbers to represent a greyscale image means that the problem of transmitting a 64x64 pixel image from one computer to another is now equivalent to finding a method for transfering 4096 floating point numbers across a communication channel.
Our physical communication channel is not really a wire link, it is an infrared (IR) free-space optical link, but we communicate with the link by sending and receiving voltage samples, where those samples are within the range zero volts to one volt. Voltage samples are sent and received from the optical link at a rate of four million samples every second, but, as we will soon learn, that does not mean we can send digital zeros and ones across the link at the voltage sample rate. Also, you will not need to manage the process of sending and receiving a voltage sample every quarter of a microsecond. We have provided an interface in Python that allows you to send and receive long numpy arrays of voltage samples. We have also implemented several "virtual" channels in Python, so you can experiment with simulated channels that have a variety of properties.
Given the above descriptions of our image representation and of our interface to the communication channel, it might seem that the image communication problem is trival. One can pretend that a numpy array of image intensity values is really an array of voltage sample values (both conveniently share the same zero to one value range), then feed the array to the communication channel interface, and have the receiving computer re-interpret the received numpy array of voltage samples as the intensity values for a received greyscale image. Such a strategy, examined in Task 2 below, is often referred to as an analog approach. This kind of analog image communication is still commonly used for interfacing computers to monitors, and until recently, was also used in broadcast television.
The digital approach to communicating images is a little more complicated. First, one has to convert the value for each pixel's intensity in to a sequence of bits (zeros and ones). In Tasks 3 and 4 below, eight bits are used represent each pixel, thereby reducing the extremely fine resolution of the floating point representation to only 256 distinct greyscale values, sufficient for most purposes. The result of this digitization is, for the example of a 64x64 pixel image, to convert a numpy array of 4096 floating point intensity values in to a 32,768 element numpy array of bits. But then the bits must be represented using multiple voltage samples, from dozens to hundreds depending on the channel's properties, as you will see in Task 1. Therefore, hundreds of thousands to perhaps millions of voltage samples will be needed to transmit the 32,768 bits generated from 4096 intensity values. Seems like quite a lot of voltage samples.
So, if using an analog communication approach allows us to send a 64x64 pixel image using only 4096 voltage samples, and a digital communication approach requires on the order of a million samples to send the same image, why use digital? Part of the answer will be clear by the end of this lab, part of the answer will require most of this coming term, and part of the answer is, well, unclear. Ask someone who lives in a rural area about digital broadcast TV.
Task 1: Plotting received data samples (1 point)
As alluded to above, many wire-based digital signaling systems transmit digital bits by converting the zeros and ones to sequences of low and high voltage samples applied to one end of a communication wire. The effect of the voltage changes at the transmitter end of the wire propagate to receiver end of the wire, producing voltage changes that are sampled by the receiver. The exact relationship between bits and sequences of voltage samples depends on the communication protocol, but typically a single data bit is represented by a sequence of voltage samples with one of two values.
If you examine the template for this task, lab1_1.py shown below, you will notice that a list of bits is being converted to voltage samples using the function bits_to_samples to prepare for transmission. With the parameter samples_per_bit set to 20, each one bit generates twenty samples with the voltage value of 1.0, and each zero bit generates twenty samples with the voltage value of zero. The function channel is an interface to a virtual channel (channel '0'), and returns a numpy array of voltage samples that represent a receiver's voltage samples. As one might expect, by the time the signal reaches the receiver, the transitions between zero volts and a positive voltage will not be immediate, and some amount of noise will added to the signal. We might also see some attenuation (i.e., reduced difference between the lowest and highest voltage).
For this task, please write a Python procedure plot_data that takes a single argument -- the numpy array representing the voltage samples at the receiver -- and plots it as a new figure using routines from the matplotlib.pyplot module.
Start by downloading channel.py and lab1.py to the directory in which you'll be doing your code development. The channel.py file contains the implementation of several virtual channels as well as an interface to the infrared optical channel, you will be using this file in subsequent labs. The lab1.py file contains support functions and testing functions. A third file, lab1_1.py, is a template for your Task #1 design file that shows how to use the testing code.
# lab1_1.py -- template for your Task #1 design file
import numpy
import matplotlib.pyplot as p
import channel
reload(channel)
import lab1
reload(lab1)

p.ion()  # interactive plot mode

def plot_data(data):
    """
    Create a new figure and plot data using blue, square markers.
    """

# Testing code.  Do it this way so we can import this file
# and use its functions without also running the test code.
if __name__ == '__main__':
    # supply a bit sequence
    bits = [1,0,1,1,0,0,0,1,0,0,0,1,1,1,0]

    # Convert bits (0's or 1's) to voltage samples
    # (between 0.0 and 1.0 volts)
    samples_per_bit=20
    samples = lab1.bits_to_samples(bits,samples_per_bit)

    # Create a noisy channel
    mychannel = channel.channel(channelid='0',noise=0.1)

    # Send the voltage samples over a noisy channel
    out = mychannel(samples)

    # Plot the received voltage samples
    plot_data(out)

    # enable the following line whey you're ready to submit
    # your code to the on-line server
    #lab1.checkoff(plot_data,'L1_1')
Using the controls on the matplotlib plot to zoom in and take some measurements, please answer the following questions (see the on-line lab questions link above).
Task 2: Sending Images as Analog Data (2 points)
Download im1d.py, which contains image support functions, and the image files brobot.png and mandrils.png. Also download lab1_2.py, the template for the Task #2 design. Please be sure to download all the files to the same directory as the Task 1 files.
# lab1_2.py -- template for your Task #2 design file
import numpy
import matplotlib.pyplot as p
import channel
reload(channel)
import im1d
reload(im1d)
import lab1
reload(lab1)

p.ion()   # interactive plot mode

def fix_image(rcvdimage, orig_length, mark_length):
    """
    Your delay eliminating program goes here, you should return
    a numpy array of floats of length orig_length.
    """
    return rcvdimage

# testing code.
if __name__ == '__main__':

    # Read in a .png image as array of greyscale values
    # between 0.0 and 1.0
    image = im1d.im1dread("brobot")
    num_pixels = len(image)

    # Show the image
    im1d.im1dshow(image,rows=512)

    # Create a noisy channel
    mychannel = channel.channel(channelid='2',noise=0.1)

    # Treat the image data as voltages and just send through
    # noisy channel
    rcvdimage = mychannel(image)

    # Show the rcvd image
    p.figure()
    im1d.im1dshow(rcvdimage,rows=512)

    # Mark the start of an image with twenty voltage
    # samples = 1.0 volt followed by twenty zero volt samples
    mark_len = 20
    # Create an array of all ones
    marked = numpy.ones(2 * mark_len + num_pixels)
    # Overwrite the samples after the ones part of the mark
    # with zeros
    marked[mark_len:2*mark_len] = 0
    # Overwrite image
    marked[2*mark_len:] = image[:]

    # Create a noisy channel with random delay and padding
    mychannel = channel.channel(channelid='2',noise=0.1,
                                random_tails=200)

    # Send image through noisy, random delayed, random padded
    # channel
    rcvdimage = mychannel(marked)

    # Show the rcvd image assuming no delay
    # try running a few times)
    p.figure()
    im1d.im1dshow(rcvdimage[2*mark_len:2*mark_len+len(image)],
                  rows=512)

    # Show the fixed rcvd image based
    fixed_image = fix_image(rcvdimage, num_pixels, mark_len)
    if len(fixed_image) == num_pixels:
        # Get a new figure
        p.figure()
        im1d.im1dshow(fixed_image,rows=512)
    else:
        print "Image from fix_image NOT the right size!!!"

    # enable the following line whey you're ready to submit
    # your code to the on-line server
    #lab1.checkoff(fix_image,'L1_2')
The lab1_2.py file has an implementation of the analog strategy for transmitting images described above. If you run the file as is, you should see three grayscale images. The first image is the 512x512 greyscale image read in from the file brobot.png, the second image is the result of sending the image intensities as voltage samples in to a noisy communication channel (in this case, virtual channel '2'). The third image is the result of sending the image intensities as voltage samples in to a noisy communication channel that also has random delay and pads the result with a random number of extra samples (both are common in communication channels). If the third image looks similar to the second image, rerun the file to get a different random delay.
The distortion of the image due to noise and slow channel response is bad, but when there is a delay, the right side of the image shows up on the left, an even more disturbing effect. If you examine lab1_2.py, you will notice that there is a version of the transmitted image, in the numpy array marked, with a forty-sample "mark" (twenty one volt samples followed by 20 zero volt samples). This marked version of the image, the length of the original image, and the length of the mark should all be passed in to the function fix_image. The function fix_image should then return a version of the received image, but with the delay and padding removed. Please write this function, but do not expect it to work perfectly. Also, think about how you will detect the mark (insisting that you find all twenty 1.0's in the mark is unlikely to succeed). Finally, you may find it helpful to examine plots generated by your task 1 function, though change the channelid in the Task 1 file from '0' to '2'.
Task 3: Recover digital data (3 points)
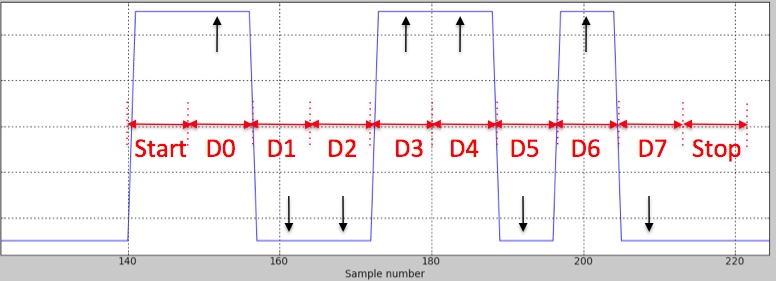
In this task you will be using the digital communication approach to image transmission as described in the background section above. As you will notice when examining the template file for this task, the voltage samples sent to the channel are generated from a numpy array of floating point numbers that represent the 64x64 pixel greyscale image from the file mandrils.png. The numpy array of floating point numbers is then converted to a numpy array of bits, where eight bits are used to represent each floating point number. Then the sequence of bits are encoded as described below, finally the encoded bits are converted to voltage samples and sent to the channel. In the discussion below, we'll use "bit" to refer to a message bit, "word" to refer to a byte of data (eight bits), "voltage sample" to refer to a sampled voltage value and "digitized sample" to refer to a digitized voltage sample. The bit encoding converts eight bits of data, or a word, at a time using the following wire protocol:
The following figure shows the transmission of the 8-bit word 01011001 using eight samples per bit. After the encoding, a total of 10 bits are sent: the start bit, eight data bits and a stop bit. The black arrows mark the samples which the receiver should use to determine whether the received data bit is 0 or 1. Note that, as shown in the figure, the the least-significant bit (LSB) is transmitted first. If bits are received and then appended to a list, then printing that list would yeild 1100110100.
Write a Python procedure receive that takes a single argument -- a numpy array of sampled voltages -- and returns a numpy array of bits.
Some hints:
# lab1_3.py -- template for your Task #3 design file
import numpy
import matplotlib.pyplot as p
import channel
reload(channel)
import lab1
reload(lab1)
import im1d
reload(im1d)

p.ion()

def receive(samples,samples_per_bit):
    """
    Convert an array of voltage samples in to bits and return a numpy array
    of bits.
    """
    return []

# testing code.  Do it this way so we can import this file
# and use its functions without also running the test code.
if __name__ == '__main__':

    # Read in a .png image as array of greyscale values
    # with pixel values between 0.0 and 1.0
    image = im1d.im1dread("mandrils")
    num_pixels = len(image)

    # Show the image
    p.figure()
    im1d.im1dshow(image, rows=64)

    # Turn the image into a sequence of bits
    bits = lab1.farray_to_bits(image)

    # encode 8-bit blocks
    encoded = lab1.encode_bits(bits)

    # Convert encoded image in to samples
    samples_per_bit = 8
    samples = lab1.bits_to_samples(encoded,samples_per_bit)

    # Create a noise-free channel
    mychannel = channel.channel(channelid='0',noise=0.0,
                                random_tails=0)

    # Send image noise-free, no delay channel
    rcvd_samples = mychannel(samples)

    # Your program to receive the bit stream
    rcvd_bits = receive(rcvd_samples,samples_per_bit)

    # Turn sequence of bits into an image
    rcvd_image = lab1.bits_to_farray(rcvd_bits)

    # Show the image
    if rcvd_image != []:
        p.figure()
        im1d.im1dshow(rcvd_image,rows=64)

    # enable the following line whey you're ready to submit
    # your code to the on-line server
    #lab1.checkoff(receive,'L1_3')
While debugging your code, you might want to modify the test to first try a single eight bit message. You can use the plot_data function implemented in Task #1 to visualize what's in the various arrays.
When your implementation of receive works, remove the comment from the checkoff line and complete the submission to the on-line system.
Task 4: Modern digital signaling protocols (3 points)
The simple START/STOP bit wire protocol described above is used in the RS-232 standard for sending data at modest rates (up to around 100,000 bits per second). It's quite serviceable but there's room for improvement:
To address these issues we use can an encoder at the transmitter to recode the message bits into a sequence that has the properties we want, and use a decoder at the receiver to recover the original message bits. Many of today's high-speed data links (e.g., PCI-e and SATA) use an 8b/10b encoding scheme developed at IBM. The 8b/10b encoder converts 8-bit message symbols into 10 transmitted bits. There are 256 possible 8-bit words and 1024 possible 10-bit transmit symbols, so one can choose the mapping from 8-bit to 10-bit so that the the 10-bit transmit symbols have the following properties:
Here's how the encoder works: collections of 8-bit words are broken into small groups of words (16 words/group in this task) called a packet. The last packet is padded with the NULL word if the message doesn't happen to be an exact multiple of 16 symbols. Each packet is sent using the following wire protocol:
Multiple packets are sent until the complete message has been transmitted. Note that there's no particular specification of what happens between packets -- the next packet may following immediately, or the transmitter may sit idle for a while, sending 0 samples.
Write a Python procedure receive that takes a single argument -- a numpy array of sampled voltages -- and returns a numpy array of bits from the words that have been sent using the 8b/10b encoder and the packet protocol described above. Here's how to proceed:
This step produces a sequence of received bits; we're done with the sample array and will use the bits produced by this step for the rest of the receive process.
lab1_4.py is a template file for this task. The main function reads the image, converts the image data to bits, encodes the bits using an 8b/10b encoder, generates voltage samples, send the samples through the channel, calls your receive_8b10b function with the received samples, and uses your returned data as an image and displays it.
# lab1_4.py -- template for your Task #4 design file
import numpy
import matplotlib.pyplot as p
import channel
reload(channel)
import lab1
reload(lab1)
import im1d
reload(im1d)

p.ion()


def receive_8b10b(samples,samples_per_bit):
    """
    Convert an array of voltage samples transmitted by
    a 8b/10b encoder into a sequence of bits. Return the sequence of bits
    as a numpy array.
    """
    return []


# testing code.  Do it this way so we can import this file
# and use its functions without also running the test code.
if __name__ == '__main__':
    # Read in a .png image as array of greyscale values
    # with pixel values between 0.0 and 1.0
    image = im1d.im1dread("mandrils")

    # Number of pixels in the image
    num_pixels = len(image)

    # Show the image
    p.figure()
    im1d.im1dshow(image, rows=64)

    # Turn the image in to a sequence of bits
    bits = lab1.farray_to_bits(image)

    # encode 8-bit blocks
    encoded = lab1.encode_bits_8b10b(bits)

    # Convert encoded image in to samples
    # The fractional value for samples_per_bit models clock
    # drift between the transmitter and receiver.  In order to
    # work correctly, your code should resynchronize where it's
    # sampling each bit whenever it sees a transition.
    samples_per_bit=8.3
    samples = lab1.bits_to_samples(encoded,samples_per_bit)

    # Create channel with noise and random delay and padding
    mychannel = channel.channel(channelid='0',noise=0.1,
                                random_tails=300)

    # Send samples through channel with noise and random delay
    # and padding
    rcvd_samples = mychannel(samples)

    # Your program to receive the bit stream
    samples_per_bit=8
    rcvd_bits = receive_8b10b(rcvd_samples, samples_per_bit)

    # Turn sequence of bits into an image
    rcvd_image = lab1.bits_to_farray(rcvd_bits)

    # Show the image
    if rcvd_image != []:
        p.figure()
        im1d.im1dshow(rcvd_image,rows=64)

    # enable the following line whey you're ready to submit
    # your code to the on-line server
    #lab1.checkoff(receive_8b10b,'L1_4')
You'll probably want to define some additional helper functions as we did for Task #3. And you can replace the long message in the test with a shorter one when debugging your code.
As before, enable the call to lab1.checkoff when you're ready to submit your task file on-line.
Task 5: Using the Infrared Optical System (1 point)
In the earlier tasks, you used software models of transmission channels, but for this task you will use our specially designed infrared optical communication hardware. To use the hardware, you must be logged into one of the Athena workstations in 32-083 that has the infra-red system attached via USB.
PLEASE DISCONNECT THE POWER FOR THE IR BOARD AND THEN RECONNECT IT BEFORE USING THE BOARD. You should see a small green LED flashing slowly on the board if power is connected.
YOU MUST USE idle602 -n or python602 or the IR hardware will be unknown to Python.
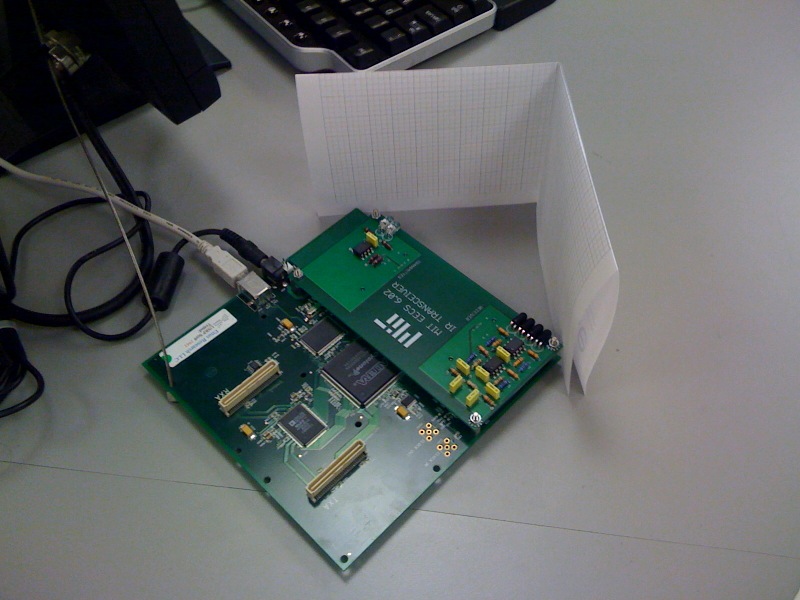
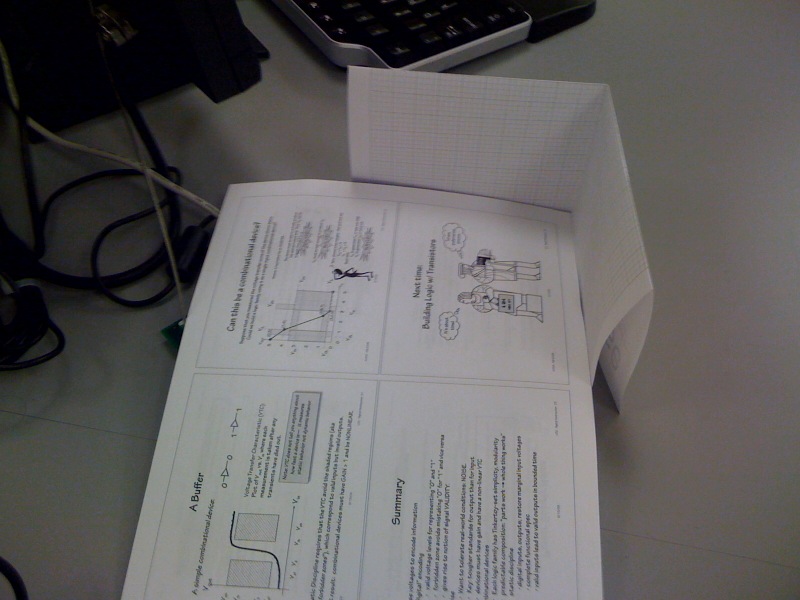
Note that the IR channel is very sensitive the noise generated by flourescent lights -- We recommend starting with a relatively "dark" environment for the channel. Below are some pictures showing a set-up that seems to work well. The picture on the left shows a reflector constructed from an 8.5x11 sheet folded lengthwise then creased in the middle to form a right angle. You'll want to place the reflector about 6 inches from the board -- the photodetectors are very sensitive and saturate if the incoming IR signal is too strong.
For this task, please change the channelid parameter in Task 1 from '0' to 'ir', set the noise argument of the channel function to zero, and then run the task while connected to the IR hardware. Examine the plotted results and try to determine what value to use for samples_per_bit so that bits are easily distinguished (note: the number of samples_per_bit needed will be much larger than 20).
Once you have determined a reasonable value for samples_per_bit, please change the channelid in Task 4 to 'ir', set the noise and random_tails arguments of the channel function to zero, and then run the task while connected to the IR hardware. If you wrote your Task 4 program carefully, you should be able to receive the correct image.
If you have time, see how far you can move the reflector from the board and still receive the image correctly.