Reading 13: Debugging
Software in 6.031
Objectives
The topic of today’s class is systematic debugging.
Sometimes you have no choice but to debug – particularly when the bug is found only when you plug the whole system together, or reported by a user after the system is deployed, in which case it may be hard to localize it to a particular module. For those situations, we can suggest a systematic strategy for more effective debugging.
A good book about systematic debugging is Why Programs Fail by Andreas Zeller. Much of this reading is inspired by that book.
Finally, Debugging: The Nine Indispensable Rules for Finding Even the Most Elusive Software and Hardware Problems by David Agans is a readable, eminently practical guide to debugging in a variety of technical situations, from software to hardware to cars to plumbing. We refer to several of the Nine Rules in this reading.
Reproduce the bug
Start by finding a small, repeatable test case that produces the failure. If the bug was found by regression testing, then you’re in luck; you already have a failing test case in your test suite. If the bug was reported by a user, it may take some effort to reproduce the bug. For graphical user interfaces and multithreaded programs, a bug may be hard to reproduce consistently if it depends on timing of events or thread execution.
Nevertheless, any effort you put into making the test case small and repeatable will pay off, because you’ll have to run it over and over while you search for the bug and develop a fix for it. Furthermore, after you’ve successfully fixed the bug, you’ll want to keep the test case in your regression test suite, so that the bug never crops up again. Once you have a test case for the bug, making this test work becomes your goal.
Here’s an example. Suppose you have written this function:
/**
 * Find the most common word in a string.
 * @param text string containing zero or more words, where a word
 *     is a string of alphanumeric characters bounded by nonalphanumerics.
 * @returns a word that occurs maximally often in text, ignoring alphabetic case.
 */
function mostCommonWord(text:string):string {
    ...
}
A user passes the whole text of Shakespeare’s plays into your method, something like mostCommonWord(allShakespearesPlaysConcatenated), and discovers that instead of returning a predictably common English word like "the" or "a", the method returns something unexpected, perhaps "e".
Shakespeare’s plays have 100,000 lines containing over 800,000 words, so this input would be very painful to debug by normal methods, like print-debugging and breakpoint-debugging. Debugging will be easier if you first work on reducing the size of the buggy input to something manageable that still exhibits the same (or very similar) bug:
- does the first half of Shakespeare show the same bug? (Binary search! Always a good technique. More about this below.)
- does a single play have the same bug?
- does a single speech have the same bug?
Once you’ve found a small test case, find and fix the bug using that smaller test case, and then go back to the original buggy input and confirm that you fixed the same bug.
reading exercises
Find the bug using the scientific method
To localize the bug and its cause, you can use the scientific method:
Study the data. Look at the test input that causes the bug, and examine the incorrect results, failed assertions, and stack traces that result from it.
Hypothesize. Propose a hypothesis, consistent with all the data, about where the bug might be, or where it cannot be. It’s good to make this hypothesis general at first.
Experiment. Devise and run an experiment that tests your hypothesis. It’s good to make the experiment an observation at first – a probe that collects information but disturbs the system as little as possible.
Repeat. Add the data you collected from your experiment to what you knew before, and make a fresh hypothesis. Hopefully you have ruled out some possibilities and narrowed the set of possible locations and reasons for the bug.
This kind of deliberate process isn’t needed for every bug. With good fail-fast design, you’ll hopefully get an exception very close to the source of the bug, the stack trace will lead you right to it, and the mistake will be obvious from inspecting the code. So when do you need to apply the scientific method? A good rule of thumb is the 10-minute rule. If you’ve spent 10 minutes hunting for a bug using ad hoc, unsystematic inspection, then it’s time to take a step back and start applying the scientific method instead.
As part of this transition, you should also move your debugging process out of your head – which has a very limited working memory of what you’ve tried and what you’ve learned from it – and start taking notes, either on paper or on your laptop. In each iteration of the process, you’ll be writing down:
- Hypothesis. Based on what you’ve learned so far, what’s your next hypothesis about the location or cause of the bug?
- Experiment. What are you about to try that will shed light on the hypothesis, by verifying or falsifying it?
- Predictions. What do you expect, based on your hypothesis, to be the result of the experiment?
- Observations. What actually happened when you did the experiment?
These kinds of questions should be very familiar to you from your past experience in science classes. In the next few sections, we’ll see what kind of form they take when you’re debugging code. In debugging, some hypotheses and some experiments are better than others.
reading exercises
The process that we already discussed for simplifying a bug report down to a simple test case is an example of applying the scientific method. For each of these moments in a particular test-simplification process, which step of the scientific method above is being applied?
A user reports that mostCommonWord("chicken chicken chicken beef") returns "beef" instead of "chicken".
(missing explanation)
Maybe the particular words “chicken” and “beef” don’t cause the failure – what matters is the number of times they occur.
(missing explanation)
Run a test case mostCommonWord("a a a b").
(missing explanation)
1. Study the data
One important form of data is the stack trace from an exception. Practice reading the stack traces that you get, because they will give you enormous amounts of information about where and what the bug might be.
In a typical stack trace, the latest call is on top, and the oldest call is on the bottom. But the calls at the top or bottom of the stack may be library code that you didn’t write. Your own code — where the bug is most likely to be — is often somewhere in the middle. Don’t let that dissuade you. Scan through the stack trace until you see something familiar, and then find it in your code.
reading exercises
Suppose Ben Bitdiddle is working on a TypeScript program, and gets this stack trace:
     Error: ENOENT: no such file or directory, open 'art-coordinates.txt'
      at Object.openSync (fs.js:476:3)
      at Object.readFileSync (fs.js:377:35)
      at Object.drawPersonalArt (src/TurtleSoup.ts:92:5)
      at Context. (test/TurtleSoupTest.ts:13:9)
      at processImmediate (internal/timers.js:461:21)
What line of code actually threw the exception?
filename:
line number:
When the exception was thrown, what was the last line being executed in Ben’s own code?
filename:
line number:
What was the entry point to Ben’s code, i.e. what line of Ben’s own code was called first in this stack trace?
filename:
line number:
(missing explanation)
2. Hypothesize
The point where the program actually failed, by throwing an exception or producing a wrong answer, isn’t necessarily where the bug is. The buggy code may have propagated some bad values through good parts of the program before it eventually failed. So your hypotheses should be about where the bug actually is (or is not), and what might have caused it.
It can help to think about your program as a flow of data, or steps in an algorithm, and try to rule out whole sections of the program at once.
Let’s think about this in the context of the mostCommonWord() example, fleshed out a little more with three helper methods:
/**
 * Find the most common word in a string.
 * ...
 */
function mostCommonWord(text:string):string {
    let words:Array<string> = splitIntoWords(text);
    let frequencies:Map<string,number> = countOccurrences(words);
    let winner:string = findMostFrequent(frequencies);
    return winner;
}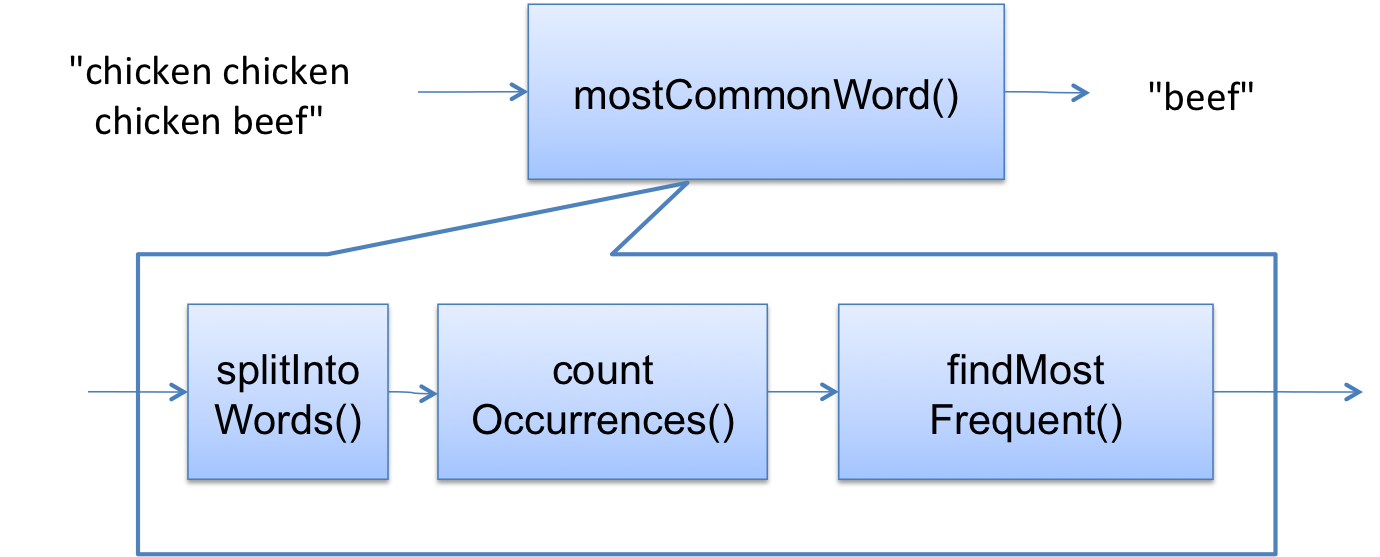
The flow of data in mostCommonWord() is shown at right.
Suppose that we’re getting an unexpected exception in countOccurrences().
That’s the failure that we’re investigating.
Then we can rule out everything downstream of that point as a possible location for the bug.
There’s no point in looking for the bug in findMostFrequent(), for example, because it hasn’t even been executed yet when the failure occurs.
So here are some hypotheses consistent with the information we have so far. They’re listed in reverse order of time from the failure:
- the bug is in
countOccurrences: its input is valid but then it throws an exception - the bug is in the connection between
splitIntoWordsandcountOccurrences: both methods meet their contracts, but the postcondition guaranteed by the former doesn’t satisfy the precondition expected by the latter - the bug is in
splitIntoWords: its input is valid but it produces bad output - the bug is in the original input to
mostCommonWord:textdoesn’t satisfy the precondition of the whole method
Which hypothesis to try first? Debugging is a search process, and you can use binary search to speed up the process. To do a binary search, you could divide this dataflow in half, perhaps guessing that the bug is in the connection between the first helper method and the second, and use one of the experiments below (like print statements, breakpoints, or assertions) to check the value there. From the answer to that experiment, you would know whether to pursue the bug in the earlier half of the dataflow or the later half.
Slicing
The mostCommonWord() data flow we just looked at is an example of slicing, which means finding the parts of a program that contributed to computing a particular value.
When you have a failure — a bad value at a particular point in the program — the slice for that value consists of the lines of the program that helped compute that bad value.
The bug that caused the bad value lies somewhere in that slice, so that’s your search space.
Automated tools for program slicing do exist, though they are not very practical yet. But programmers also do slicing naturally, in their heads, when looking at code to generate a hypothesis about where a bug might or might not be. It’s a useful skill for reasoning about programs, so let’s understand it better.
Here’s an example.
Suppose x is a local number variable which is not supposed to exceed 100.
At some point a debugging print statement reports that it has gone bad:
let x:number = 0; // must be <= 100
...
console.log("x=" + x); // prints a value much greater than 100
What is the slice for this bad value?
What lines of code helped compute the large value that x has when it reaches that print statement?
Let’s dig into the ... in the code above to find what code might be responsible.
Lines that directly change the value of x are part of the slice:
let x:number = 0; // must be <= 100
...
    x += bonus;
...
console.log("x=" + x); // prints a value much greater than 100
The value of bonus at that point also contributes to the value of x, so that means that its slice does too. So we have to look at the lines that helped compute bonus at that point:
let x:number = 0; // must be <= 100
const bonus:number = getBonus();
...
    x += bonus;
...
console.log("x=" + x); // prints a value much greater than 100
So the function getBonus() is now included in the slice, because it was responsible for computing bonus.
(Technically we only need to include the slice of its return value, but we can simplify and just say that getBonus() itself is suspect.)
The slice also includes control statements that affected the execution of statements already in the slice:
let x:number = 0;
const bonus:number = getBonus();
...
  if (isWorthABonus(s)) {
    x += bonus;
  }
...
console.log("x=" + x); // prints a value much greater than 100
The if statement around x += bonus is part of the slice because it controls whether or not x was actually changed at that point.
This also pulls in the function isWorthABonus(), and the value of s and its slice:
let x:number = 0;
const bonus:number = getBonus();
...
for (const s of salesList) {
  ...
  if (isWorthABonus(s)) {
    x += bonus;
  }
  ...
}
...
console.log("x=" + x); // prints a value much greater than 100
The enclosing for statement is included in the slice for two reasons: because it’s part of the slice of s, so it affects the if statement which is already in our slice, and because it affects the number of times that statements in our slice are executed (the if statement and x += bonus).
And now, because the for uses the variable salesList, we have to include its slice as well. It happens to be a function parameter:
function calculateTotalBonus(salesList:Array<Sale>):number {
  ...
  let x:number = 0;
  const bonus:number = getBonus();
  ...
  for (const s of salesList) {
    ...
    if (isWorthABonus(s)) {
      x += bonus;
    }
    ...
  }
  ...
  console.log("x=" + x); // prints a value much greater than 100
  ...
}
We could dig further and see where salesList came from in the rest of the program, but let’s stop there for now.
We’ve found the lines of code in this method that might be responsible for the bad value of x we discovered.
Studying these lines can generate some useful hypotheses:
- from the
x+=bonusstatement: maybebonusis very large, sox+=bonusimmediately goes out of range. This hypothesis would further imply thatgetBonus()returned a large value forbonus. - from the
ifstatement: maybeisWorthABonus()returns true for too many sales, so the sum accumulated inxgrows beyond 100. - from the
forloop: maybe the entire loop is executing over too many sales, again makingxtoo large from all the bonuses. - from the method signature: maybe a bad value is being passed in for
salesList, with far too many sales on it.
The upshot is that careful slicing – which you can do just by reading the code – can help you systematically identify places where the bug could be, and also where it could not be.
We can rule out the ... code in this example, because it doesn’t contribute to the bad value of x.
It’s worth noting that our design choices can help or hinder the efficiency of reasoning by slicing.
One such design choice is immutability.
When we were slicing for the value of bonus, and saw that its declaration was const bonus:number = getBonus(), we immediately knew that we didn’t have to look any further – no other lines can be in the slice for bonus, because it’s an unreassignable reference to an immutable value.
Immutability saved us a lot of time in reasoning and searching.
When we saw const s of salesList though, we didn’t have quite the same confidence.
Certainly s could never be reassigned within the body of the loop, but if the element type of salesList (Sale) is a mutable type, we would have to check the subsequent ... code to make sure no mutators were called on s or other aliases of the Sale object.
Another design choice that helps slicing is scope minimization. All the variables in this example were local variables, with minimal scope, so we only had to look close by for lines of code that might affect them. With instance variables, the slicing search might have to expand to include the entire class. For a global variable (gasp), the search expands to include the entire program.
reading exercises
In the following code, which lines are part of the slice for the value of the variable tax at the end of the code?
let total:number = 0.0;
let tax:number = 0.0;
let taxRate:number = 0.06;
for (const item of items) {
  let price:number = item.getPrice();
  total += price;
  if (isOutOfStateCustomer) {
    taxRate /= 2;
  }
  if (item.isTaxable()) {
    tax += price * taxRate;
  }
}
total += tax;
return total;(missing explanation)
Delta debugging
The process of isolating a small test case may also give you data that helps form a hypothesis, if it uncovers two closely-related test cases that bracket the bug, in the sense that one succeeds and one fails.
For example, maybe mostCommonWords("c c, b") is broken, but mostCommonWords("c c b") is fine.
Now you can examine the difference between the execution of these two test cases to help form your hypothesis.
Which code is executed for the passing test case, but skipped for the failing test case, and vice versa?
One hypothesis is that the bug lies in those lines of code, the delta between the passing run and the failing run.
This is a specific example of a general idea in bug finding called delta debugging, in which you compare successful runs with failing runs to try to localize the bug. Another kind of delta debugging is useful when a regression test starts failing. Using your version control system, you retrieve the most recent version that still passed the test, and then systematically explore the code-changes between the older working version and the newer failing version, until you find the change that introduced the bug. Delta debugging tools can automate this kind of search process, though like slicing tools they are not widely used yet.
Prioritize Hypotheses
When making your hypothesis, you may want to keep in mind that different parts of the system have different likelihoods of failure. For example, old, well-tested code is probably more trustworthy than recently-added code. TypeScript library code is probably more trustworthy than yours. The TypeScript compiler and runtime, operating system platform, and hardware are increasingly more trustworthy, because they are more tried and tested. You should trust these lower levels until you’ve found good reason not to.
reading exercises
Suppose you are debugging the quadraticRoots function, which appears to be producing wrong answers sometimes.
/**
 * Solves quadratic equation ax^2 + bx + c = 0.
 *
 * @param a quadratic coefficient, requires a != 0
 * @param b linear coefficient
 * @param c constant term
 * @returns a list of the real roots of the equation
 */
function quadraticRoots(a:number, b:number, c:number):Array<number> { ... }
Put the following items in the order that you should try them: 1, 2, 3, 4.
(missing explanation)
3. Experiment
Your hypothesis should lead to a prediction, such as “I think variable x has a bad value at this point” or even “I think this code is never executed.”
Your experiment should be chosen to test the prediction.
The best experiment is a probe, a gentle observation of the system that disturbs it as little as possible.
One familiar probe is a print statement.
Print debugging has the advantage that it works for virtually every programming language.
It has the disadvantage that it makes a change to the program, which you have to remember to revert.
It’s too easy to end up with a program littered with print statements after a long debugging session.
It’s also wise to be a little thoughtful when you write a debugging print statement.
Rather than printing the same hi! in fifteen different places to trace how the program is executing, and losing track of which is which, print something clear and descriptive like start of calculateTotalBonus.
A more elaborate kind of print debugging is logging, which keeps informative print statements permanently in the code and turns them on or off with a global setting, like a boolean DEBUG constant or a log level variable.
A simple version of the log-level idea is found in the standard JavaScript console API, which not only offers console.log(), but also console.info(), console.warn(), and console.error(), representing increasingly-higher levels of importance for the message being displayed.
The console framework allows the user to filter the log output to hide less-important messages, and messages sent to the most critical log levels, like console.error(), are often displayed in red so that they stand out regardless of the filter.
A more sophisticated logging framework like winston can also direct logging to a file or to a server across the network, can log structured data as well as human-readable strings, and can be used in deployment, not just development.
Large, complex systems would be very hard to operate without logging.
Another kind of probe is an assertion that tests variable values or other internal state.
In the example above where x is never allowed to exceed 100, we could insert assert(x <= 100); as a probe at any point.
Assertions have the advantage that they don’t require you to inspect output by hand, and can even be left in the code after debugging if the test is universally true (some debugging assertions are only true for the specific test case you’re debugging, and those would need to be removed).
Assertions have the disadvantage that in many languages (such as Java), they’re not turned on by default, so you can be fooled by an assertion that seems to be passing but is actually not even running.
We talked about this problem in a previous reading.
A third kind of probe is setting a breakpoint with a debugger, which stops the running program at that point, and allows you to single-step through the program and inspect values of variables. A debugger is a powerful tool that rewards the effort put into learning how to use it.
reading exercises
Here is some code that has been successfully debugged, but still has some debugging probes left in it:
/**
 * Convert from one currency to another.
 * @param fromCurrency currency that customer has (e.g. DOLLAR)
 * @param fromValue value of fromCurrency that customer has (e.g. $145.23)
 * @param toCurrency currency that customer wants (e.g. EURO).
 *                   Must be different from fromCurrency.
 * @returns value of toCurrency that customer will get,
 *         after applying the conversion rate and bank fee
 */
function convertCurrency(fromCurrency:Currency, fromValue:number, toCurrency:Currency):number {
  assert(fromCurrency !== toCurrency);

  let rate:number = getConversionRate(fromCurrency, toCurrency);
  console.log("conversion rate is " + rate);

  let fee:number = getFee();
  assert(fee === 0.01); // right now the bank charges 1%

  return fromValue * rate * (1-fee);
}
Which lines should be removed before committing and pushing?
(missing explanation)
For this exercise, you’ll need to use Visual Studio Code.
- Download ex13-debugging.zip and unpack it.
- Run
npm installto install its modules. - Then open the
ex13-debuggingfolder in Visual Studio Code.
The project has one source file, in src/Hailstone.ts:
/**
 * Compute a hailstone sequence.
 * @param n  starting number for sequence.  Assumes n > 0.
 * @returns hailstone sequence starting with n and ending with 1.
 */
function hailstoneSequence(n:number):Array<number> {
    let array:Array<number> = [];
    while (n !== 1) {
        array.push(n);
        if (n % 2 === 0) {
            n = n / 2;
        } else {
            n = 3 * n + 1;
        }
    }
    array.push(n);
    console.log(maxOfArray(array));
    return array;
}

/**
 * @param array must be nonempty
 * @returns maximum value of array
 */
function maxOfArray(array:Array<number>):number {
    let max = Number.NEGATIVE_INFINITY;
    for (const n of array) {
        max = Math.max(max, n);
    }
    return max;
}

console.log("hailstoneSequence(5)=", hailstoneSequence(5));
Set a breakpoint on line 9 (array.push(n)), either by right-clicking to the left of the line number and choosing Add Breakpoint, or just clicking there to toggle the breakpoint.
You should see a red dot appear on that line, and remain even after you move the mouse away.
Then go to the Run pane using View → Run, and click the green arrow next to Run npm start at the top of the pane.
This runs the program in the debugger.
It should stop at the breakpoint.
How many elements are in array at this point? (Use the Variables pane to find out.)
(missing explanation)
Now look for the Step Over command, found as Run → Step Over in the menubar, but also as a toolbar button in the top right corner of the Visual Studio Code window, which is more convenient to use repeatedly. Be careful to distinguish between Step Over and Step Into:
- Step Over runs all the code on the current line and then moves to the next line.
- Step Into enters the next method call on the current line, so it may jump to a method definition in very different part of the program. Step Into takes a smaller, more fine-grained step than Step Over.
Use Step Over to step over 6 statements.
How many elements are in array now?
(missing explanation)
Move forward until you reach line 17 console.log(...), either by using Step Over repeatedly, or by setting a breakpoint there and using Continue (Run → Continue) to reach the breakpoint.
Now use Step Into to step into the method call on line 17.
What is the name of the method you are now in?
(missing explanation)
Swap components
If you hypothesize that the bug is in a module, and you happen to have a different implementation of it that satisfies the same interface, then one experiment you can do is to try swapping in the alternative. For example:
- If you suspect your
binarySearch()implementation, then substitute a simplerlinearSearch()instead. - If you suspect the JavaScript runtime, run with a different web browser or a different version of Node.
- If you suspect the operating system, run your program on a different OS.
- If you suspect the hardware, run on a different machine.
You can waste a lot of time swapping unfailing components, however, so don’t do this unless you have good reason to suspect a component. As we discussed under prioritizing hypotheses, the programming language, operating system, or hardware should be very low on your list of suspects.
One bug at a time
It’s not unusual, while you’re trying to debug one problem, to discover other problems. Maybe you notice that some other module is returning wrong answers. Maybe while you’re reading your own code (effectively a self code review), you notice obvious mistakes that need to be fixed.
Keep a bug list. This helps you deal with fresh problems that arise during debugging. Write them down on your bug list so that you can come back to them later. A bug list can be as simple as a paper notebook or text file. For software development in a group, an online bug tracker like GitHub’s Issues tab is the best approach.
Don’t get distracted from the bug you’re working on. Reflect on whether the new problem is informative data for the bug you’re working on — does it lead to new hypotheses? But don’t immediately start a recursive debugging process for the new bug, because you may have a hard time popping your mental stack to return to the original bug. And don’t edit your code arbitrarily while you are debugging, because you don’t know whether those changes might affect your debugging experiments. Keep your code changes focused on careful, controlled probes of one bug at a time.
If the new problem is interfering with your ability to debug — for example, by crashing the program intermittently, so that you can’t reliably run your experiments — then you may need to reprioritize your bug fixing. Put the current bug down (unwinding or commenting out your experimental probes, and making sure the bug is on your bug list to fix later) and tackle the new bug instead.
Don’t fix yet
It’s tempting to try to do an experiment that seems to fix the hypothesized bug, instead of a mere probe. This is almost always the wrong thing to do. First, it leads to a kind of ad hoc guess-and-test programming, which produces awful, complex, hard-to-understand code. Second, your fix may just mask the true bug without actually removing it — treating the symptom rather than the disease.
For example, if you’re getting a RangeError, don’t just add code that catches the exception and ignores it. Make sure you’ve understood why that exception was being thrown, and fix the real problem that was causing it.
reading exercises
The following code has been debugged for a while:
/**
 * @returns true if and only if word1 is an anagram of word2
 *         (i.e. a permutation of its characters)
 */
function isAnagram(word1:string, word2:string):boolean {
  if (word1 === "" || word2 === "") {
    return word1 === "" && word2 === "";
  }

  try {
    word1 = sortCharacters(word1);
    word2 = sortCharacters(word2);
    return word1 === word2;
  } catch (e) { return false; }
}
Which of its three return statements were probably added to patch over bugs, rather than fixing the real problem?
(missing explanation)
4. Repeat
After the experiment, reflect on the results and modify your hypothesis. If what you observed disagreed with what the hypothesis predicted, then reject that hypothesis and make a new one. If the observation agreed with the prediction, then refine the hypothesis to narrow down the location and cause of the bug. Then repeat the process with this fresh hypothesis.
Keep an audit trail
This is one of Agans’ nine rules of debugging: Keep an Audit Trail.
If a bug takes more than a few minutes to find, or more than a couple iterations of the study-hypothesis-experiment loop, then you need to start writing things down, because the short-term memory in your brain will very quickly lose track of what’s working and what isn’t.
Keep a log in a text file of what you did, in what order, and what happened as a result. Include:
- the hypothesis you are exploring now
- the experiment you are trying now to test that hypothesis
- what you observe as a result of the experiment:
- whether the test passed or failed this time
- the program output, especially your own debugging messages
- any stack traces
Systematic debugging techniques can rapidly exceed the ability of your brain to keep track of them, so start writing things down sooner rather than later. Minimizing a test case and delta debugging often require several iterations to zero in on an answer. If you don’t write down which test case you’re trying, and whether it passes or fails, then it will be hard to keep track of what you’re doing.
Check the plug
If you have been iterating on a bug and nothing makes sense, consider another of Agans’ rules: Check the Plug. What this means is you should question your assumptions. For example, if you turn on the power switch of a machine, and the machine doesn’t start, maybe you shouldn’t be debugging the switch or the machine – but asking whether the machine is even plugged in? Or whether the electrical outlet itself has power?
An example of “checking the plug” in programming is to make sure your source code and object code are up to date.
If none of your observations seem to make sense, one possible hypothesis is that the code you’re running (the object code) doesn’t match the code you’re reading (the source).
To test this, pull the latest version from the repository, delete all the JavaScript output files (the files ending .js), and recompile all your TypeScript code.
If YOU didn’t fix it, it isn’t really fixed
This is another one of Agans’ nine rules. In a complex system, sometimes a bug will suddenly disappear. Maybe it was something you did, but maybe not. If the system seems to be working now, and you don’t know how the bug got fixed… then most likely it isn’t fixed. The bug is just hiding again, masked by some change in environment, but ready to rear its ugly head again someday. We will see some examples of nasty bugs like this when we talk about concurrency, later in the course.
Systematic debugging helps build confidence that a bug is really fixed, and not just temporarily hidden. This is why you first reproduce the bug, so that you have seen the system in a failing state. Then you understand the cause of the bug without fixing it yet. Then finally apply a change to fix the bug using your knowledge of the cause. To gain confidence that you have really fixed it, you want to see that your change caused the system to transition from failing to working, and understand why.
Fix the bug
Once you find the bug and understand its cause, the third step is to devise a fix for it. Avoid the temptation to slap a patch on it and move on. Ask yourself whether the bug was a coding error, like a misspelled variable or interchanged method parameters, or a design error, like an underspecified or insufficient interface. Design errors may suggest that you step back and revisit your design, or at the very least consider all the other clients of the failing interface to see if they suffer from the bug too.
Undo debugging probes. In the course of finding the bug, you may have commented out code, added print statements, or made other changes in order to probe the program’s behavior or make it faster to debug. Undo all those changes now, before you commit your fix to version control.
Make a regression test. After you have applied your fix, add the bug’s test case to your regression test suite, and run all the tests to assure yourself that (a) the bug is fixed, and (b) no new bugs have been introduced.
Other tips
Get a fresh view. This is another of Agans’ nine rules of debugging. It often helps to explain your problem to someone else, even if the person you’re talking to has no idea what you’re talking about. This is sometimes called rubber-duck debugging or teddy-bear debugging. One computer lab had a big teddy bear sitting next to their help desk, with the rule that you had to “tell it to the bear” before you tried the human. The bear dealt with a surprising number of problems all by itself. Talking aloud about why you expect your code to work, and what it’s doing instead, can be good at helping you realize the problem yourself.
When the teddy bear doesn’t help, 6.031 staff and fellow students usually know what you’re talking about, so they’re even better to get help from. Outside this class, you may seek a fresh view from other team members, coworkers, or StackOverflow. The effort you put into minimizing your bug will help you make a minimal, reproducible example that you can use to ask a question online.
Sleep on it. If you’re too tired, you won’t be an effective debugger. Trade latency for efficiency.
Summary
In this reading, we looked at how to debug systematically:
- reproduce the bug as a test case, and put it in your regression suite
- find the bug using the scientific method:
- generate hypotheses using slicing, binary search, and delta debugging
- use minimially-invasive probes, like print statements, assertions, or a debugger, to observe program behavior and test the prediction of your hypotheses
- fix the bug thoughtfully
Thinking about our three main measures of code quality, systematic debugging is essentially about safety from bugs: we’re trying to get rid of a bug, while using regression testing to keep it from coming back.