If your Mininet script does not exit cleanly due to an error (or if you pressed Control-C), you may want to issue a clean command sudo mn -c before you start Mininet again.
Submission Intstructions
Submit a link to a *private* github.mit.edu repository using the form. Your repository *must* be forked from the starter repository. Ensure that the usernames "jsalamy" and "prateesh" are added as collaborators to your repository. We will only consider commits made before the submission deadline. If you would like to use an extension day, include the string "EXTENSION-DAY" in the relevant commit messages AND contact the staff individually.
Your question answers along with your code should be in your git repository. To answer the questions, create a directory named "answers" in your git repository, and commit files named "p{1,2,3,4,5}.{txt,pdf}" Answer as clearly and concisely as possible.
For example, your repository would have the file "answers/p1.txt" if your answer for Problem 1 is in plaintext, or "answers/p1.pdf" if you answer in pdf format.
Problem 1: Bufferbloat
This problem is an extended version of a problem from Stanford's Winter 2013 CS244 course (used with permission).
Introduction
In this exercise we will study the dynamics of TCP in home networks. Take a look at the figure below which shows a "typical" home network with a Home Router connected to an end host. The Home Router is connected via Cable or DSL to a Headend router at the Internet access provider's office. We are going to study what happens when we download data from a remote server to the End Host in this home network.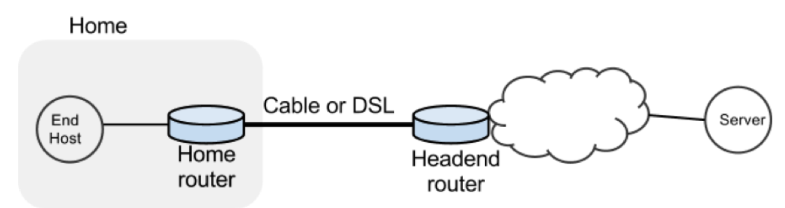
In a real network it's hard to measure cwnd (because it's private to the server) and the buffer occupancy (because it's private to the router). To ease our measurement, we are going to emulate the network in Mininet.
Goals
- Learn first-hand the dynamics of TCP sawtooth and router buffer occupancy in a network.
- Learn why large router buffers can lead to poor performance. This problem is often called "bufferbloat."
- Learn how active queue management schemes (in this exercise, PIE) mitigate the effects of bufferbloat.
- Learn how to use Mininet to create network topologies, run traffic generators, collect statistics and plot them.
- Learn how to package your experiments so it's easy for others to run your code.
Tasks
Within Mininet, create the following topology: h1 (repesenting your home computer) has a fast connection (1 Gbit/s) to your home router with a slow uplink connection (10 Mbit/s) to h2 (representing a web server). The round-trip propagation delay, or the minimum RTT between h1 and h2 is 20 ms. The router buffer size can hold 100 full sized ethernet frames (about 150 kB with an MTU of 1500 bytes).Then do the following:
- Start a long lived TCP flow sending data from h1 to h2. Use iperf.
- Start back-to-back ping train from h1 to h2 10 times a second and record the RTTs.
- Plot the time series of the following:
- The long lived TCP flow's cwnd
- The RTT reported by ping
- Queue size at the bottleneck
- Spawn a webserver on h2. Periodically download the index.html web page using h1 and measure how long it takes to fetch it (on average).
- Repeat the above experiment and replot all three graphs after enabling the PIE AQM algorithm on the switch interface attached to the bottleneck link. Set the target delay for PIE to 20 ms.
- Repeat the above experiment with PIE enabled, but this time, start 10 parallel TCP flows with iperf.
Framework code
To help you get started, we provide a basic skeleton code. First you will need to set up your machine with mininet. Once you have your machine running, run a Mininet sanity check (sudo mn --test pingall) and then continue with this assignment.Download instructions
In the home directory of your machine, download the framework code by cloning a base git repository as follows:git clone https://github.mit.edu/akshayn/6.829_lab1.gitLook for TODOs in the starter code. The following are important files you will find in the repository. Ignore other files.
| File | Purpose |
|---|---|
| bufferbloat.py | Creates the topology, measures cwnd, queue sizes and RTTs and spawns a webserver. |
| plot_queue.py | Plots the queue occupancy at the bottleneck router |
| plot_ping.py | Parses and plots the RTT reported by ping |
| plot_tcpprobe.py | Plots the cwnd time-series for a flow specified by its destination port |
| run.sh | Runs the experiment and generates all graphs in one go. |
Note: We require that you use git version control, hosted on github.mit.edu.
Deliverables
- Final Code: Remember one of the goals of this assignment is for you to build a system that is easy to rerun to reproduce results. Therefore, your final code MUST be runnable as a single shell command ("sudo ./run.sh"). We will grade the submission based on producing working code, correctness of graphs, and code quality.
- README: A file named README with instructions to reproduce the results. Please list installation instructions for any dependencies required to run your code. Note that your run.sh should install dependencies automatically if applicable.
- Plots: There should be 9 plots in total, 3 each for the following cases: single flow without and with PIE; 10 flows with PIE. They MUST have the following names in the "answers" directory from the repository root.
- n1-nopie/q.png, n1-nopie/cwnd-iperf.png, n1-nopie/rtt.png.
- n1-pie/q.png, n1-pie/cwnd-iperf.png, n1-pie/rtt.png
- n10-pie/q.png, n10-pie/cwnd-iperf.png, n10-pie/rtt.png.
Questions
Answer the following questions below. Remember to keep answers brief.- Why do you see a difference in webpage fetch times when enabling PIE?
- The target queueing delay for PIE is 20 ms. In which case (1 or 10 flows) is PIE better able to keep the queueing delay close to the target? Briefly explain why.
Problem 2: TCP throughput & fairness
In this exercise we will study TCP's throughput and fairness characteristics with Mininet. Consider the topology shown in the figure below.
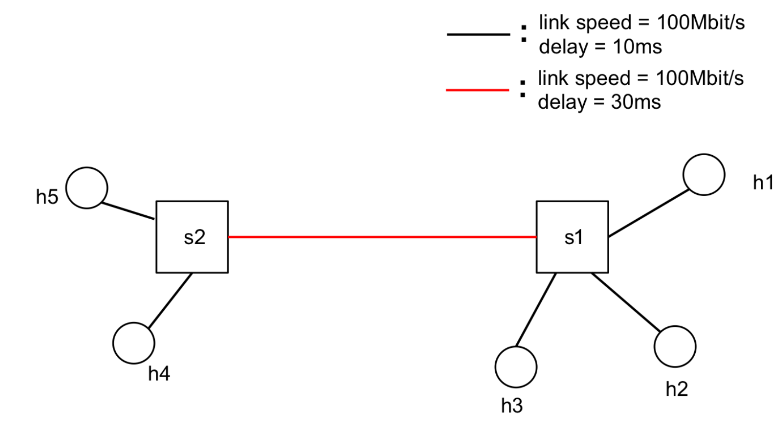
All links are 100 Mbit/s and have a one-way propagation delay of 10 ms, except for the link between S1 and S2, which has a 30 ms propagation delay. The switches have 1000 packets of buffer at each port, and use PIE active queue management with a target delay of 20 ms.
The goal of this exercise is to learn how the RTT and number of bottleneck links impacts throughput and fairness of TCP flows.
Tasks
Within Mininet, create the topology shown above, and enable PIE with a target delay of 20 ms on the switch interfaces. Then do the following:Scenario 1:
- Start 10 long lived TCP flows sending data from h2 to h1, and similarly 10 long lived TCP flows from h5 to h1.
- Start back-to-back ping trains from h2 to h1, and h5 to h1. Record the RTTs with ping 10 times a second.
- Measure the following:
- The average throughput for h2->h1 and h5->h1 flows. For each group, measure the aggregate throughput of the 10 flows.
- The average RTT for h2->h1 and h5->h1 flows.
- Now start 10 long lived TCP flows from h4 to h3.
- Repeat the above measurements (average throughput and RTT) for the three groups of flows: h2->h1, h5->h1, and h4->h3.
Starter code
The same framework code from problem 1 has the starter code for this problem. The new files are explained below. Look for TODOs in the starter code.| File | Purpose |
|---|---|
| tcpfairness.py | Creates the topology and sets up PIE. |
Deliverables
- Final Code: Remember one of the goals of this assignment is for you to build a system that is easy to rerun to reproduce results. Therefore, your final code MUST be runnable as a single shell command ("sudo ./run_p2.sh"). We will grade the submission based on producing working code, correctness of graphs, and code quality.
- README: A file named README with instructions to reproduce the results. Please list installation instructions for any dependencies required to run your code. Note that your run.sh should install dependencies automatically if applicable.
- Output: The following files MUST be present in the "answers" directory of your submission folder. (Follow the format in format.out in the folder, which has dummy results for scenario 1. Throughput has unit Mbit/s, RTT has unit ms.)
- scenario1.out, with the average throughput and RTT for h2->h1 and h5->h1 flows.
- scenario2.out, with the average throughput and RTT for h2->h1, h5->h1, and h4->h3 flows.
Questions
Answer the following questions below. Remember to keep answers brief.- In Scenario 1, which of the following statements is more accurate:
- The congestion windows of h2->h1 flows are larger than h5->h1 flows.
- The congestion windows of h2->h1 flows are smaller than h5->h1 flows.
- The congestion windows of h2->h1 and h5->h1 flows are roughly the same.
- In Scenario 2, which of the two bottleneck links (S2->S1 or S1->h1) do you expect has the larger drop rate? Briefly explain why.
Problem 3: TCP throughput estimation
Consider the same topology and TCP flows as in Scenario 2 of Problem 2. Recall that there are two bottleneck links in this scenario: S2->S1 and S1->h1. Assume that both links are 100% utilized and each has an average queueing delay of 20 ms. Assume also that the loss rates on these two links are small and independent.
Derive the throughput of the three flows: h5->h1, h4->h3, and h2->h1, using the equation relating TCP throughput to the loss rate and RTT.
Problem 4: Buffering in a fast router
Louis Reasoner has been recruited by a hot new startup to design the packet queueing component of a high-speed router. The link speed of the router is 40 Gigabits/s, and he expects the average Internet round-trip time of connections through the router to be 100 ms. Louis remembers from his 6.829 days that he needs to put in some amount of buffering in the router to ensure high link utilization in the presence of the TCP sources in the network growing and shrinking their congestion windows. Louis hires you as a consultant to help design his router's buffers.
Assume for the purposes of these questions that you're dealing with exactly one TCP connection with RTT 100 ms (it turns out that this assumption does not change the results too much, for a drop-tail gateway, if the connections all end up getting synchronized). Also assume that the source is a long-running TCP connection implementing additive-increase (increase window size by 1/W on each acknowledgment, with every packet (TCP segment) being acknowledged by the receiver, such that the window increases by about 1 segment size every RTT) and multiplicative-decrease (factor-of-two window reduction on congestion). Assume that no TCP timeouts occur. Don't worry about the effects during slow start; this problem is about the effects on router buffering during TCP's AIMD congestion-avoidance phase.
You should (be able to) answer this question without running any simulations or writing code.
- Show that if the amount of buffering in the router is equal to the bandwidth-delay product, the TCP connection can achieve a 100% link utilization (or very close to it). How much packet buffer memory does this correspond to for the router under consideration?
- Louis is shocked at how much memory is needed and thinks he may not be able to provide this much buffering in his router. He asks you what the average link utilization is likely to be when the amount of buffering in the router is very small compared to the bandwidth-delay product. Explain your answer.
- Louis asks you how the average link utilization, U, varies as a function of r, the ratio of the amount of router buffering, B, to the "pipe-size", P (the bandwidth-delay product, defined as the product as the bottleneck link rate and the minimum RTT). Calculate U(r) for 0 ≤ r ≤ 1. (We know, from part 1, that U(1) = 1, and the answer to part 2 is U(0).)
- Sketch U versus r, for 0 ≤ r ≤ 1.
Problem 5: Cheating with XCP
After reading the XCP paper in 6.829, Alyssa P. Hacker and Cy D. Fect get into an argument about just how fragile XCP is in the presence of senders who lie about the information they are given. Consider a version of XCP where the sender reports to the network its RTT and its throughput. In this protocol, the fields in the congestion header are: (i) RTT (ii) throughput (instead of cwnd), and (iii) feedback. (This change from the scheme in the XCP Sigcomm '02 paper will make it easier for you to reason about this problem.)
We will assume that the sender can lie about the RTT and throughput to the network in an attempt to persuade the network to give it more (or less, but that's not too interesting) than its correct share, or in an attempt to mess up the resulting link utilization (causing the network to run under-utilized or to be in persistent congestion). However, the sender does not send at an arbitrary rate; it always updates its congestion window according to the feedback the network sends. (This constraint on the sender is reasonable; after all, in XCP, a sender that simply wished to ignore the network's feedback could do so anyway, and such behavior would require other network-level mechanisms to detect and control.)
More precisely,
cwnd <-- cwnd + feedback true_RTT / declared_RTT.
This adjustment ensures that the increase in the sender's throughput is the one intended by the network.
Alyssa and Cy get into an argument about what happens when users misbehave and lie to the routers. Help them resolve their argument. Be precise and concise in your answers to these questions. These questions are intentionally somewhat under-specified, to encourage you to think about all the things that can go wrong.
- Suppose the sender(s) lie only about RTT. What would XCP's performance in terms of link utilization and fairness be? (A sender might lie in either direction, of course.)
- Suppose the sender(s) lie only about throughput. What would XCP's performance in terms of link utilization and fairness be? (A sender might lie in either direction, of course.)