The platform demonstration uses a force sensing platform made by Pasco. It is about 14 inches square and you can stand on it like a bathroom scale. It has the following characteristics.
The LabView program to run this demonstration is available on the course website at this URL. It requires a Pasco SW750 interface with the platform plugged into input A.
The platform should be tared (button next to the output lead) before starting measurements.
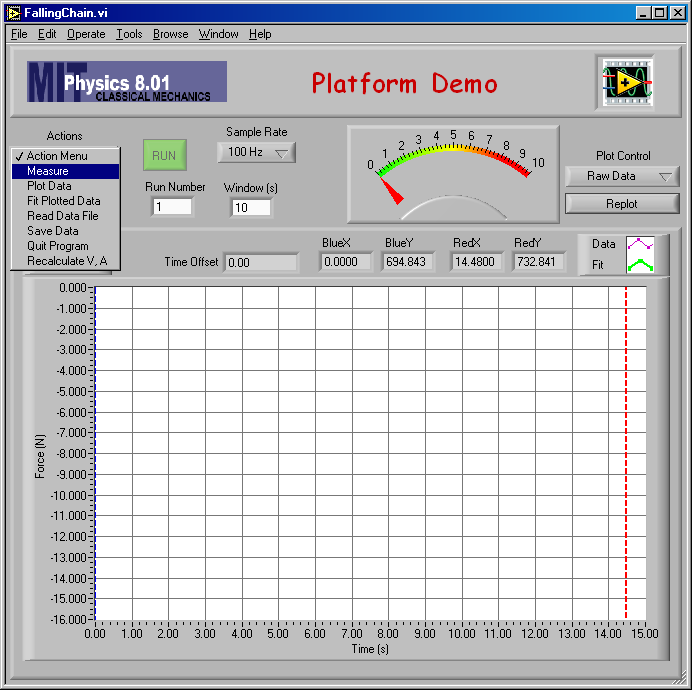
The program is controlled by the Actions pull-down menu to the left above the graph.
When you choose Measure from the menu, the Run light will turn bright green, indicating the program is ready to make measurements of the force in the platform.
When you click the Run button (or type the Esc key) the button will change to a red Stop button and the program will start measuring the force on the platform and plot the results on the graph.
It will continue to take make measurements until you click the Stop button (or type the Esc key), but will keep only the most recent 10 seconds worth of measurements. (How much data it keeps is determined by the number you type in the Window(s) field.)
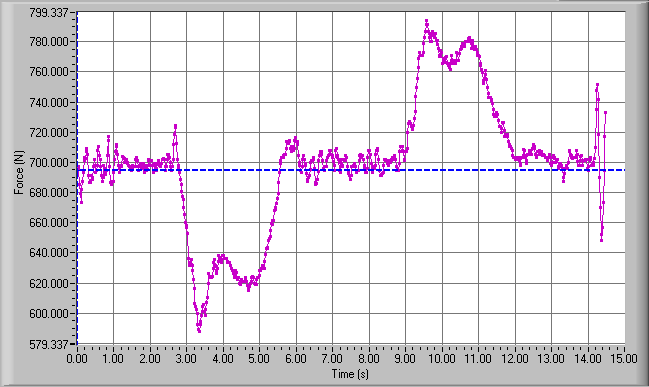
A fun application is to have students stand on the platform, jump as high as they can and land on the floor beside the platform. Here is a typical result.
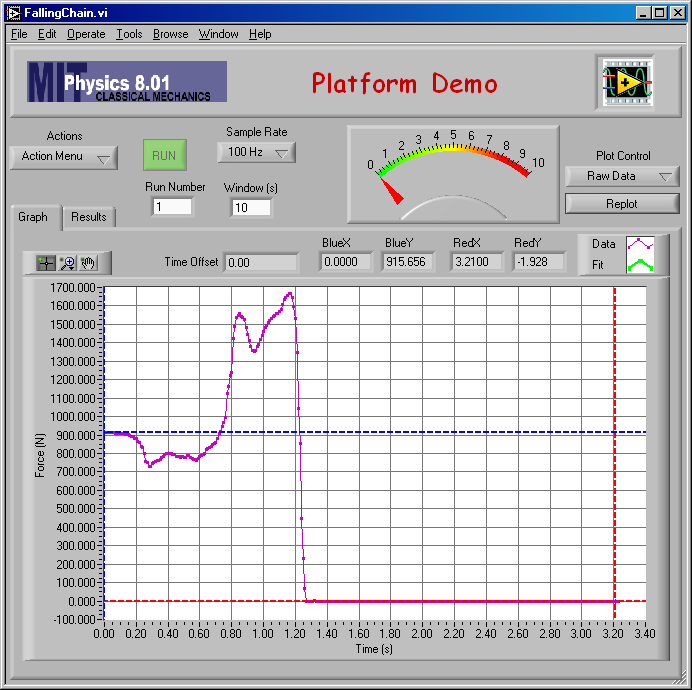
When a person stands still on the platform, it measures his/her weight, and the force drops to zero when their feet are no longer in contact with the platform.
|
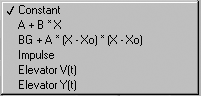
The program can analyze the measurements. What it does is controlled by
the Fit Function? pull-down menu on the Results tab.
The choices are show at the left.
If you select Impulse, the program will integrate the force over the time between the two cursors on the graph. To get a useful result for analyzing the jump, you should first subtract off the jumper's weight as a background force. On the Results tab there is a field Backgnd(N) where you should type in the jumper's weight. |
Set the cursors to define the time range you want to integrate over and choose Fit Flotted Data from the Actions menu. The program will do the integration and show the integrated area on the graph.
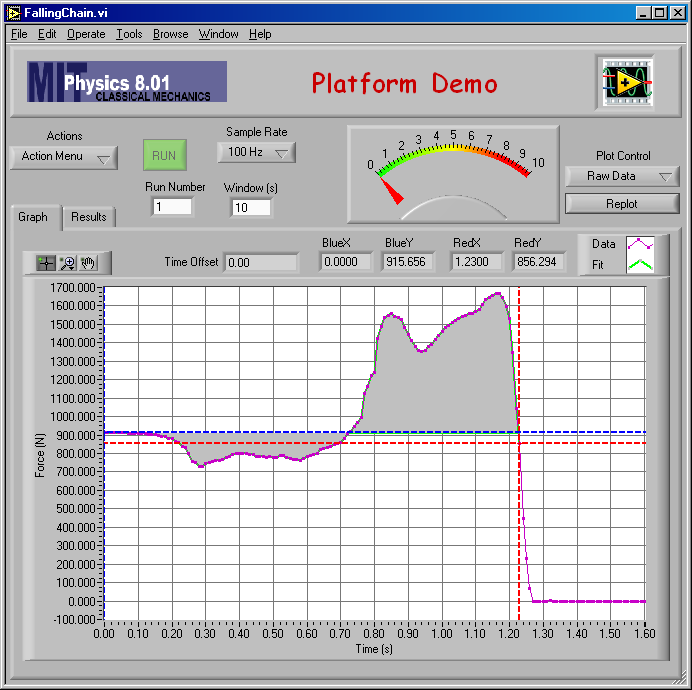
If you click the Results tab, you will see the calculated impulse in the field labeled Impulse (Ns) just below the Backgnd(N) field.
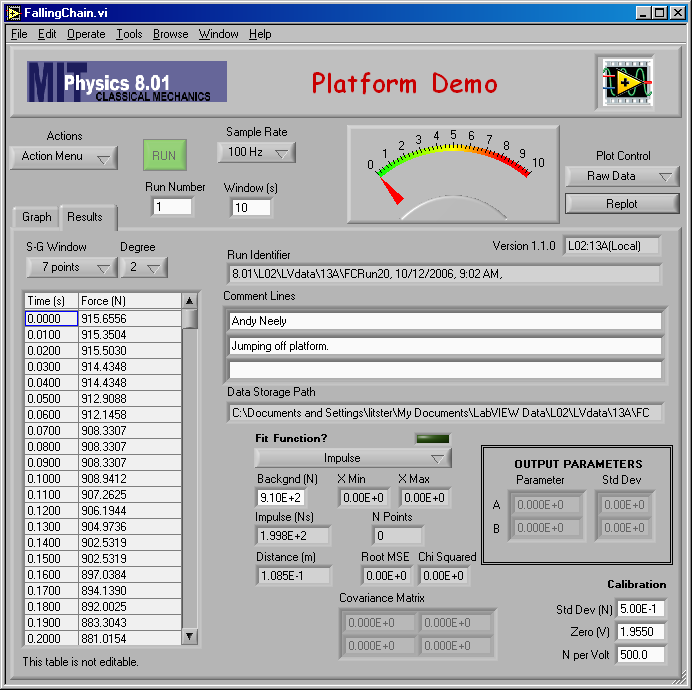
In this case, the impulse is 200 N and the jumper's mass is 910/9.8 = 92.9 kg. That means his velocity on leaving the platform was 2.15 m/s. His center of mass will rise to 0.24 m (9.3 in) above the platform before he starts to fall back to the floor.
There are two other items on the Fit Function? menu you might want to play with.
We used a small storage battery to run the SW750 and took the demonstration for a ride in the building 16 elevator, which is rather fast. Here is the measurement for a person weighing 72 kg riding from floor 5 down to floor 1 in building 16.
You can see the elevator accelerates downwards for about 3 seconds, drops at constant velocity for about 3 seconds and finally accelerates upward an additional 3 seconds to come to a stop. The ride over 4 floors takes about nine seconds, and you can also see the peak acceleration is about 1.4 m/s2, or 0.14 g.
The impulse during the various portions of the elevator ride can be calculated.
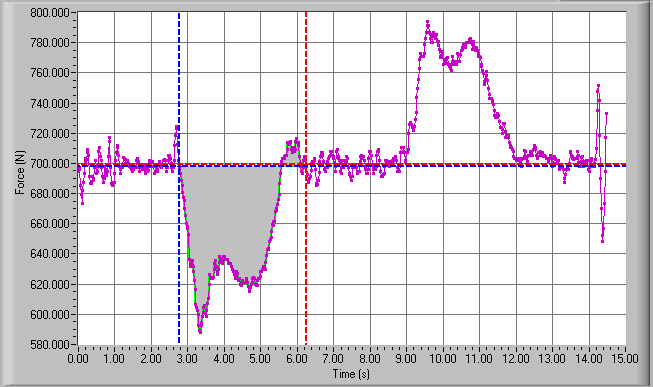
The integration gave a value of -177 Ns during the downward acceleration at the start of the ride and +177 Ns for the upward accelerationat the end. This gives some idea of the accuracy of the measurements.
Using the Elevator V(t) function gave the following graph.
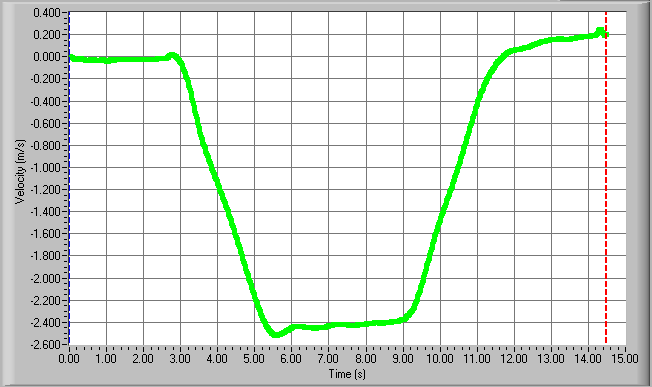
You can see that the peak downward velocity is about 2.4 m/s.
Using the Elevator Y(t) function gave this graph.
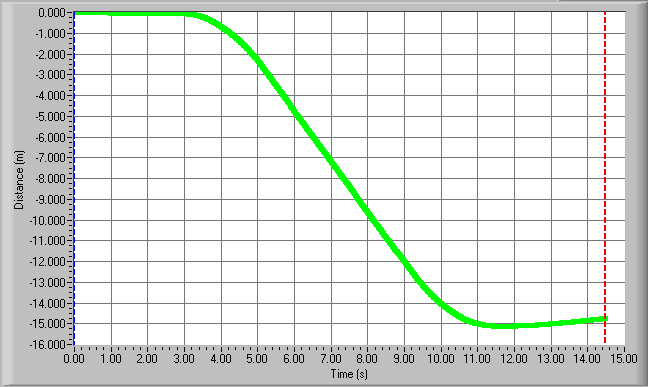
The height change from the fifth to the first floor in building 16 appears to be about 15 m.
J. D. Litster, October 15, 2007.