"Climate change is a threat to human well-being and planetary health.
The choices and actions implemented in this decade will have impacts
now and for thousands of years."
"Deep, rapid and sustained mitigation and accelerated implementation of adaptation actions in this decade would reduce projected losses and damages for humans and ecosystems."
"If we act swiftly, it is not too late
to prevent much more severe changes to the Earth's climate." - MIT Climate Portal
Scientists from around the world warn us that we are in the midst of a
climate emergency. In their "World
Scientists Warning of a Climate Emergency," over 15,000 scientists from
163 countries present graphical data showing vital metrics about our climate.
They write that, "greenhouse gas emissions are still rising, with increasingly
damaging effects," and that, "with few exceptions, we are largely failing to
address this predicament."
This warning draws on a long history of scientists raising alarms about
the state of our earth. In 1992, MIT professor and Nobel Prize winner Henry
Kendall spearheaded the "World
Scientists Warning to Humanity 1992," which argued for the need to curb
environmental degradation, lest we "so alter the living world that it will
be unable to sustain life in the manner that we know."
The best science from the AR 6 IPCC report teaches us that:
Climate change is a threat to human well-being and planetary health (Section C. p.25)
Risks and projected adverse impacts and related losses and damages from climate change escalate with every increment of global warming (Section B2. p.15)
Limiting human-caused global warming requires net zero CO2 emissions (Section B5, p. 20)
Escalating Impacts
Scientists predict that impacts will be more severe the more global
temperature increases above 1.5 °C. Explore projected impacts below by
clicking on the projected temperature increase. The time to act is now,
when temperatures are lower!
Potential Impact of Climate Change from Temperature rise above
pre-industrial levels
Major effects on warm-water coral reef ecosystem.
Significant imapcts on vulnerable ecosystems and species (polar regions, wetlands, and cloud forests).
Increase in coastal and river flooding.
Increase in extreme weather events.
Increase in the spread of tropical infectious disease.
Increase in heat-related morbidity and mortality.
The Maldives, the Marshall Islands, Tuvalu, and many other small island nations abandoned.
Major loss of warm-water coral reef ecosystem.
Major changes in the Arctic regions with a substantial loss of Arctic sea ice.
Major increase in extreme weather events and the spread of infectious disease.
Major increase in heat-related morbidity and mortality, especially in the low latitudes.
Significant impacts on vulnerable ecosystems(polar regions, wetlands, cloud forests, and mangroves).
Significant increase in coastal and river flooding around the world.
Significant impacts on low latitude fisheries.
Decrease in crop yields and productivity especially in the tropics and sub-tropical regions.
Major impacts on all ecosystems including significant increase in species extinction.
Loss of all warm-water and may cold-water coral reef ecosystems.
Arctic completely free of sea ice in summer, Arctic temperature increase by 8°C.
Disappearance of the majority of mountain glaciers, including all ice on Kilimanjaro (Tanzania).
Major increase in extreme weather events and spread of infectious disease.
Major decreases in agricultural and fishery production and available water resources.
Food and water security become major political and humanitarian issues.
Environmental forced mass migration increases.
Ocean and terrestrial carbon sinks reduce, accelerating climate change.
Catastrophic loss of ecosystems and species all around the world.
Melting of western Antarctic and Greenland ice sheets accelerates, causing significant rises in global sea level.
Fifth of world population affected by flooding and major coastal cities abandoned.
Environmental forced mass migration accelerates and conflicts over resources increase.
In many countries, summer temperatures persistently stay above 40°C.
Heatwaves with temperatures as high as 50°C become common.
Over 3.5 billion people become water-stressed.
Wildfies create major air pollution events and human health crises.
Global food production plummets, leading to widespread malnutrition and starvation.
Climate impacts are not and will not be equally distributed. Students and
young people, citizens of small island nations and low income
communities—these are populations that will bear the brunt of climate
change impacts. We are a group of students, educators, and young people
who intend to spur action today to mitigate climate change and
minimize harm in the future.
We can choose to use our education and our privilege for the greater
good. We aim to help chart the path to a livable future—for ourselves,
our families and friends, and our communities—to achieve planetary health
and well-being. We do so with a spirit of collaboration with others who
feel a call to action.
The MIT Climate Clock is intended to provide daily reminders
and inspiration to accelerate climate action. It consists of sets of
climate-related messages which we update regularly. Since 2021, we have
projected climate messages on buildings at MIT and in the Cambridge, MA
area. As global systems change and we learn, we continue to refine our
messages.
Messages
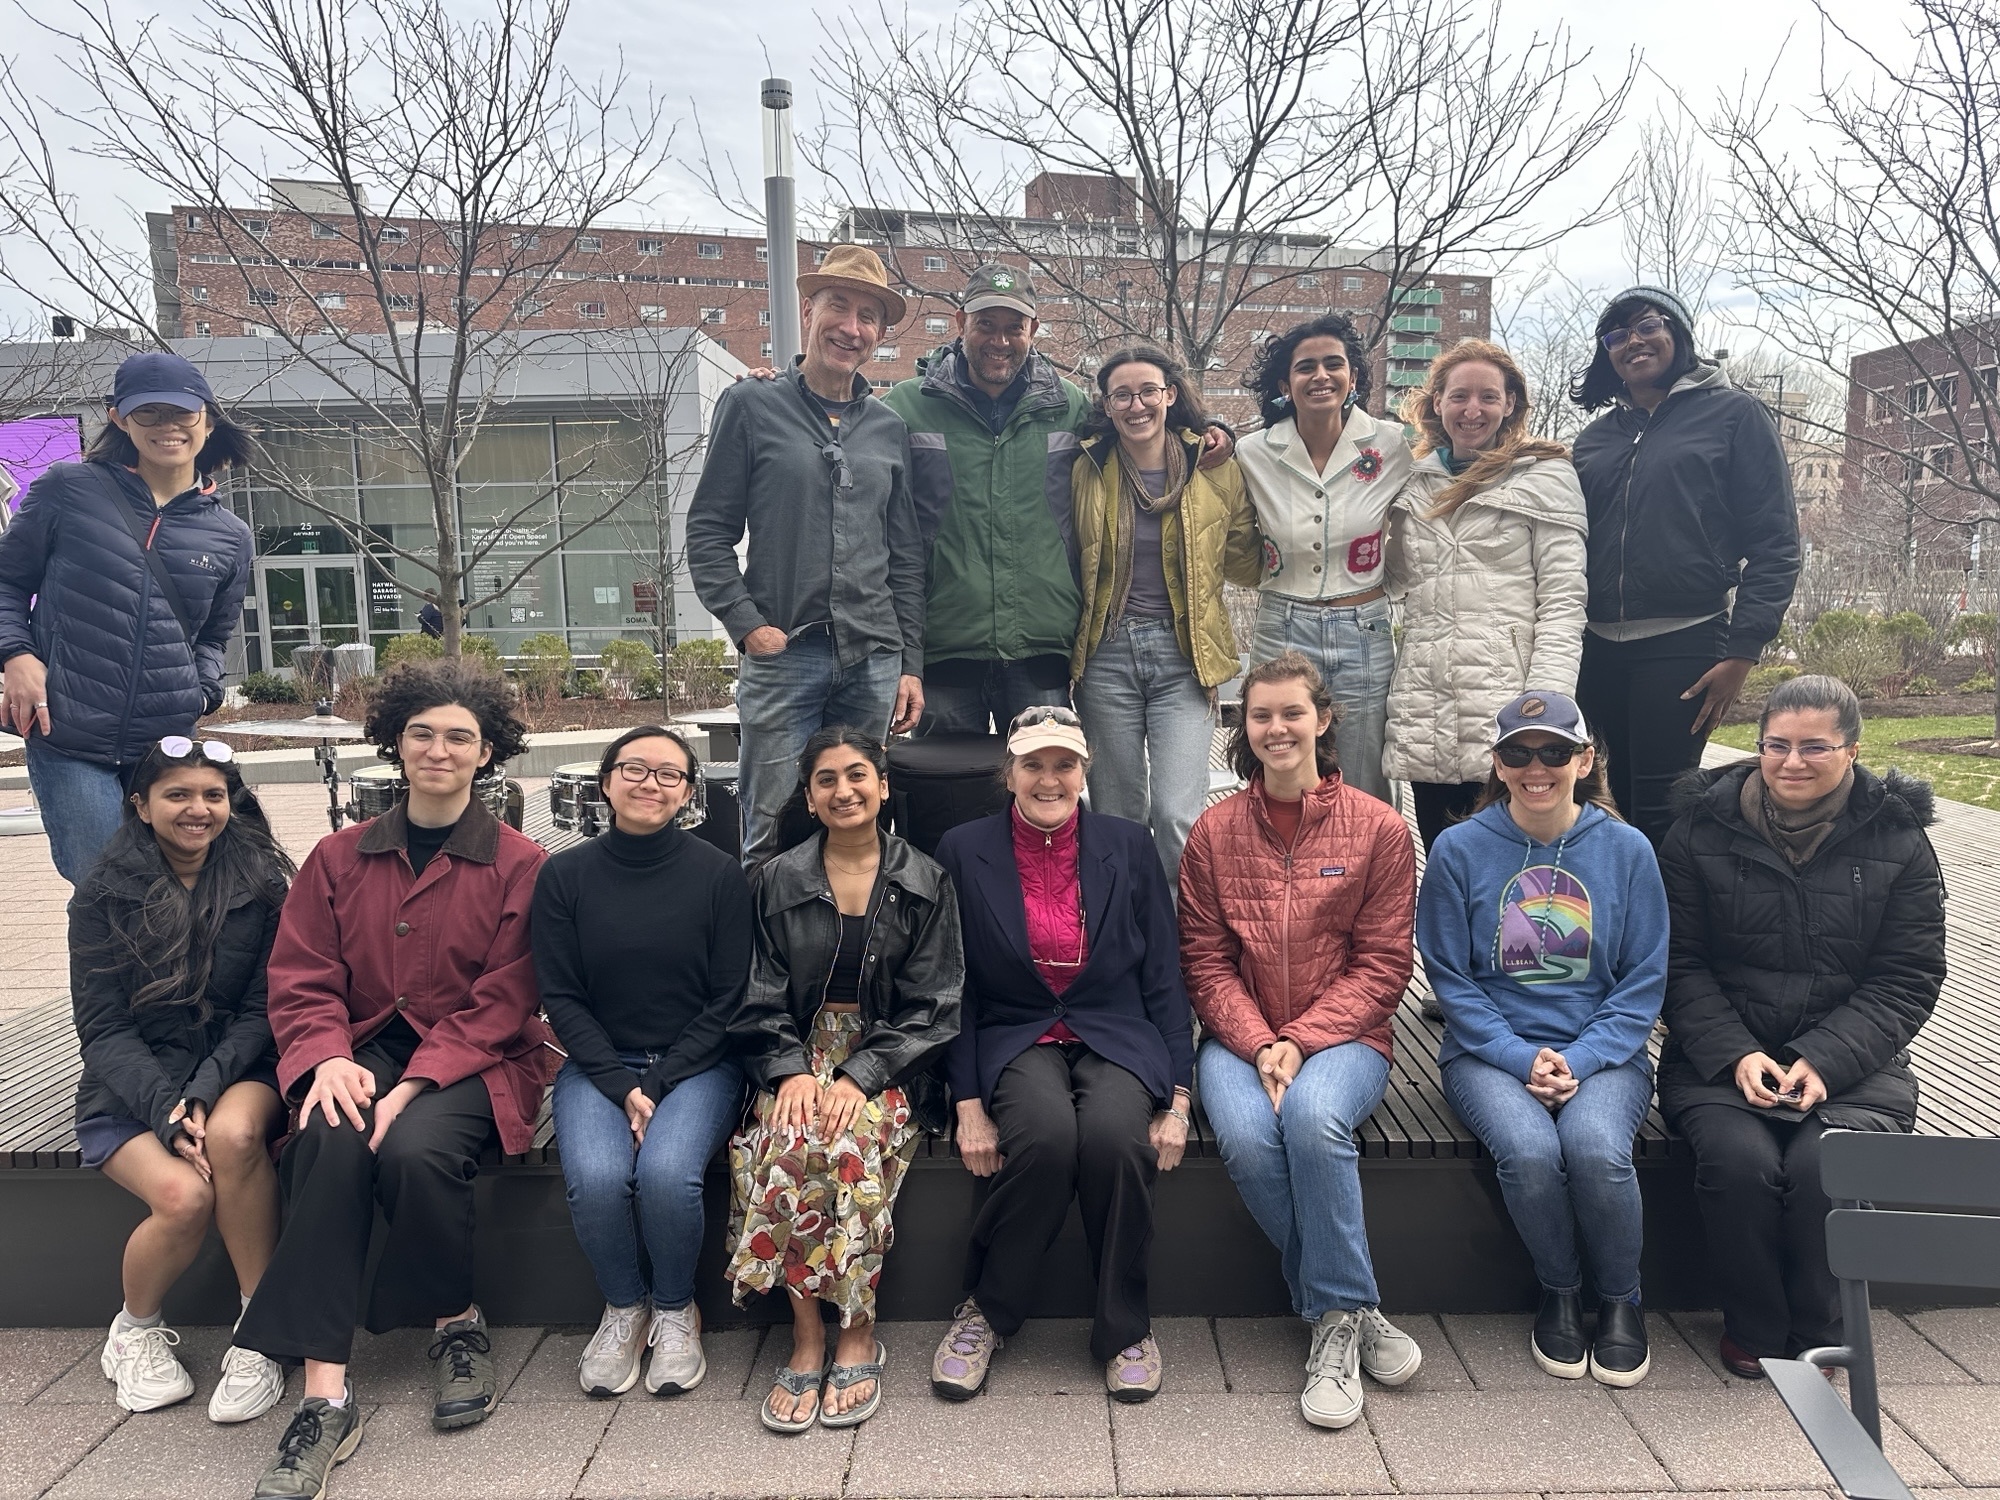
Kendall/MIT Open Space, April 16th - 23rd, 2025
During Earth Week, 2025, people gathered for a week of educational events celebrating our Earth and community action at Kendall/MIT Open Space.
Videos showcasing our climate clock project history played, along with recordings from relevant lectures and project presentations. From drumming performances, to
a circle discussion with a panel of climate activists, people connected around our shared love of our planet.
MIT Green Building, November 30th - December 12th, 2023
In Fall 2023, the Undergraduate Association Sustainability Committee set up
a "Hack the Climate Clock" event, opening up the opportunity for all students
across MIT's campus to compete in proposing the best new climate message for the
November / December 2023 period. The winning student team would get the
opportunity to project their message onto the Green Building (#54), one of
the tallest buildings in Cambridge and home to the Department of Earth,
Atmospheric, and Planetary Sciences.
Four teams of students submitted ideas for updating the Climate Clock.
The climate message created by MIT undergraduates Norah Miller and Eleanor
Li was selected as "the winner." Norah and Eleanor’s climate clock message
displayed from November 30 through December 12, 2023 to coincide with COP28.
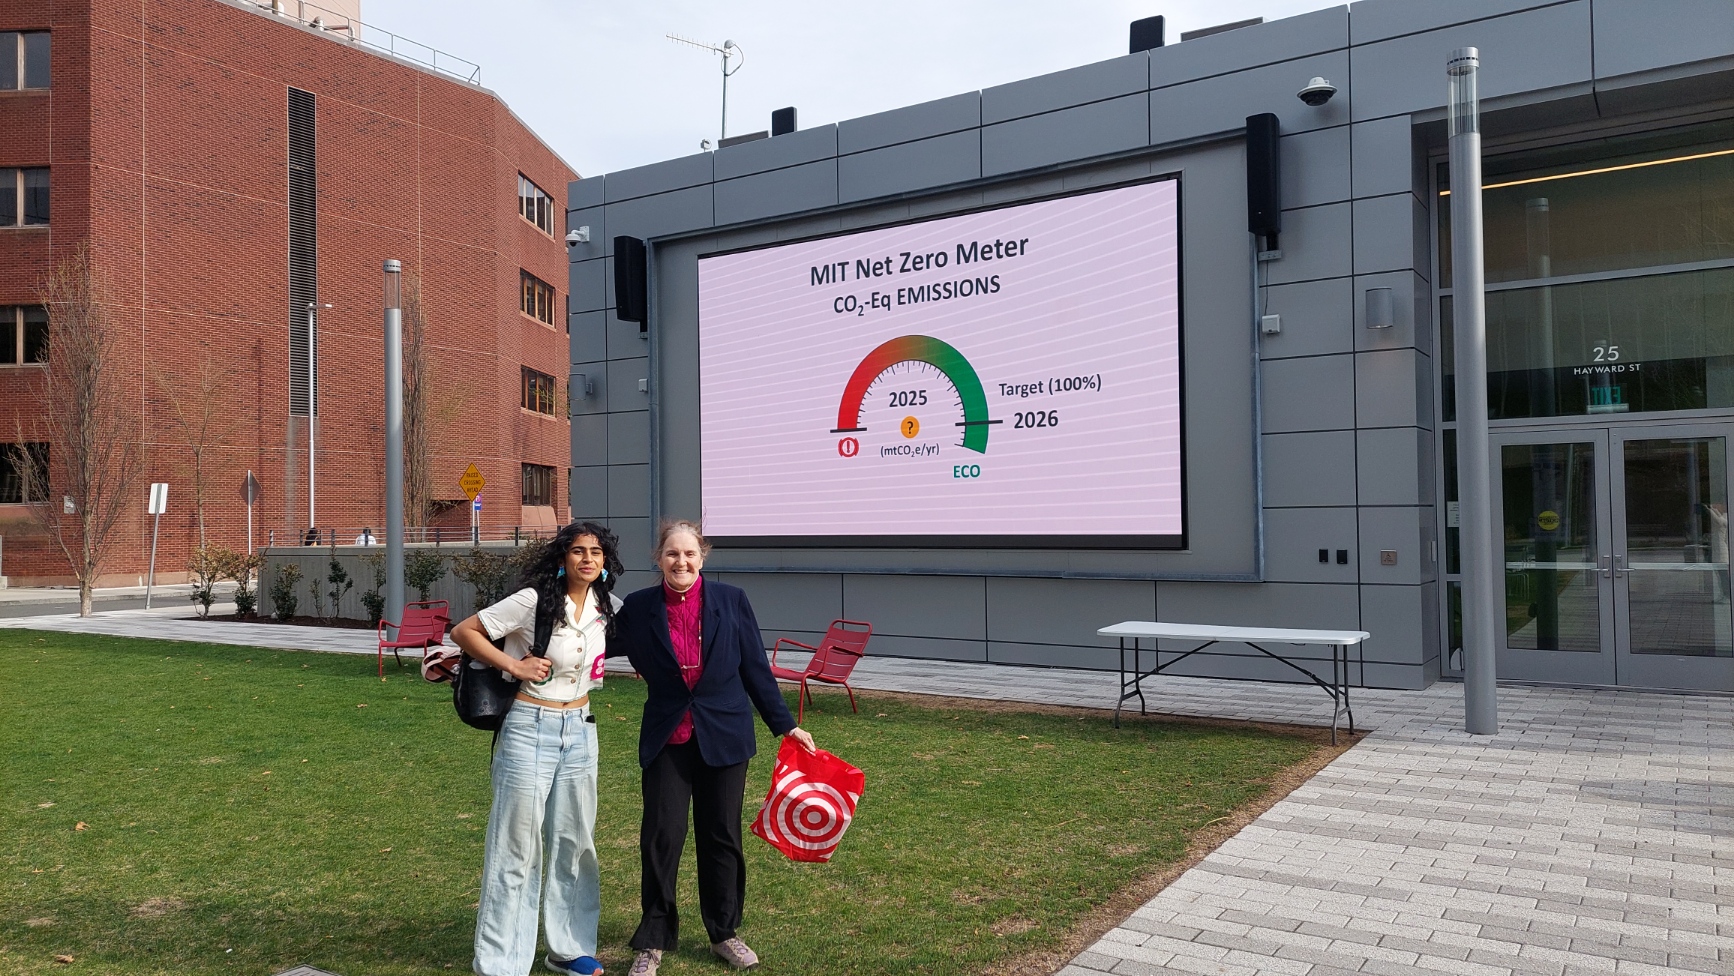
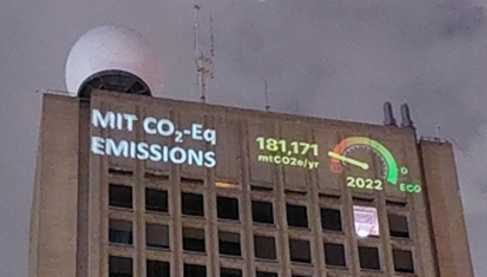
Our MIT D-Lab Climate Clock team came up with the idea of a meter to showcase
MIT’s efforts to "eliminate direct emissions by 2050" the commitment the MIT
Administration made in Fast
Forward: MIT's Climate Action Plan for the Decade (2021) p.12. The
Administration has also committed to Net-Zero direct emissions by 2026.
Student feedback led us to create two versions of the MIT Net Zero Meter: one
showing MIT's net zero commitment as an annual percentage(%), the other in absolute
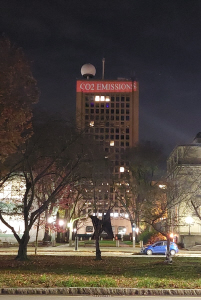
numbers. Moving beyond "0" to "ECO" is the goal. MIT Climate Clock team member, Jillian James,
Aero Astro '10 and '16, who had taken a course covering spaceship dashboard design,
led in the design of this meter.
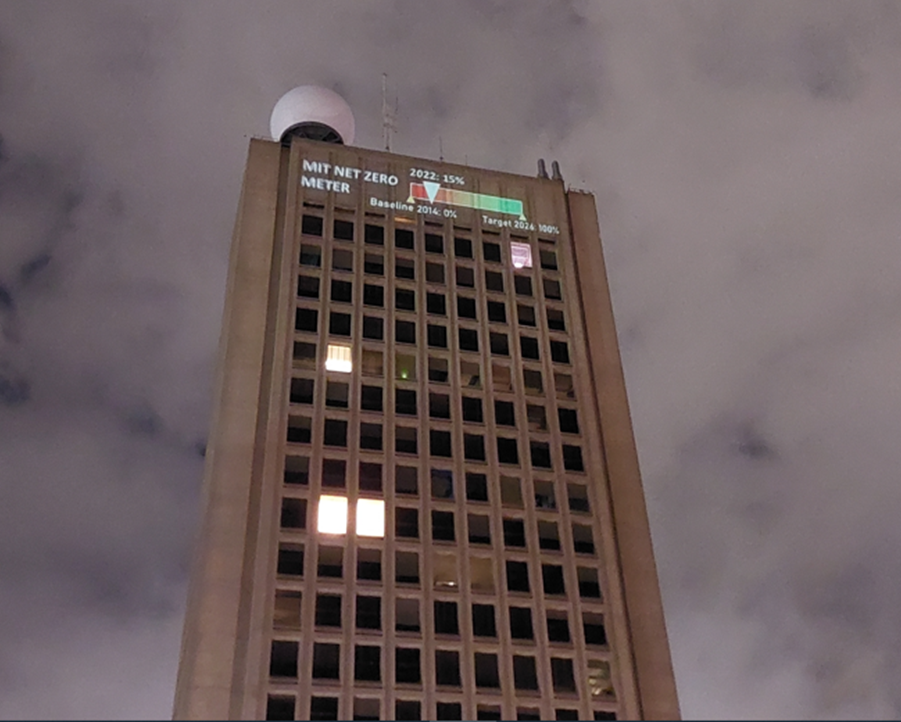
Complete Message Accompanying the 2023 Net-Zero Meter
MIT's Climate Goal: Net Zero by 2026. No direct emissions by 2050
UN Sec. General urges developed countries reach Net Zero by 2040
MIT's 2022 emissions were 15% better than 2014 baseline
MIT 2022 Net Zero Meters: CO2-eq Emissions %; CO2-eq Emissions Concentration
MIT emissions are our responsibility!
Net Zero campus emissions safeguards student's and everyone's futures!
MIT has committed to net-zero direct emissions by 2026, meaning that
MIT must take as much carbon out of the atmosphere as it put into it.
However, research shows the climate mitigation may require us to go
carbon negative. According to the Internation Energy Agency (IEA): "Becoming
carbon negative requires a company, sector or country
to remove more CO2 from the atmosphere than it emits. Meeting ambitious
international climate goals may require global CO2 emissions to fall below
zero in the second half of this century, achieving what is known as net negative
emissions."
MIT Green Building, 2021 and 2022
The MIT Climate Clock team originated as a MIT D-Lab: Water,
Climate Change and Health class project in
Spring 2020, and has continued from then until now with D-Lab involvement and
support. While originally considered as an MIT hack, the MIT Climate Clock
team quickly realized that we wanted to be a permanenber presence on campus.
Hacks are one-offs, but we wanted to be a permanent installation. Therefore
we decided to pursue MIT Administration approval. Our idea was originally
inspired by the CITGO sign in Kenmore Square, a prominent feature of the Boston
skyline, that has advertised a fossil fuel corporation since the 1960's. We
wanted to create a new landmark on the Cambridge skyline, marking a different
era with different priorities and values.
Originally we wanted to project NOAA's carbon dioxide animation which
shows how atmospheric CO2 concentration has increased dramatically
over the last 800,000 years, and exponentially in the past century.
But then the Covid-19 pandemic came and although there was a D-Lab team
already formed to imagine and carry out a monumental science-art display,
the year 2020 was not the right time to begin.
Six months later, we learned of the New York City Climate Clock,
which began projection in September 2020. We thought: "Yes! That's
exactly what we want to do too." From that day forward, our aim
was to create and project climate messages along the lines of the NYC
Climate Clock model.
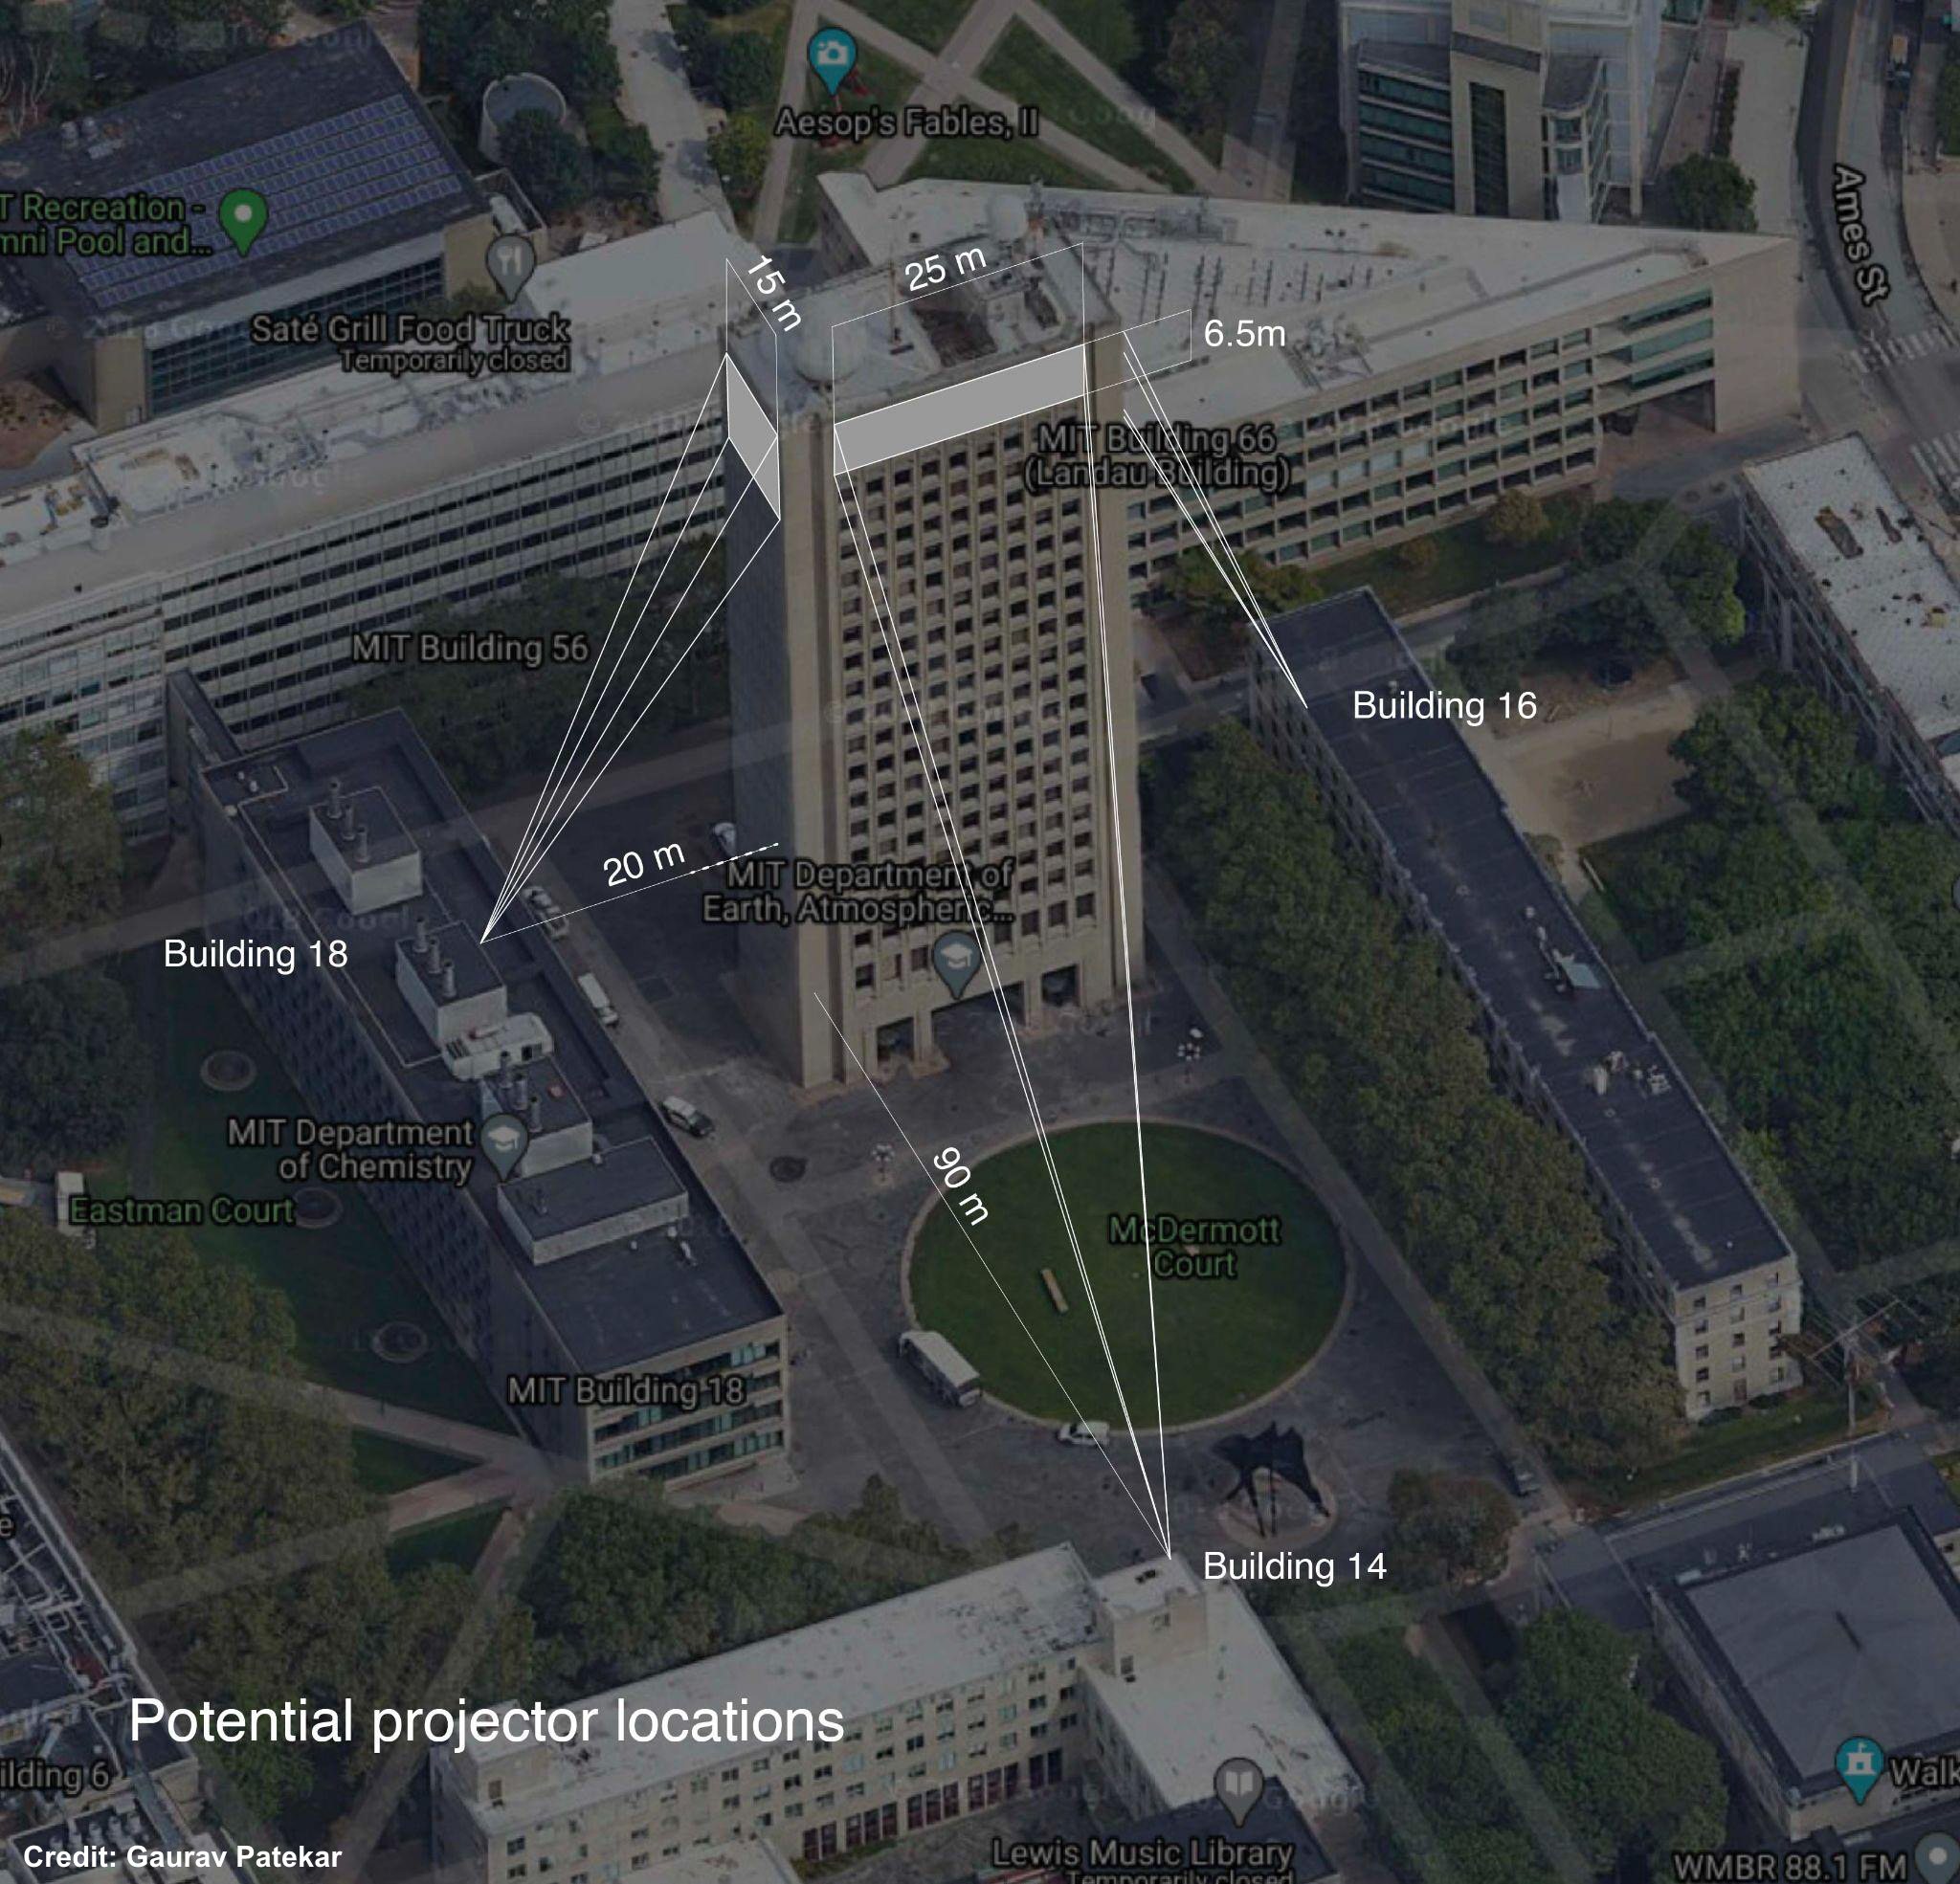
We sought to display
the MIT Climate Clock in the most fitting location on campus — at the
top of the south facade of the Green Building, aka the Department of Earth,
Atmospheric and Planetary Science building, the 1st (then) and
now 2nd tallest building in Cambridge.
The MIT Climate Clock received MIT Administration approval for its first
projection during Earth Week, April 22, 2021. Since then, we have been
approved for six short-duration (10 days to 2 mo.) projections. The first
four displays projected the same message, only changing locations on different
parts of the Green Building.
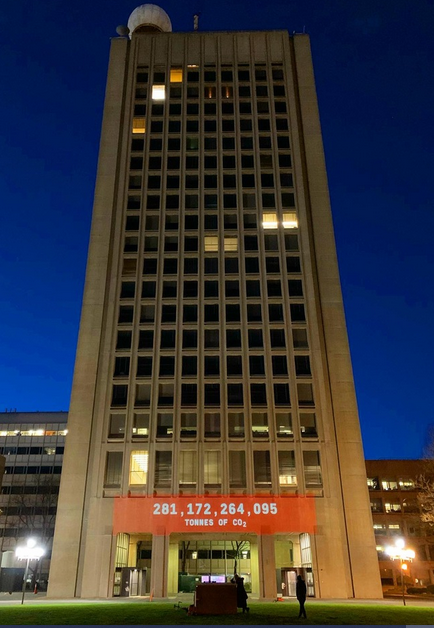
Projection 1: April 22 (Earth Day) to April 30, 2021. The location of
this projection was at the bottom of the south façade of the MIT Green Building.
Projection 2: October 29 to November 21, extended to December 21, 2021. The location of this
projection was at the top of the west façade of the MIT Green Building.
Projection 3: April 22 (Earth Day) to May 27, 2022. The location of this projection
was at the top south façade of the MIT Green Building.
Projection 4: November 8 to 18, 2022. The location of this projection
was at the top south façade of the MIT Green Building.
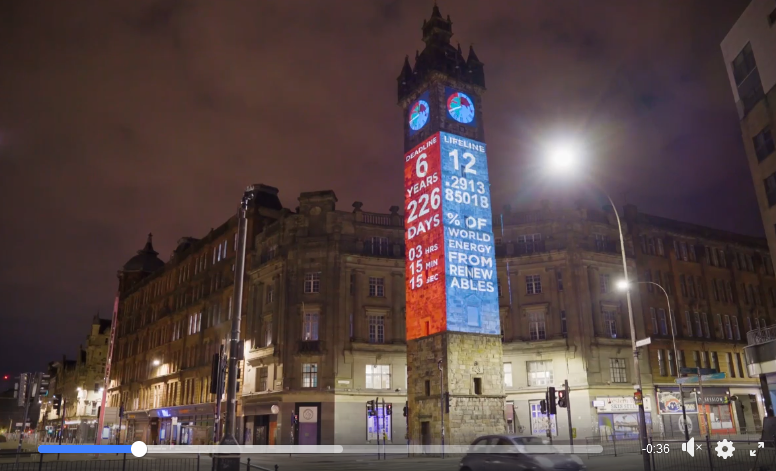
In 2021, the team projected onto the west side of the Green building, as
seen in the video below.
Video Credit: Gaurav Patekar
Our team has evolved the "climate message" concept over time. The first
four projections, included the NYC Climate Clock "deadline" and "lifeline" calculations.
Both their message and our message centered
around the "the deadline" — the projected time remaining before the
global average annual temperature warming exceeded 1.5°C, the more ambitious
of the Paris Climate Goals. Concurrently, the team collected responses from the
MIT community via a survey conducted with passers-by at the Stratton Student
Center. Incorporating community feedback and anticipating global average
temperature to overshoot the 1.5oC goal sooner than projected, we decided on
a new MIT Climate message in April 2023: the MIT "Net-Zero Meter." This
projection showed MIT's progress and commitment to achieve net-zero
greenhouse gas emissions by a 2050 deadline.
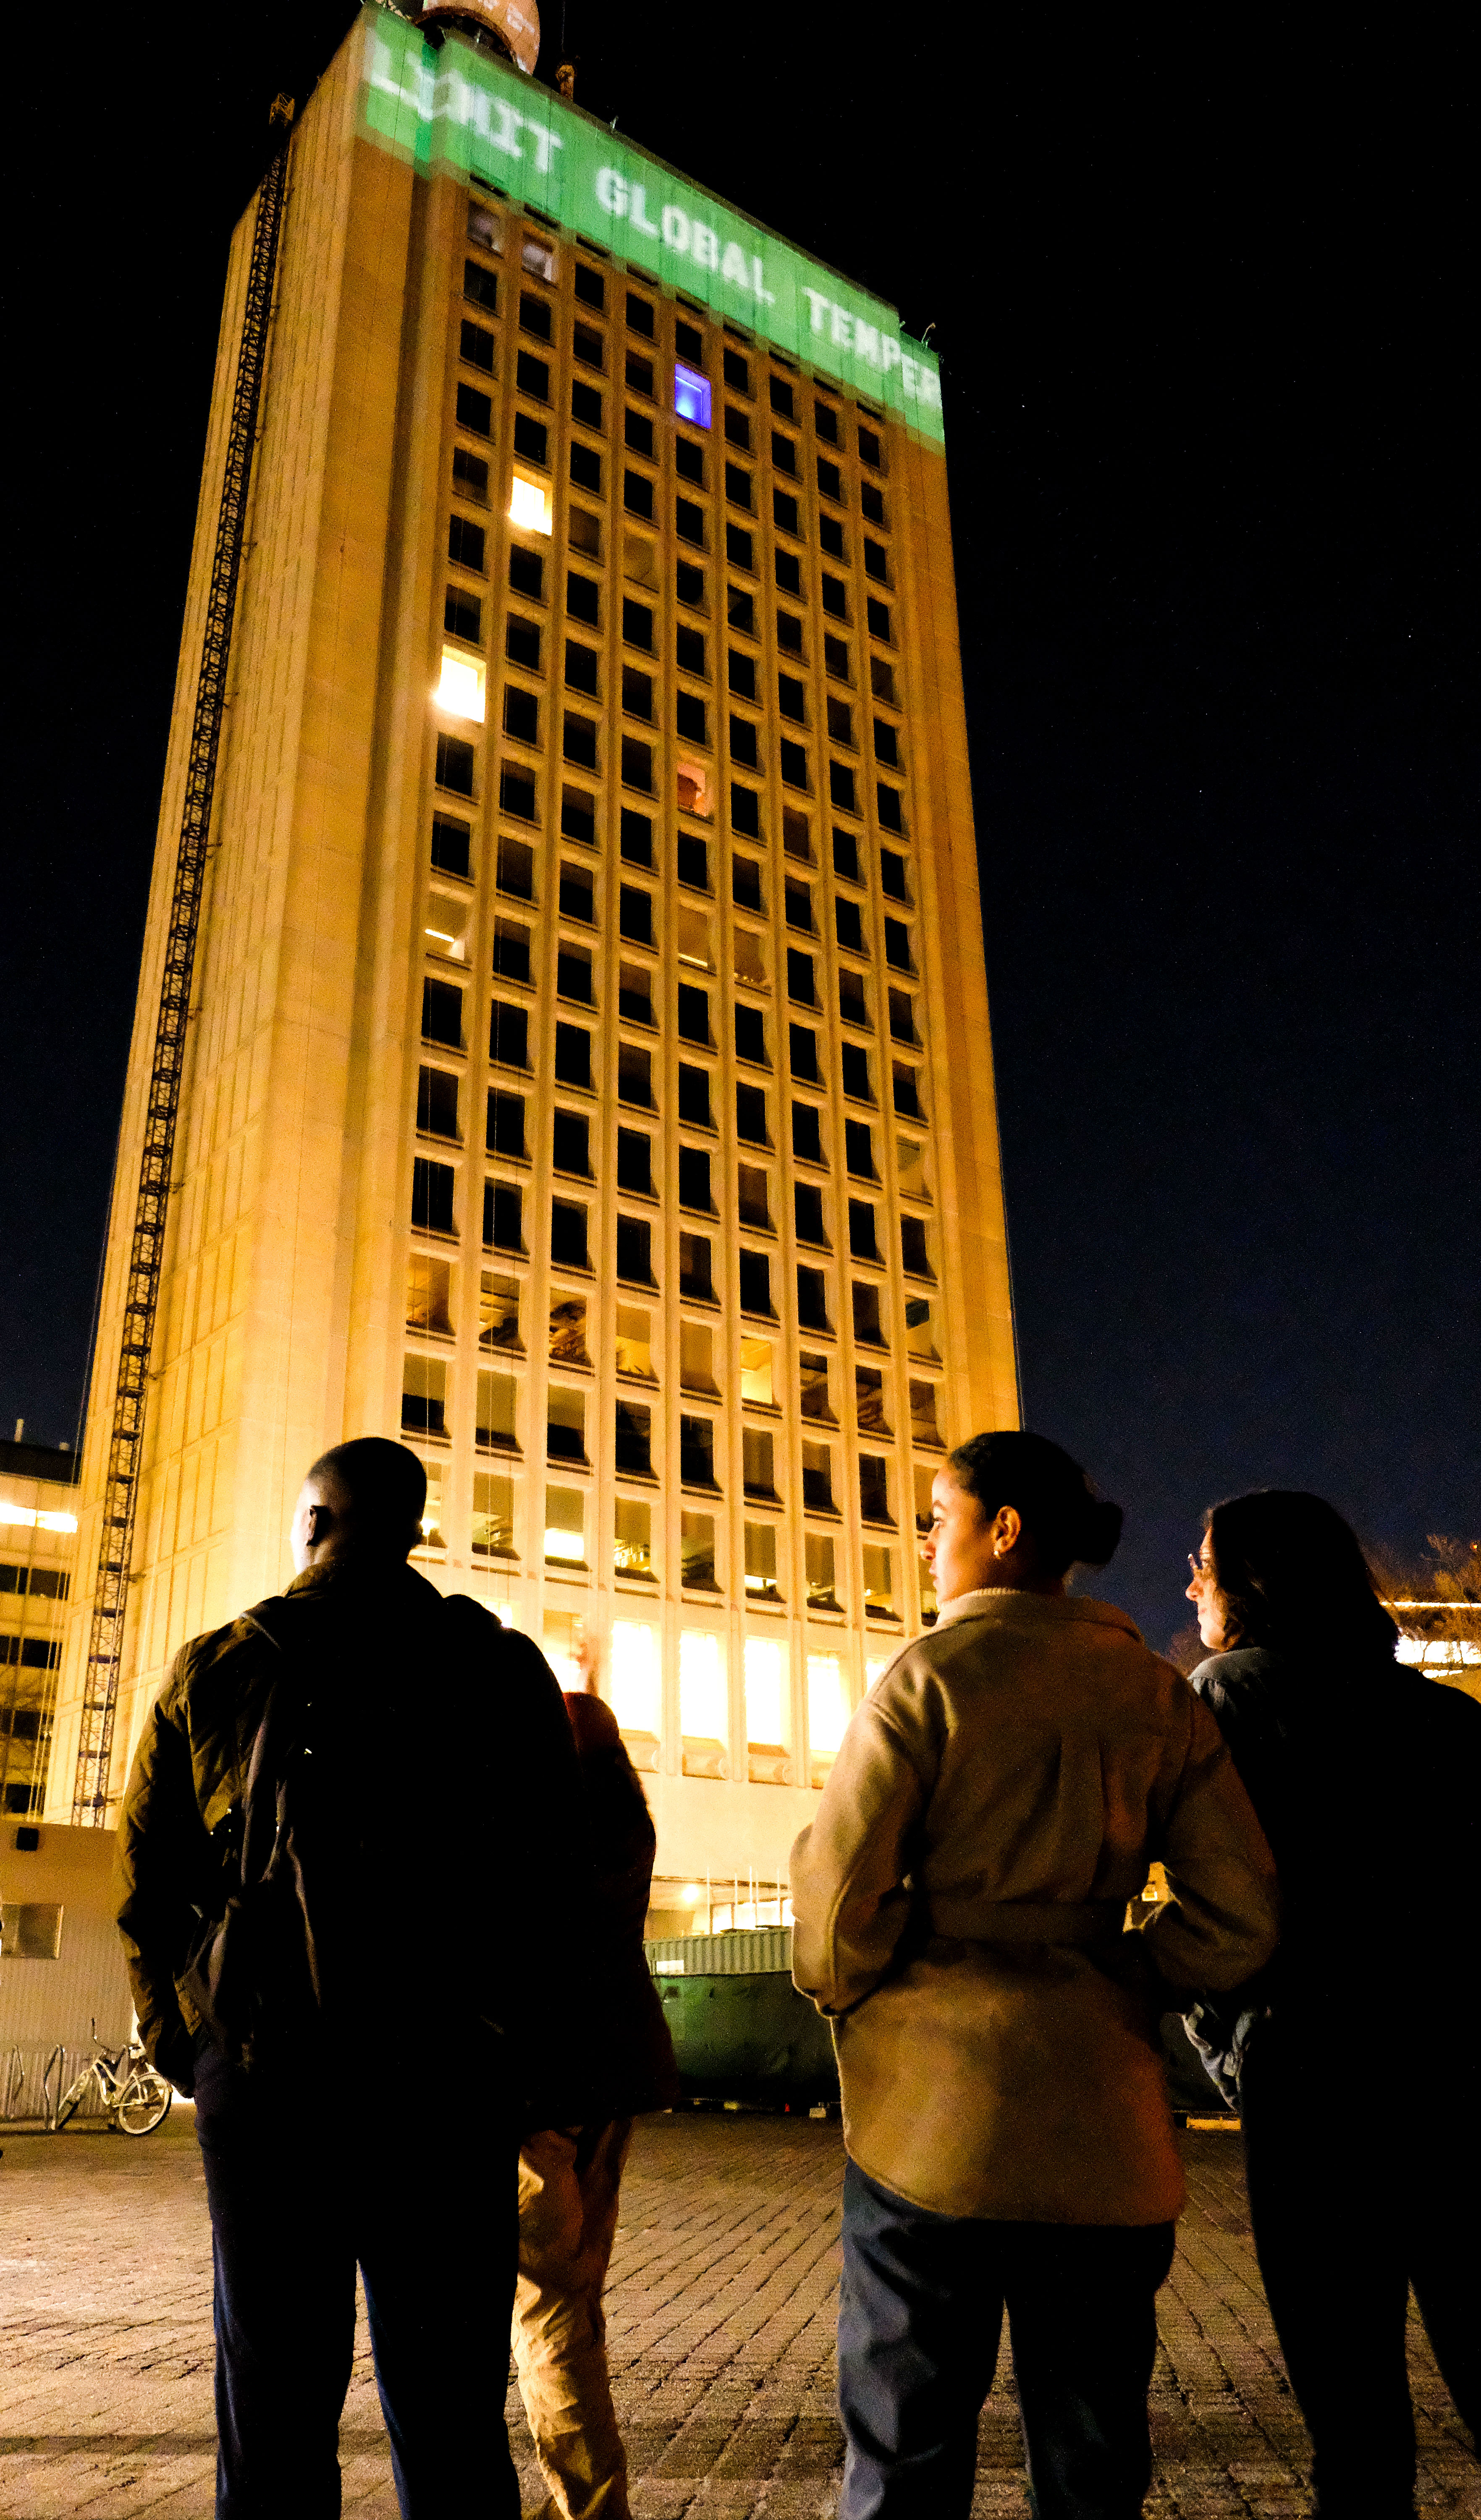
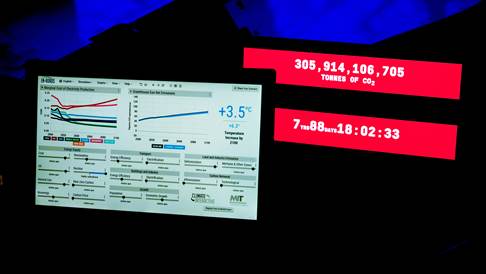
What the First Climate Clock Shows
GOAL: LIMIT GLOBAL TEMPERATURE RISE TO 1.5°C (2.7°F)
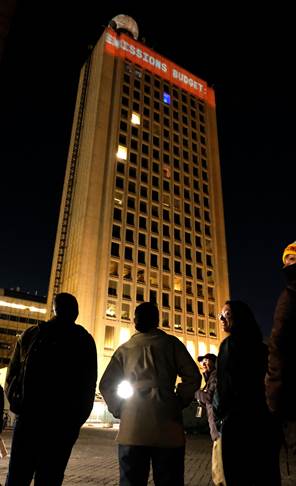
CO2 EMISSIONS BUDGET:
DEADLINE: ZERO EMISSIONS BY:
LIFELINE: % OF WORLD'S ENERGY FROM RENEWABLES:
TOGETHER WE CAN CHANGE!
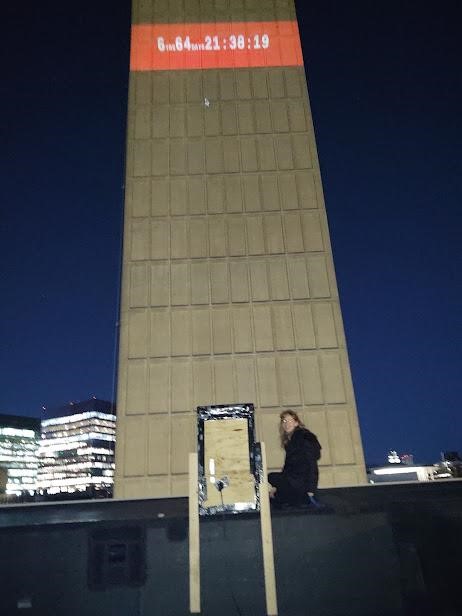
We project scientifically accurate information on the top of the south
face of the Green Building. The building is one of the tallest in Cambridge,
and home to the MIT Department of Earth, Atmosphere and Planetary Sciences.
The MIT Climate Clock features four lines that highlight the need for climate
action.
Goal
to limit global temperature increase to 1.5°C (2.7°F) which is the target
embraced in the COP21 Paris Agreement. The Paris Agreement, signed in 2015, is a legally binding international treaty on climate change to "limit global warming to well below 2, preferably to 1.5 degrees Celsius, compared to pre-industrial levels"
Carbon Dioxide Emissions Budget
a very large number from which one derives the actual
time of the climate clock. The "Carbon Dioxide Emissions Budget" represents how much carbon dioxide
the world as a whole can release into the atmosphere with at least a 66% chance of avoiding
global average temperature increases of 1.5°C (2.7°F).
Deadline
Credible current projections suggest we have about seven years left at current
emission rates. The "Deadline" is another way of expressing the carbon dioxide emissions budget.
It's the time we have left to take decisive action to limit global average temperature increase
to 1.5°C (2.7°F).
Lifeline
The "Lifeline" represents the percentage of the world's energy that is
currently provided through renewable sources.
TOGETHER WE CAN CHANGE!
This project has given us hope. As one team member, Jenning Chen, MIT'21,
puts it "I am a senior. I am graduating after four years. Yet this is the
best thing I have ever done at MIT."
History has shown that with united action, we can have a global impact.
It's been done before. For example, as a direct result of global actions
taken after signing the historic Montreal Protocol, satellite data has shown
that the ozone hole has healed.
In 2021, climate campaigners at the Glasgow, Scotland Conference of the
Parties COP26 turned out in huge numbers, massively exceeding expectations.
Youth-led groups, such as Friday for the Future, Extinction Rebellion and
the Saturday Global Day of Action showed that the climate movement by youth
and ordinary citizens matters and can make a difference.
Humans are a powerful species — we have changed the climate of the entire
planet without intending to. Now, with conscious effort and the force of a
committed global community, we must help create a livable climate to survive.
By acting together, we can turn this emergency into an opportunity to create
a better world. The ultimate goal that we aspire to is a habitable and
equitable planet for all humans and all life on Earth.
Sources of the Numbers
Our carbon dioxide budget data is aligned with the latest IPCC AR6 2021 report
(see table SPM.2). The resulting deadline should closely mirror the numbers displayed on the Mercator Institute website
. Lifeline global renewable energy sourcing estimates are the result of counting forward from the middle of 2020 starting from 12.55%, based on
data from the World Energy 2021 Special Report.
In order to figure out the time available for action, one can compute a carbon dioxide budget.
The budget answers the question "how much carbon dioxide can we put into the atmosphere,
globally, before reaching 1.5°C above pre-industrial levels?"
To solve for the budget, one needs to know the "account limit" and the expenses.
The Account Limit: Carbon Dioxide Threshold
Using measurements and models, scientists calculated the maximum amount of carbon dioxide
that can be in the atmosphere without exceeding a certain average temperature above
pre-industrial levels by 2100. The number is approximately 400 giga-tonnes of carbon dioxide
[IPCC AR6].
The Expenses: Atmospheric Carbon Dioxide
But how much carbon dioxide is already in the atmosphere? Measurements are taken regularly
at Mauna Loa Observatory in Hawaii. At the start of 2022, there was
already 417
ppm of carbon dioxide in the atmosphere, up from under 300ppm in 1950
[IPCC
AR6, A.1.1]. Every year that more carbon dioxide is emitted into the atmosphere,
atmospheric carbon dioxide "expenses" increase. By the same token, as we reduce our
CO2 emissions, or sequester carbon, our expenses decrease. If our sequestration
equals our emissions, we've hit "net-zero," such that we're removing as much carbon
from the atmosphere as we're putting into it.
The Balance: CO2 Emissions Budget
The balance is simply the limit minus the carbon dioxide already in the atmosphere. We
call this number the "CO2 Emissions Budget." It decreases each day as
more carbon dioxide goes into the atmosphere.
To convert the carbon dioxide budget into a countdown clock, we make assumptions about
our world. We assume that global carbon dioxide emission rates stay fixed, and calculate
how much time is left before the budget is used up. We use the assumption that
the CO2 Emissions budget is reduced by 42.2 Gt of CO2 per year, or 1,337 tonnes/sec
based on this reference: Mercator Research
Institute on Global Commons and Climate Change (MCC).
The Mercator Research Institute relies on data from the recent IPCC Special Report
on Global Warming of 1.5°C . Calculations are based on the year 2020, counting
down the expended carbon budget from there. The budget specifically addresses
carbon dioxide, not directly including additional greenhouse gasses such as
methane. Carbon dioxide is particularly important, as it remains in the atmosphere
on the order of 300-1000 years.
There are other limitations to our budget calculation. The annual emissions of
42.2 Gt-CO2/yr from the MCC include sources like "burning fossil fuels, industrial
processes and land-use change". They do not factor in additional emissions from
long-term changes in natural sources and sinks due to potential thresholds and
tipping points, such as such as permafrost melting causing the release of gas
hydrates, melting of the Greenland or Antarctic ice sheets, slowing down the
North Atlantic deep ice circulation or the dieback of the Amazon rainforest.
While the effects of these natural sources are large, the timescale for these
changes may be on the order of decades to centuries, which is much longer than
the timescale of our climate clock. Thus we chose not to include these in the
budget (but will continue to revisit those issues).
COVID-19 temporarily changed our global carbon dioxide emission rate. According to
the Global
Carbon Project report from December 11, 2020, "Total CO2 emissions
from human activities (from fossil CO2 and land-use change) are set to
be around 40 billion tonnes of CO2 in 2020, compared to 43 billion
tonnes of CO2 in 2019." Furthermore, "global fossil CO2 emissions are
expected to decline approximately 2.4 billion tonnes of CO2 in 2020 (-7%), a record
drop. The decrease in emissions, caused by COVID-19 confinement measures in place,
brings global fossil CO2 emissions to 34 billion tonnes of CO2... Emissions in 2019
were only 0.1% above emissions in 2018, at 36.4 billion tonnes of CO2."
Since 2020, we have begun to see a rebound effect, however. Thus we can approximate
total annual emissions, mostly from fossil fuels and land use changes, as 42.2
GtCO2 for the purposes of our climate clock.
Of course there is uncertainty in our future emissions. Our goal is not to predict
the future, but rather to ignite action to move towards a liveable future for humanity.
Visit the Global
Carbon Project to learn from scientists about how international responses to COVID-19
have impacted emissions, and thus the carbon dioxide budget.
Measuring the Progress of Renewable Energy
Energy produced from burning fossil fuels contributes more than any other source
to the increasing levels of carbon dioxide in the atmosphere. Sourcing energy from
renewables instead means less carbon going into the atmosphere. It was estimated
in the World Energy Special Report 2021 by BP that in 2020, 12.55% of the world's
energy came from renewable sources and hydro-electric: 5.7% from renewables, and
6.86% from hydro [World
Energy Special 2021 Report, page 11]. Including nuclear
leads to ~16.8%. Energy consumption consists of electricity, transport and heating
energy. When examining just electricity, renewables (including hydro) comprise
27.8% of the electricity sources in the world [WE report, page 65]. In
our accounting, renewables include solar, wind, hydropower, and modern bio-fuels.
We do not include nuclear, or traditional biofuels (such as fuel-wood, forestry
products, animal and agricultural waste) in the estimate. Around the world, even
as the supply of energy increases, more and more energy is derived from renewable
sources.
To pass net-zero, the point when globally we begin extracting carbon from the
atmosphere, we need this percent to increase as much as possible towards 100%.
According to World Energy data, the growth rate of renewables (and biofuels, no
hydro) for 2020 was 12.5%. In fact, despite decreases in energy consumption,
renewable generation still increased. For hydro it was 1% with 4296 Terra-watt-hours
of energy from hydro.
For our computations, we use the following numbers:
2020 renewables (hydro+solar) = 38.16 + 31.71 = 69.87eJ
2019 renewables (hydro+solar) = 37.69 + 28.82 = 66.51eJ
2020 total energy consumption = 557.10eJ
2019 total energy consumption = 581.51eJ
2020 renewable energy / total = 12.541734%
2019 renewable energy / total = 11.43746%
For our projection, we begin at 12.541734% at the middle of 2020, and approximate
the increase of renewables based on 3.501617*10^-8 %/sec, which comes from
(12.541734%-11.43746%)/(365*24*3600s). If nuclear were included as a low-carbon
source, the lifeline would be roughly 4.24% higher.
Harvard Lehman Hall, 2022 and 2023
Beyond MIT, with Harvard students and colleagues, we helped them launch their
first Harvard Climate Clock in Harvard Yard on the upper façade of Lehman Hall
for Earth Day events on April 22nd, 2022 and again on Earth Day 2023.
Harvard got its own Climate Clock thanks to a Harvard PhD student,
Anita Chandrahas, who took the D-Lab class in 2022 and joined the MIT
Climate Clock team. Anita then brought a Climate Clock to Harvard while
also connecting with a "Great Food Transformation" class at Harvard.
Anita's work inspired a student team in that class to engage with the
LED Climate Backpack action.
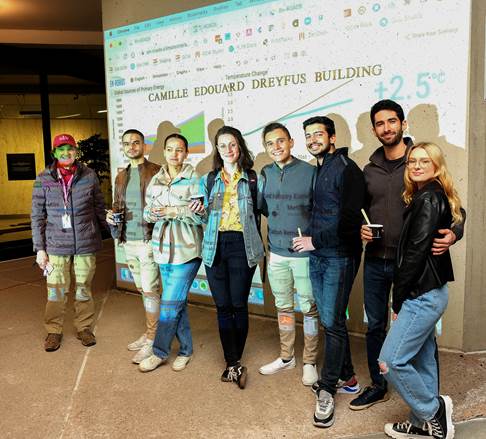
MIT and Harvard, 2022 and 2023
As part of our parallel Earth-Day events at MIT and Harvard, we engaged
people using Climate
Interactive's En-ROADS simulator to learn about the climate.
Plant-based ice cream served in compostable dishes was served to showcase
sustainable food solutions.
Photo Credit: Ella Lopez
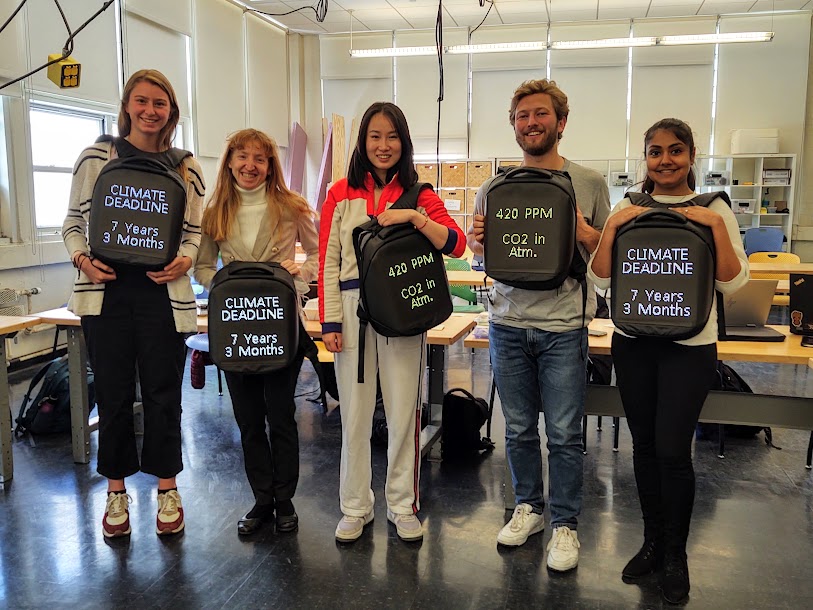
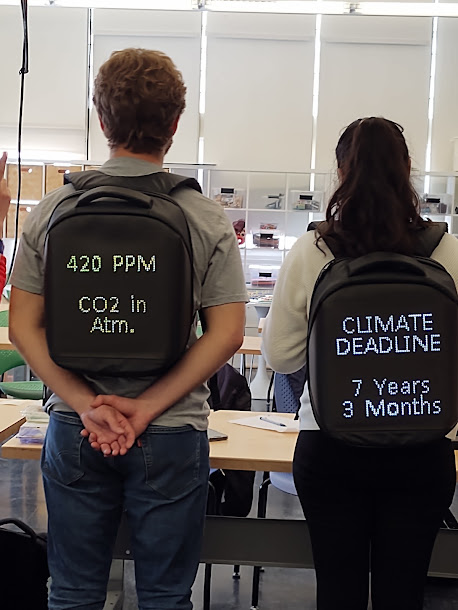
Streets of Cambridge, 2022 and 2023
Credit: Claire Wang
Beyond the big screen, we've gone mobile via backpack! Gaurav Patekar (MIT'21)
conceived of a community awareness project where climate information is displayed
on an LED backpack. People can volunteer to borrow the backpack for a week,
sparking conversations about our climate. Volunteers can then pass the
backpack on to another person to continue the chain of engagement.
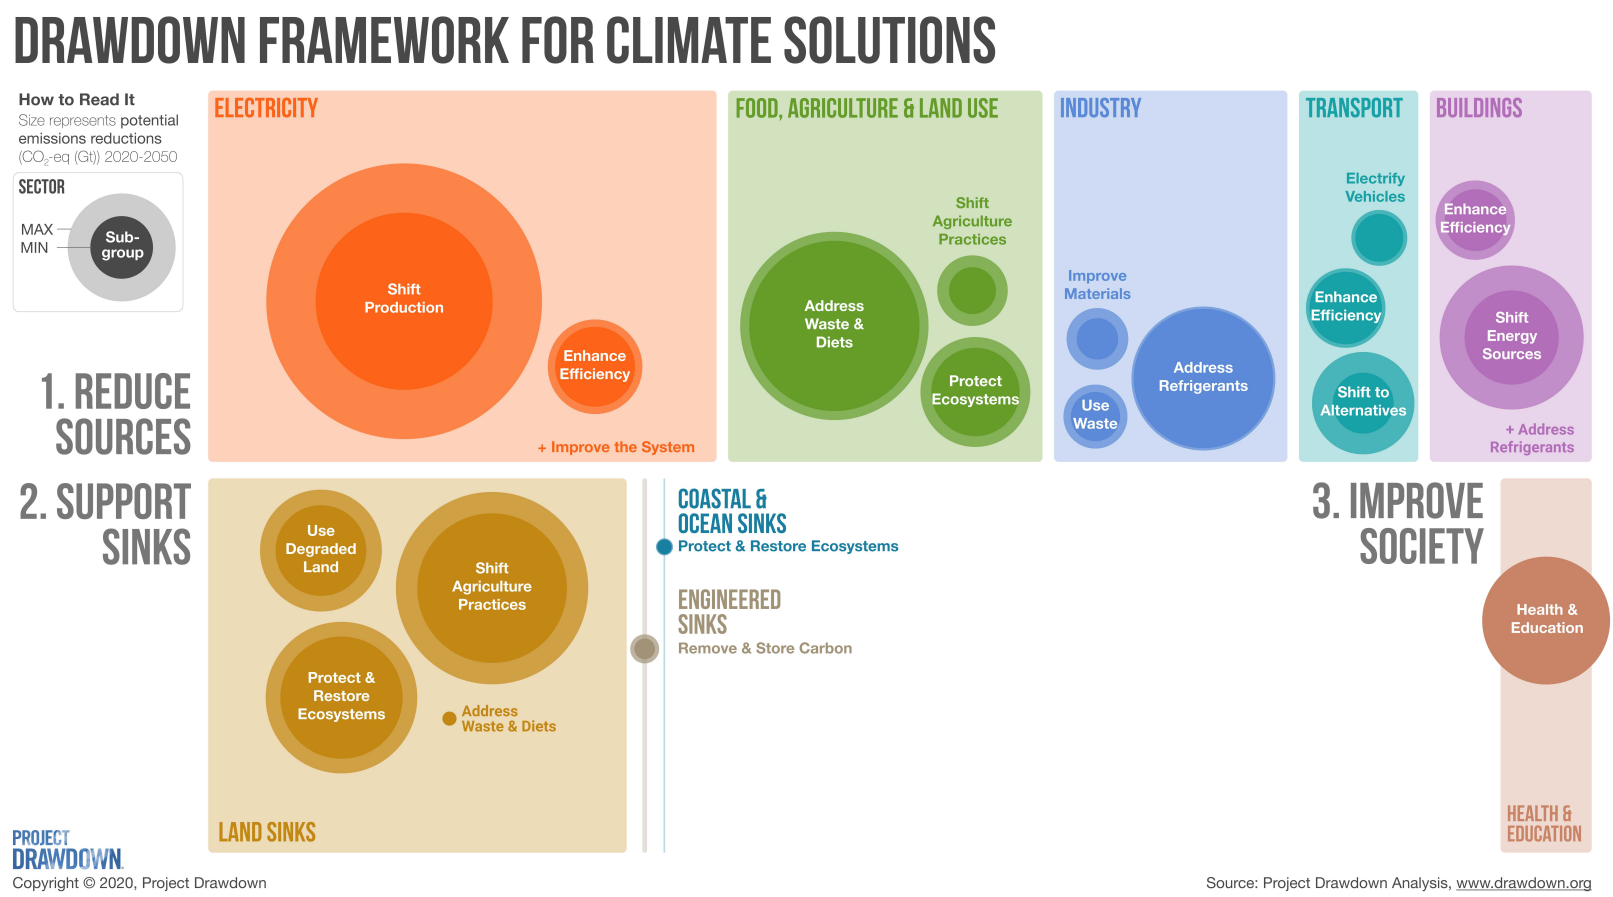
The Solutions
Thinking Globally
Speaking on Sept. 20, 2023, U.N. Secretary General Antonio Guterres
said that: "Concentrations of CO2 [are] at their highest in
2 million years... [The] 1.5° limit is achievable, but will take
a quantum leap in climate action."
U.N. Secretary Guterres laid out a simple for leaders:
Commit to reaching net zero as close as possible to 2040;
Ensure net zero electricity generation by 2035;
Cease funding new oil and gas;
Stop expansion of existing oil and gas reserves;
Shift fossil fuel subsidies to a just energy transition;
Detail actual emissions cuts for 2025 and 2030;
Deliver climate justice to those on the frontlines of many crises;
Scale up finance and capacities for adaptation and loss and damage;
Implement the Loss and Damage fund.”
Let's change our climate trends for the better by scaling up great solutions!
For additional inspiration and action-oriented ideas, visit the following resources:
Hosted November 11-13, 2023, TEDx-Boston Planetary Stewardship talks "elevate transformative
ideas on climate"
Hosted November 13-14, 2022, TEDx-Boston Planetary Stewardship talks "elevate transformative
ideas on climate"
Climate Interactive
"creates and shares tools that drive effective and equitable climate action." Policies
enable solutions, and what better way to learn than to try out simulated scenarios
yourself and share with others!
MIT-Industry collaboration via the MIT Climate
and Sustainability Consortium
is all about "working together to vastly accelerate the implementation of large-scale,
real-world solutions, across sectors, to help meet global climate and sustainability challenges"
MIT Climate Grand Challenges is
"a whole-of-MIT initiative to deliver high-impact climate solutions for the world"
For additional MIT Climate Solutions - stay tuned for updates!
If you have a solution you'd like to share with us, please Contact Us.
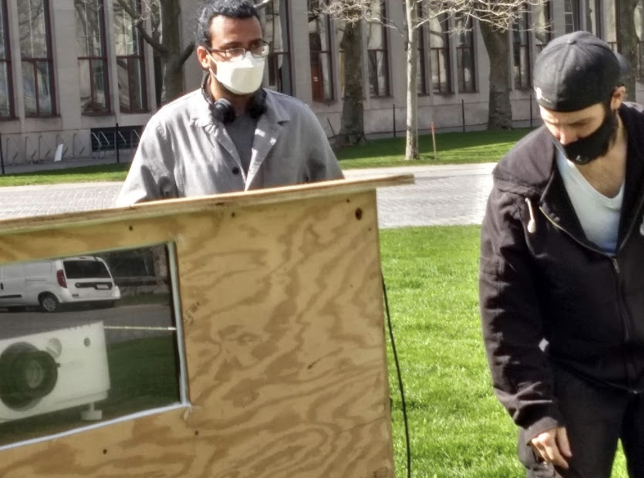
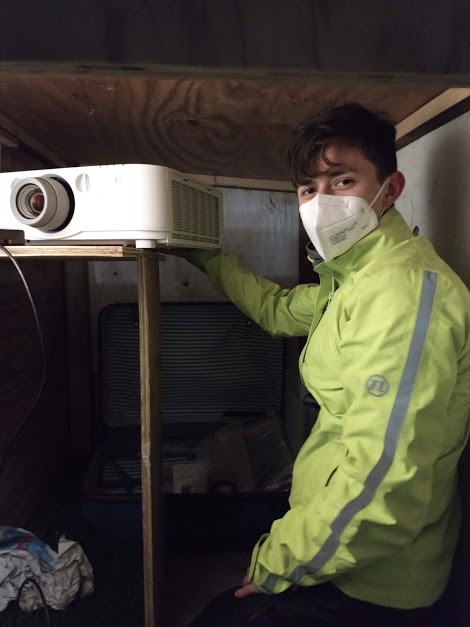
Creating a Climate Clock
Just a handful of team members took the climate clock idea from dream to
reality, and we did so during the COVID-19 pandemic!
Photos show MIT Climate
Clock team members: Jillian James (MIT'10, '16) left, and Gaurav Patekar (MIT'21)
center and Alejandro Diaz (MIT'21), right.
You can build a Climate Clock in your own home, community, school or university,
even at a public park or public square. You can promote a climate clock on social media. Here are a few
resources if you want to build your own climate clock on your campus, school,
at work, in your city, or on a webpage.
Check out
our code for the numbers and clock website
The Climate Clock projections have been a sustained effort on the part of an outstanding
team. The undergraduate and graduate cross-disciplinary team comes from Electrical
Engineering and Computer Science, Mechanical Engineering, Aero-Astro, Chemistry, the
Media Lab, as well as Harvard University Law and Medical Schools, many tied in
through the D-Lab class projects.
Original team members include Alejandro Diaz (MIT'21, Course 6.2), Gabriela
Cazares (MIT'2020, Course 5, now in a Ph.D. at UC-Berkeley studying atmospheric
chemistry) and Lowry Yankwich, Harvard Law School '22, all three of whom kicked
off the pre-Climate Clock project during summer 2020.
In 2020, the team was joined by alumna Jillian James, MIT'10, '16, Course 16,
who has supported all aspects of the work. Spring 2021 term added new team members
Jenning Chen (MIT'21, Course 6.3) who worked with Alejandro to do all the programming,
as well as Gaurav Patekar, MIT'21, Media Lab, who did major design work with
Alejandro to ensure that the Climate Clock actually went live, first in Spring
2021 and then Fall/Winter 2021. Gaurav was also the creator of the LED Climate
backpacks. Our team leaders and mentors are Susan Murcott
(MIT'92), Lecturer, MIT D-Lab and Julie Simpson, Research Engineer, MIT Sea Grant.