


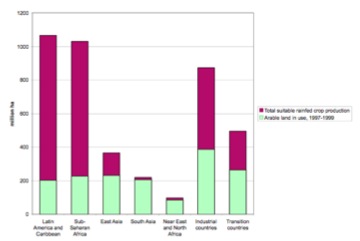
In January 1981, the The New York Times article “Down on the Farm, Higher Prices” explained the economic impacts of drought, predicting a 10%-15% increase in average US consumer food bills resulting from a lack of rainfall in 1980. Agricultural productivity is strongly correlated to soil moisture, as examined by studies such as: The Effect of Water Stress on Corn in its Various Stages [Claassen, 1995]. As the world’s food supply continues to be taxed by its burgeoning population a greater percentage of arable land will need to be utilized and land currently producing food must become more efficient (below) [Harrison et al.,
2002].


Even in regions of the world where weather and climate prediction aremost accurate, the fluctuations in rainfall (below) and temperature that dictate the productivity of arable land are largely unpredictable beyond synoptic time scales at a useful resolution. Variability, both natural (e.g. El Ni˜no, ENSO, Little Ice Age) and human induced (e.g. CO2, land use change, aerosols), make the task of optimizing the use of arable land problematic. Numerical modeling is one approach used to gain a better understanding of local land-atmosphere processes.
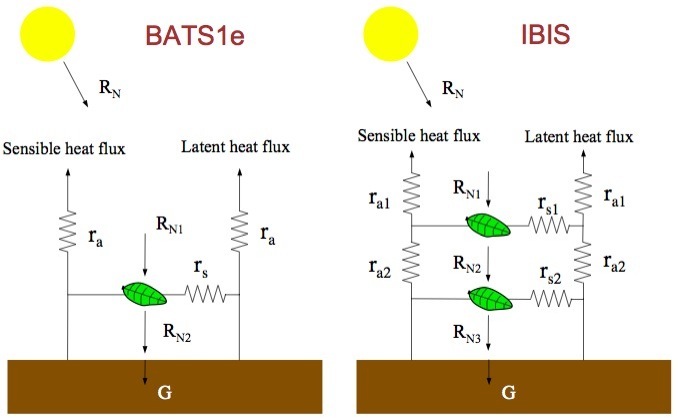
Currently, I'm using Regional Climate Model version 3 coupled with two different surface physics schemes, Integrated Biosphere Simulator and Biosphere-Atmosphere Transfer Scheme 1e, to explore the accuracy of atmospheric/surface modeling and the sensitivity of the coupled land- atmosphere system to perturbations in the radiative forcing.
Conceptual resistance diagrams of BATS1e and IBIS. Latent heat flux from BATS1e and IBIS show a one and two-layer canopy system, respectively.
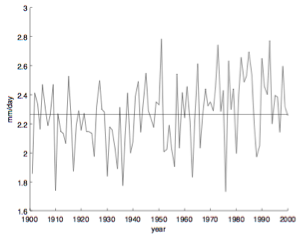
Yearly averaged rainfall over a Midwest domain (98.9 W:83.9 W, 37.0 N:48.6 N) for the years 1901-2000 [Mitchell et al., 2003]
Cropland in use and total suitable land [Harrison et al., 2002]