Cleanup! can be used to
instruct in hydrogeologic concepts, augmenting textbook
exercises on such fundamental concepts as Darcy’s
Law. It can also be used to apply these fundamental
concepts to complex situations. Cleanup! also provides
the student an opportunity to explore these concepts on
his or her own.
These example screen shots of the MMR illustrate some
of the instructive capabilities of Cleanup!.
|
|
|
|
|
|
|
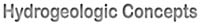
 This map (Masterson and Barlow,
1994) shows contours of water table elevations in
West Cape Cod, Massachusetts. The groundwater mound is
due to precipitation recharging the groundwater and
moving toward the coasts. In this example, the entire
West Cape has been simulated. The user can then focus on
an area of particular interest. In these examples, we
focus on the Massachusetts Military Reservation (MMR)
located near the center of the West Cape, as indicated by
the rectangle. This map (Masterson and Barlow,
1994) shows contours of water table elevations in
West Cape Cod, Massachusetts. The groundwater mound is
due to precipitation recharging the groundwater and
moving toward the coasts. In this example, the entire
West Cape has been simulated. The user can then focus on
an area of particular interest. In these examples, we
focus on the Massachusetts Military Reservation (MMR)
located near the center of the West Cape, as indicated by
the rectangle. |
|
|
|
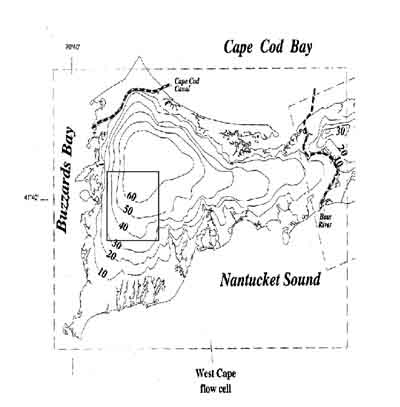
This figure
shows contours of groundwater levels simulated by
Cleanup! within the area of interest. Transmissivity
values vary and are based on field measurements reported
by the USGS (Masterson et al., 1997). Based on the
contours the student can estimate the magnitude and
direction of the hydraulic gradient. Using values of
hydraulic conductivity and porosity, a student can also
estimate the rate of groundwater movement. Cleanup!
can also plot streamlines. To
generate a streamline, click as indicated.
|
|
|
|
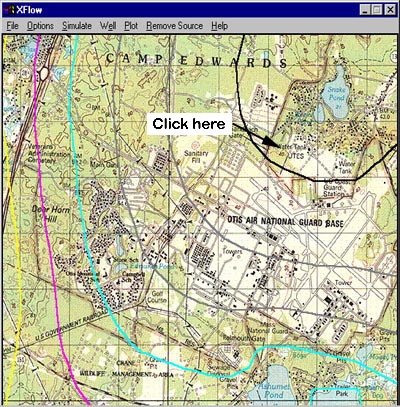
A streamline
represents the path followed by water and contaminants
from the location specified by a click of the mouse. Streamlines
can be used to predict the direction in which a contaminant plume will move.
|
|
|
|
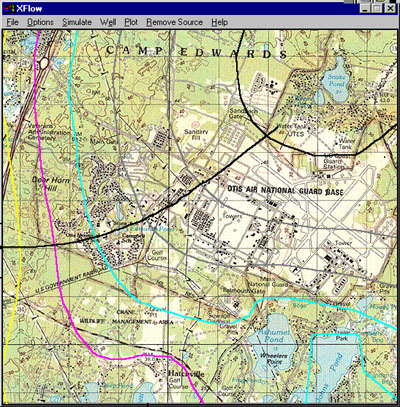
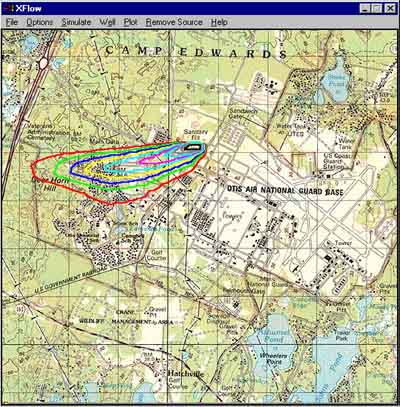
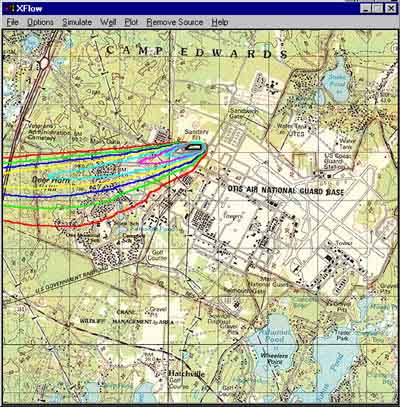
These
figures illustrate the contaminant transport
capability of Cleanup!. They show a simulated Landfill-1
plume at an early time and a later time.
|
|
|
|
The
irregular shapes of the plumes are due to the spatial
variability of transmissivity and the shape of the
coastline. By using the simulation capability, the
student can gain an understanding of plume behavior in a
realistic field setting.
|
| |
|
