music21.graph
Tools for graphing, plotting, or otherwise visualizing Stream objects.
The easiest and most common way of using plotting functions is to call
.plot(‘typeOfGraph’) on a Stream. See plot().
That method uses tools from the music21.graph.findPlot module to map between
names of plots and classes that can show them.
The PlotStream
subclasses in the music21.graph.plot module give easy to use
and configurable ways of graphing data and structures in
Stream objects. These Plot objects use classes from
the music21.graph.axis module to automatically extract relevant data for you.
At a lower level, the Graph subclasses
in the music21.graph.primitives modules give abstract fundamental
graphing archetypes using the matplotlib library. They are to be used when
you already have data extracted on your own but still want to take advantage
of musically-aware axes and scaling.
From highest level to lowest level usage, ways of graphing are as follows:
streamObj.plot(‘graphName’)
graph.plot.Class(streamObj).run()
plotter = graph.primitives.Class(); plotter.data = …; plotter.process()
Use matplotlib directly to create any graph, musical or non-musical.
Functions
- music21.graph.plotStream(streamObj: stream.Stream, graphFormat: str | None = None, xValue=None, yValue=None, zValue=None, **keywords)
Given a stream and any keyword configuration arguments, create and display a plot.
Note: plots require matplotlib to be installed.
Plot methods can be specified as additional arguments or by keyword. Two keyword arguments can be given: format and values. If positional arguments are given, the first is taken as format and the rest are collected as values. If format is the class name, that class is collected. Additionally, every
PlotStreamsubclass defines one format string and a list of values strings. The format parameter defines the type of Graph (e.g. scatter, histogram, colorGrid). The values list defines what values are graphed (e.g. quarterLength, pitch, pitchClass).If a user provides a format and one or more values strings, a plot with the corresponding profile, if found, will be generated. If not, the first Plot to match any of the defined specifiers will be created.
In the case of
PlotWindowedAnalysissubclasses, theDiscreteAnalysissubclassidentifierslist is added to the Plot’s values list.Available plots include the following:
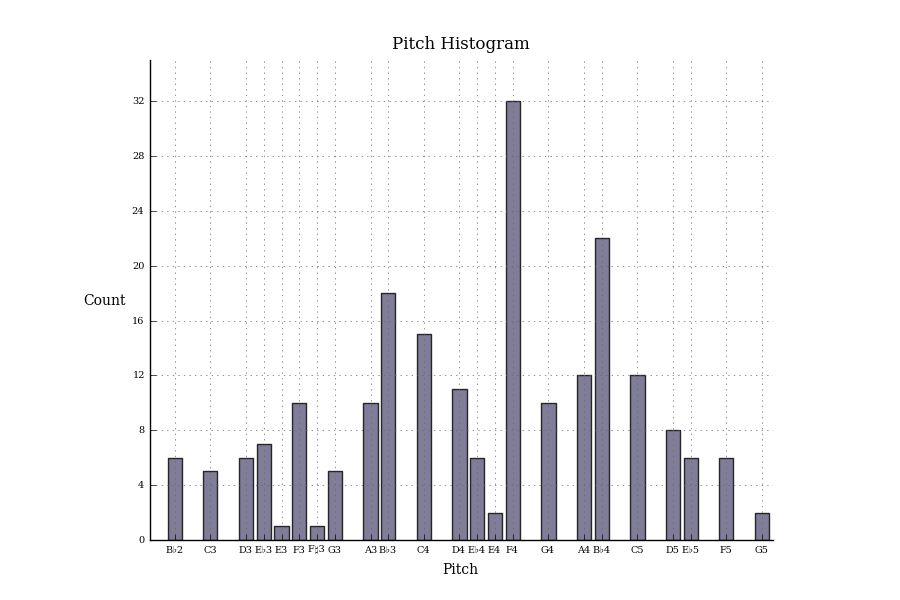
>>> s = corpus.parse('bach/bwv57.8')
>>> thePlot = s.plot('histogram', 'pitch')
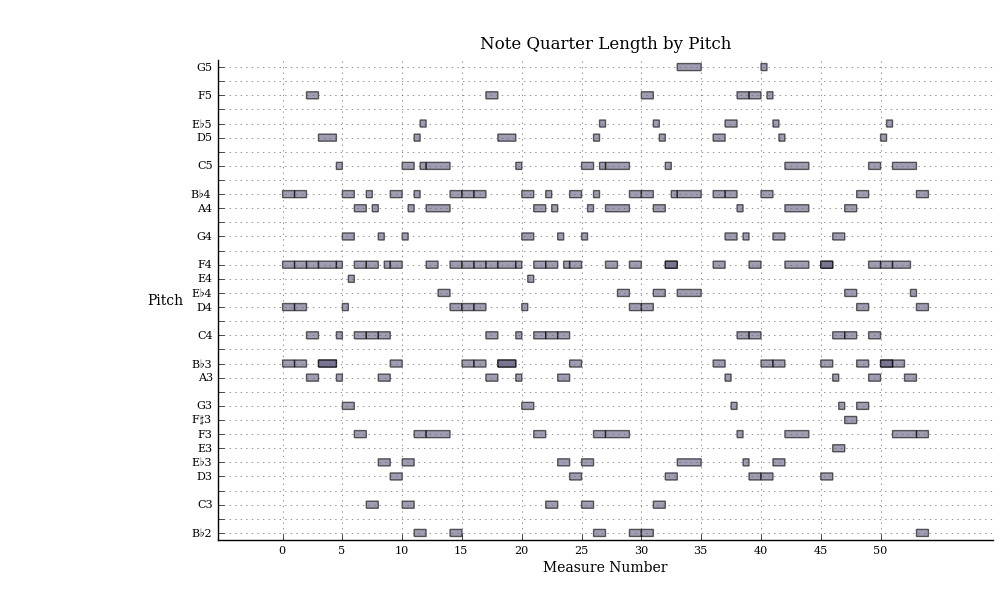
>>> s = corpus.parse('bach/bwv57.8')
>>> thePlot = s.plot('pianoroll')