music21.graph.primitives
Object definitions for graphing and plotting Stream objects.
The Graph object subclasses primitive,
abstract fundamental graphing archetypes using the matplotlib library.
From the highest level to the lowest level of usage, ways of graphing are as follows:
streamObj.plot(‘graphName’)
graph.plot.Class(streamObj).run()
plotter = graph.primitives.Class(); plotter.data = …; plotter.process()
Use matplotlib directly to create your graph.
Graph
- class music21.graph.primitives.Graph(**keywords)
A music21.graph.primitives.Graph is an object that represents a visual graph or plot, automating the creation and configuration of this graph in matplotlib. It is a low-level object that most music21 users do not need to call directly; yet, as most graphs will take keyword arguments that specify the look of graphs, they are important to know about.
The keyword arguments can be provided for configuration are:
doneAction (see below)
alpha (which describes how transparent elements of the graph are)
dpi
colorBackgroundData
colorBackgroundFigure
colorGrid,
title (a string)
figureSize (a tuple of two ints)
colors (a list of colors to cycle through)
tickFontSize
tickColors (a dict of ‘x’: ‘#color’, ‘y’: ‘#color’)
titleFontSize
labelFontSize
fontFamily
hideXGrid
hideYGrid
xTickLabelRotation
marker
markersize
Graph objects do not manipulate Streams or other music21 data; they only manipulate raw data formatted for each Graph subclass, hence it is unlikely that users will call this class directly.
The doneAction argument determines what happens after the graph has been processed. Currently, there are three options, ‘write’ creates a file on disk (this is the default), while ‘show’ opens an interactive GUI browser. The third option, None, does the processing but does not write any output.
figureSize:
A two-element iterable.
Scales all graph components but because of matplotlib limitations (esp. on 3d graphs) no all labels scale properly.
defaults to .figureSizeDefault
>>> a = graph.primitives.Graph(title='a graph of some data to be given soon', tickFontSize=9)
>>> a.data = [[0, 2], [1, 3]]
>>> a.graphType
'genericGraph'
Graph bases
Graph read-only properties
Read-only properties inherited from ProtoM21Object:
Graph read/write properties
- Graph.doneAction
returns or sets what should happen when the graph is created (see docs above) default is ‘write’.
Graph methods
- Graph.applyFormatting(subplot)
Apply formatting to the Subplot (Axes) container and Figure instance.
ax should be an AxesSubplot object or an Axes3D object or something similar.
- Graph.applyFormattingToOneAxis(subplot, axis)
Given a matplotlib.Axes object (a subplot) and a string of ‘x’, ‘y’, or ‘z’, set the Axes object’s xlim (or ylim or zlim or xlim3d, etc.) from self.axis[axis][‘range’], Set the label from self.axis[axis][‘label’], the scale, the ticks, and the ticklabels.
Returns the matplotlib Axis object that has been modified
- Graph.applyGrid(subplot)
Apply the Grid to the subplot such that it goes below the data.
- Graph.callDoneAction(fp=None)
Implement the desired doneAction, after data processing
- static Graph.hideAxisSpines(subplot, leftBottom=False)
Remove the right and top spines from the diagram.
If leftBottom is True, remove the left and bottom spines as well.
Spines are removed by setting their colors to ‘none’ and every other tick line set_visible to False.
- Graph.nextColor()
Utility function that cycles through the colors of self.colors…
>>> g = graph.primitives.Graph()
>>> g.colors = ['#605c7f', '#5c7f60', '#715c7f']
>>> g.nextColor()
'#605c7f'
>>> g.nextColor()
'#5c7f60'
>>> g.nextColor()
'#715c7f'
>>> g.nextColor()
'#605c7f'
- Graph.process()
Creates the figure and subplot, calls renderSubplot to get the subclass specific information on the data, runs hideAxisSpines, applyFormatting, and then calls the done action. Returns None, but the subplot is available at self.subplot
- Graph.renderSubplot(subplot)
Calls the subclass specific information to get the data
- Graph.setAxisLabel(axisKey, label, conditional=False)
- Graph.setAxisRange(axisKey, valueRange, paddingFraction=0.1)
Set the range for the axis for a given axis key (generally, ‘x’, or ‘y’)
ValueRange is a two-element tuple of the lowest number and the highest.
By default, there is a padding of 10% of the range in either direction. Set paddingFraction = 0 to eliminate this shift
- Graph.setIntegerTicksFromData(unsortedData, axisKey='y', dataSteps=8)
Set the ticks for an axis (usually ‘y’) given unsorted data.
Data steps shows how many ticks to make from the data.
>>> g = graph.primitives.GraphHorizontalBar()
>>> g.setIntegerTicksFromData([10, 5, 3, 8, 20, 11], dataSteps=4)
>>> g.axis['y']['ticks']
([0, 5, 10, 15, 20], ['0', '5', '10', '15', '20'])
TODO: should this not also use min? instead of always starting from zero?
- Graph.setTicks(axisKey, pairs)
Set the tick-labels for a given graph or plot’s axisKey (generally ‘x’, and ‘y’) with a set of pairs
Pairs are iterables of positions and labels.
N.B. – both ‘x’ and ‘y’ ticks have to be set in order to get matplotlib to display either… (and presumably ‘z’ for 3D graphs)
>>> g = graph.primitives.GraphHorizontalBar()
>>> g.axis['x']['ticks']
Traceback (most recent call last):
KeyError: 'ticks'
>>> g.axis['x']
{'range': None}
>>> g.setTicks('x', [(0, 'a'), (1, 'b')])
>>> g.axis['x']['ticks']
([0, 1], ['a', 'b'])
>>> g.setTicks('m', [('a', 'b')])
Traceback (most recent call last):
music21.graph.utilities.GraphException: Cannot find key 'm' in self.axis
>>> g.setTicks('x', [])
>>> g.axis['x']['ticks']
([], [])
- Graph.show()
Calls the show() method of the matplotlib plot. For most matplotlib back ends, this will open a GUI window with the desired graph.
- Graph.write(fp=None)
Writes the graph to a file. If no file path is given, a temporary file is used.
Methods inherited from ProtoM21Object:
Graph3DBars
- class music21.graph.primitives.Graph3DBars(*, alpha: float = 0.8, **keywords)
Graph multiple parallel bar graphs in 3D.
Data definition: A list of lists where the inner list of (x, y, z) coordinates.
For instance, a graph where the x values increase (left to right), the y values increase in a step pattern (front to back), and the z values decrease (top to bottom):
>>> g = graph.primitives.Graph3DBars()
>>> data = []
>>> for i in range(1, 10 + 1):
...    q = [i, i//2, 10 - i]
...    data.append(q)
>>> g.data = data
>>> g.process()
Graph3DBars bases
Graph3DBars read-only properties
Read-only properties inherited from ProtoM21Object:
Graph3DBars read/write properties
Read/write properties inherited from Graph:
Graph3DBars methods
- Graph3DBars.process()
Creates the figure and subplot, calls renderSubplot to get the subclass specific information on the data, runs hideAxisSpines, applyFormatting, and then calls the done action. Returns None, but the subplot is available at self.subplot
- Graph3DBars.renderSubplot(subplot)
Calls the subclass specific information to get the data
Methods inherited from Graph:
Methods inherited from ProtoM21Object:
GraphColorGrid
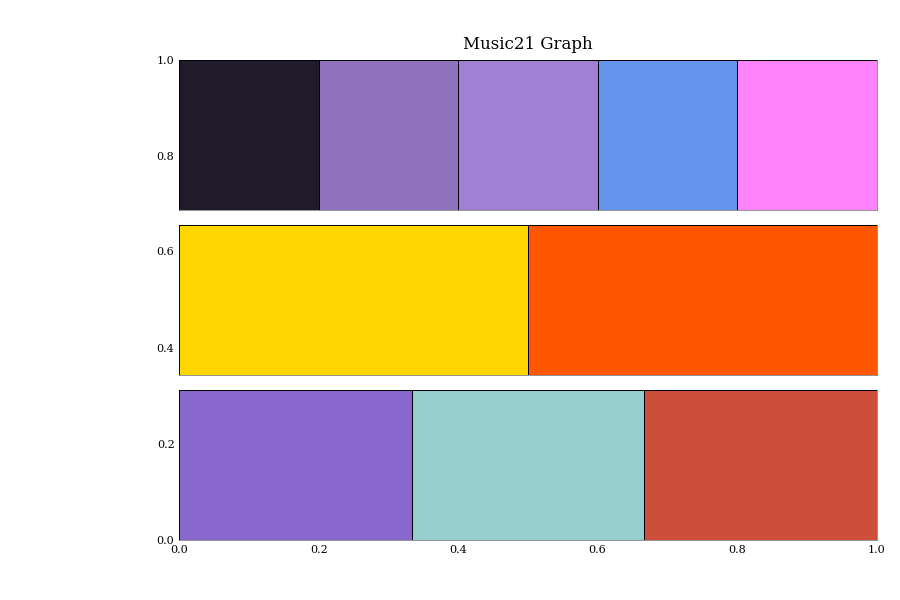
- class music21.graph.primitives.GraphColorGrid(**keywords)
Grid of discrete colored “blocks” to visualize results of a windowed analysis routine.
Data is provided as a list of lists of colors, where colors are specified as a hex triplet, or the common HTML color codes, and based on analysis-specific mapping of colors to results.
>>> g = graph.primitives.GraphColorGrid()
>>> data = [['#55FF00', '#9b0000', '#009b00'],
...         ['#FFD600', '#FF5600'],
...         ['#201a2b', '#8f73bf', '#a080d5', '#403355', '#999999']]
>>> g.data = data
>>> g.process()
GraphColorGrid bases
GraphColorGrid read-only properties
Read-only properties inherited from ProtoM21Object:
GraphColorGrid read/write properties
Read/write properties inherited from Graph:
GraphColorGrid methods
- GraphColorGrid.renderSubplot(subplot)
Calls the subclass specific information to get the data
Methods inherited from Graph:
Methods inherited from ProtoM21Object:
GraphColorGrid instance variables
- GraphColorGrid.hideLeftBottomSpines
bool to hide the left and bottom axis spines; default True
GraphColorGridLegend
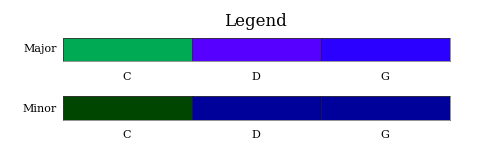
- class music21.graph.primitives.GraphColorGridLegend(**keywords)
Grid of discrete colored “blocks” where each block can be labeled
Data is provided as a list of lists of colors, where colors are specified as a hex triplet, or the common HTML color codes, and based on analysis-specific mapping of colors to results.
>>> g = graph.primitives.GraphColorGridLegend()
>>> data = []
>>> data.append(('Major', [('C#', '#00AA55'), ('D-', '#5600FF'), ('G#', '#2B00FF')]))
>>> data.append(('Minor', [('C#', '#004600'), ('D-', '#00009b'), ('G#', '#00009B')]))
>>> g.data = data
>>> g.process()
GraphColorGridLegend bases
GraphColorGridLegend read-only properties
Read-only properties inherited from ProtoM21Object:
GraphColorGridLegend read/write properties
Read/write properties inherited from Graph:
GraphColorGridLegend methods
- GraphColorGridLegend.makeOneRowOfGraph(figure, rowIndex, rowLabel, rowData)
Makes a subplot for one row of data (such as for the Major label) and returns a matplotlib.axes.AxesSubplot instance representing the subplot.
Here we create an axis with a part of Scriabin’s mapping of colors to keys in Prometheus: The Poem of Fire.
>>> import matplotlib.pyplot
>>> colorLegend = graph.primitives.GraphColorGridLegend()
>>> rowData = [('C', '#ff0000'), ('G', '#ff8800'), ('D', '#ffff00'),
...            ('A', '#00ff00'), ('E', '#4444ff')]
>>> colorLegend.data = [['Scriabin Mapping', rowData]]
>>> fig = matplotlib.pyplot.figure()
>>> subplot = colorLegend.makeOneRowOfGraph(fig, 0, 'Scriabin Mapping', rowData)
>>> subplot
<Axes: >
- GraphColorGridLegend.renderSubplot(subplot)
Calls the subclass specific information to get the data
Methods inherited from Graph:
Methods inherited from ProtoM21Object:
GraphColorGridLegend instance variables
- GraphColorGridLegend.hideLeftBottomSpines
bool to hide the left and bottom axis spines; default True
GraphGroupedVerticalBar
- class music21.graph.primitives.GraphGroupedVerticalBar(**keywords)
Graph the count of on or more elements in vertical bars
Data set is simply a list of x and y pairs, where there is only one of each x value, and y value is a list of values
>>> from collections import OrderedDict
>>> g = graph.primitives.GraphGroupedVerticalBar()
>>> lengths = OrderedDict( [('a', 3), ('b', 2), ('c', 1)] )
>>> data = [('bar' + str(x), lengths) for x in range(3)]
>>> data
[('bar0', OrderedDict([('a', 3), ('b', 2), ('c', 1)])),
 ('bar1', OrderedDict([('a', 3), ('b', 2), ('c', 1)])),
 ('bar2', OrderedDict([('a', 3), ('b', 2), ('c', 1)]))]
>>> g.data = data
>>> g.process()
GraphGroupedVerticalBar bases
GraphGroupedVerticalBar read-only properties
Read-only properties inherited from ProtoM21Object:
GraphGroupedVerticalBar read/write properties
Read/write properties inherited from Graph:
GraphGroupedVerticalBar methods
- GraphGroupedVerticalBar.labelBars(subplot, rects)
- GraphGroupedVerticalBar.renderSubplot(subplot)
Calls the subclass specific information to get the data
Methods inherited from Graph:
Methods inherited from ProtoM21Object:
GraphHistogram
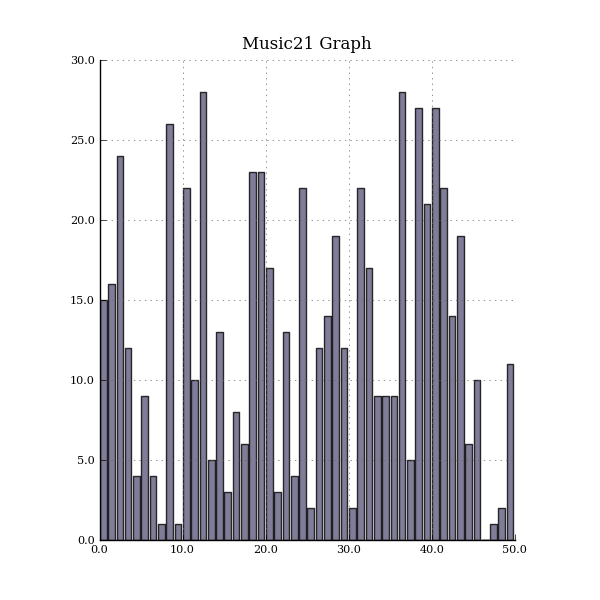
- class music21.graph.primitives.GraphHistogram(*, binWidth: float = 0.8, alpha: float = 0.8, **keywords)
Graph the count of a single element.
Data set is simply a list of x and y pairs, where there is only one of each x value, and y value is the count or magnitude of that value
>>> import random
>>> g = graph.primitives.GraphHistogram()
>>> g.graphType
'histogram'
>>> data = [(x, random.choice(range(30))) for x in range(50)]
>>> g.data = data
>>> g.process()
GraphHistogram bases
GraphHistogram read-only properties
Read-only properties inherited from ProtoM21Object:
GraphHistogram read/write properties
Read/write properties inherited from Graph:
GraphHistogram methods
- GraphHistogram.renderSubplot(subplot)
Calls the subclass specific information to get the data
Methods inherited from Graph:
Methods inherited from ProtoM21Object:
GraphHistogram instance variables
- GraphHistogram.binWidth
Size of each bin; if the bins are equally spaced at intervals of 1, then 0.8 is a good default to allow a little space. 1.0 will give no space.
GraphHorizontalBar
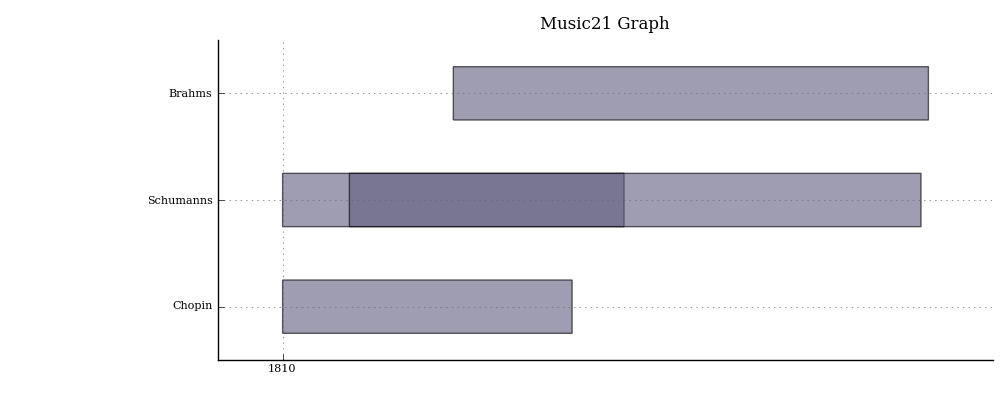
- class music21.graph.primitives.GraphHorizontalBar(**keywords)
Numerous horizontal bars in discrete channels, where bars can be incomplete and/or overlap.
Data provided is a list of pairs, where the first value becomes the key, the second value is a list of x-start, x-length values.
Note how the second element in each data point is the length, so subtracting death year from birth year gives the appropriate length.
Example: Plot the life-span of four composers whose lives were entertwined: Chopin, Robert and Clara Schumann, and Brahms.
>>> a = graph.primitives.GraphHorizontalBar()
>>> data = [('Chopin', [(1810, 1849-1810)]),
...         ('Schumanns', [(1810, 1856-1810), (1819, 1896-1819)]),
...         ('Brahms', [(1833, 1897-1833)])]
>>> a.data = data
>>> a.process()
Data is a list of tuples in the form, where each entry represents a space on the Y axis:
Label
- List of tuples of numeric data where each tuple has two or three elements:
Start x-position
Length of bar
Optional: dictionary of format information about this point.
Optional: dictionary of format informmation for all points at this level. (this will be overridden by any information for the particular point)
To make an equally spaced plot, like in a Pitch Space plot, leave empty data in the form:
(‘’, [], {})
GraphHorizontalBar bases
GraphHorizontalBar read-only properties
- GraphHorizontalBar.barHeight
Read-only properties inherited from ProtoM21Object:
GraphHorizontalBar read/write properties
Read/write properties inherited from Graph:
GraphHorizontalBar methods
- GraphHorizontalBar.renderSubplot(subplot) None
Calls the subclass specific information to get the data
Methods inherited from Graph:
Methods inherited from ProtoM21Object:
GraphHorizontalBar instance variables
- GraphHorizontalBar.barSpace
Amount of vertical space each bar takes; default 8
- GraphHorizontalBar.margin
Vertical space above and below the bars, default 2 (= total4 space between bars)
GraphHorizontalBarWeighted
- class music21.graph.primitives.GraphHorizontalBarWeighted(**keywords)
Numerous horizontal bars in discrete channels, where bars can be incomplete and/or overlap, and can have different heights and colors within their respective channel.
GraphHorizontalBarWeighted bases
GraphHorizontalBarWeighted read-only properties
- GraphHorizontalBarWeighted.barHeight
Read-only properties inherited from ProtoM21Object:
GraphHorizontalBarWeighted read/write properties
Read/write properties inherited from Graph:
GraphHorizontalBarWeighted methods
- GraphHorizontalBarWeighted.renderSubplot(subplot)
Calls the subclass specific information to get the data
Methods inherited from Graph:
Methods inherited from ProtoM21Object:
GraphHorizontalBarWeighted instance variables
- GraphHorizontalBarWeighted.barSpace
Amount of vertical space each bar takes; default 8
- GraphHorizontalBarWeighted.margin
Space around the bars, default 2
GraphNetworkxGraph
- class music21.graph.primitives.GraphNetworkxGraph(**keywords)
Grid a networkx graph – which is a graph of nodes and edges. Requires the optional networkx module.
GraphNetworkxGraph bases
GraphNetworkxGraph read-only properties
Read-only properties inherited from ProtoM21Object:
GraphNetworkxGraph read/write properties
Read/write properties inherited from Graph:
GraphNetworkxGraph methods
- GraphNetworkxGraph.renderSubplot(subplot)
Calls the subclass specific information to get the data
Methods inherited from Graph:
Methods inherited from ProtoM21Object:
GraphNetworkxGraph instance variables
- GraphNetworkxGraph.hideLeftBottomSpines
bool to hide the left and bottom axis spines; default True
- GraphNetworkxGraph.networkxGraph
An instance of a networkx graph object.
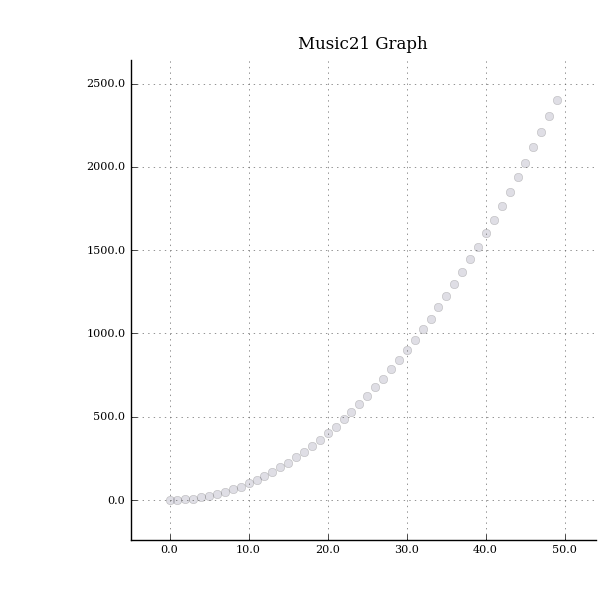
GraphScatter
- class music21.graph.primitives.GraphScatter(**keywords)
Graph two parameters in a scatter plot. Data representation is a list of points of values.
>>> g = graph.primitives.GraphScatter()
>>> data = [(x, x * x) for x in range(50)]
>>> g.data = data
>>> g.process()
GraphScatter bases
GraphScatter read-only properties
Read-only properties inherited from ProtoM21Object:
GraphScatter read/write properties
Read/write properties inherited from Graph:
GraphScatter methods
- GraphScatter.renderSubplot(subplot)
Calls the subclass specific information to get the data
Methods inherited from Graph:
Methods inherited from ProtoM21Object:
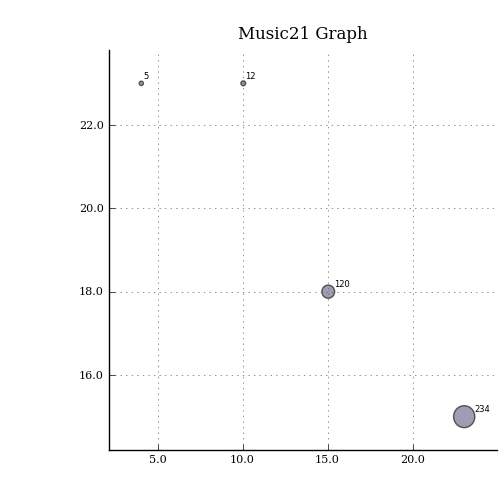
GraphScatterWeighted
- class music21.graph.primitives.GraphScatterWeighted(**keywords)
A scatter plot where points are scaled in size to represent the number of values stored within.
>>> g = graph.primitives.GraphScatterWeighted()
>>> data = [(23, 15, 234), (10, 23, 12), (4, 23, 5), (15, 18, 120)]
>>> g.data = data
>>> g.process()
GraphScatterWeighted bases
GraphScatterWeighted read-only properties
- GraphScatterWeighted.rangeDiameter
Read-only properties inherited from ProtoM21Object:
GraphScatterWeighted read/write properties
Read/write properties inherited from Graph:
GraphScatterWeighted methods
- GraphScatterWeighted.renderSubplot(subplot)
Calls the subclass specific information to get the data
Methods inherited from Graph:
Methods inherited from ProtoM21Object:
GraphScatterWeighted instance variables
- GraphScatterWeighted.maxDiameter
the maximum diameter of any ellipse, default 1.25
- GraphScatterWeighted.minDiameter
the minimum diameter of any ellipse, default 0.25