Project 2: Biochemical Models of Local Ecosystems
A hierarchy of biochemical models have been developed for the Black Sea ecosystem and coupled to the general circulation model forming the upper layer circulation pattern of the previous Fig. 6.
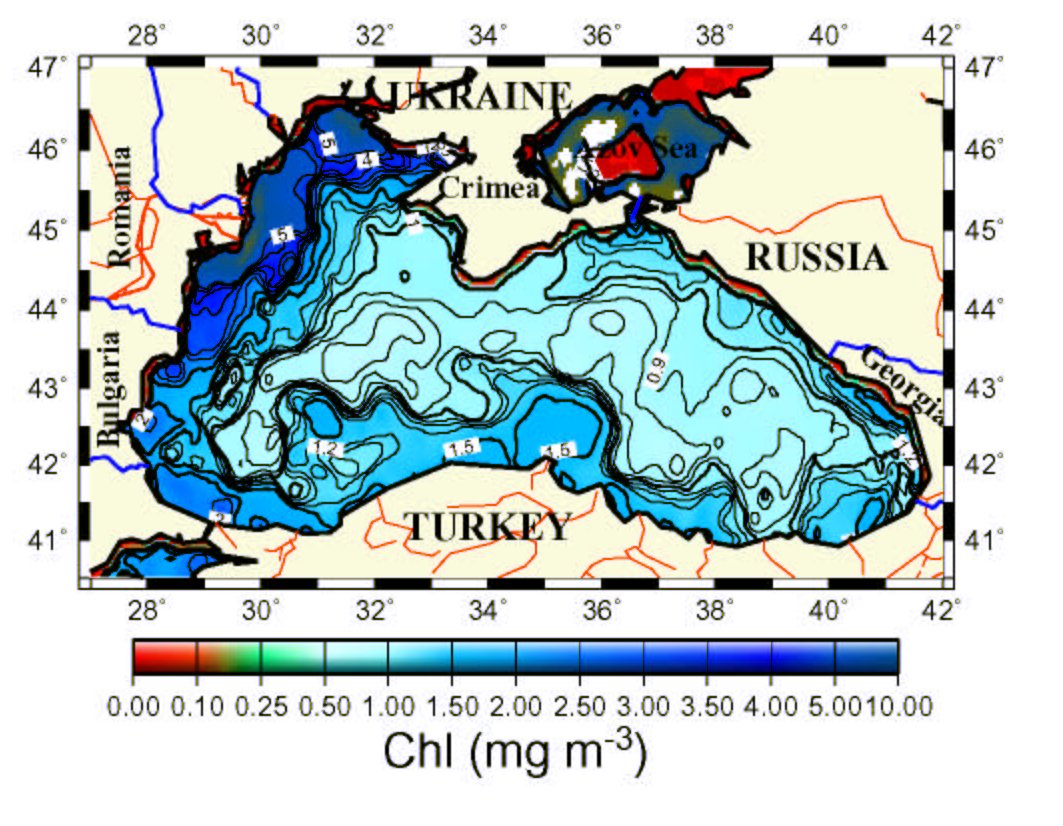
Fig. 8 Monthly composite SeaWIFS image of the surface chlorophyll concentration (in mg m-3) for August 1999.
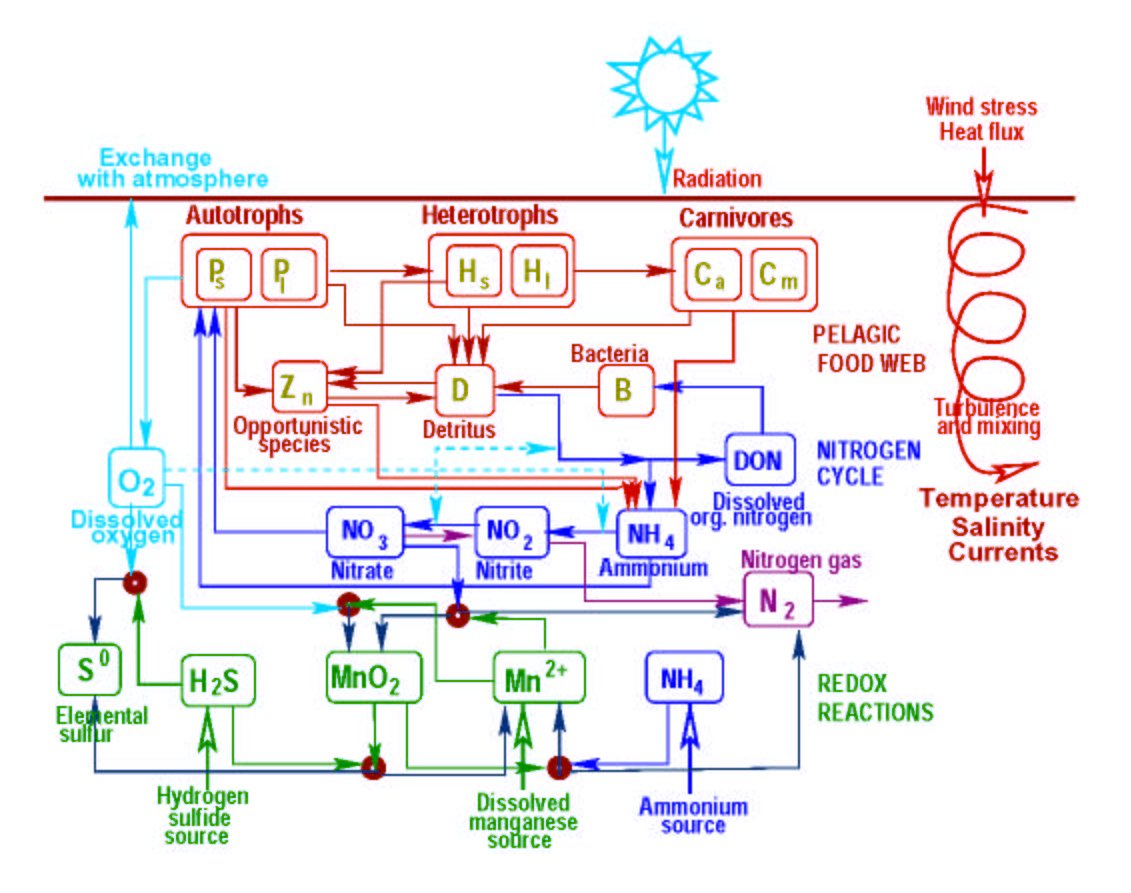
Fig. 9 Ecosystem model: Schematic representation of the major processes and interactions between biogeochemical model compartments, P1 Ps denote large and small phytoplankton groups, Hs is microzooplankton, Hl is mesozooplankton, Ca is jellyfish Aurelia aurita, Cm is ctenephore Mnemiopsis leidyi, Zn is opportunistic dinoflagellate Noctiluca scintillans, MnO2 is particulate manganese. Meaning of the other variables are as shown in the figure. The biogeochemical model is coupled to the physical model through vertical diffusivity and temperature.