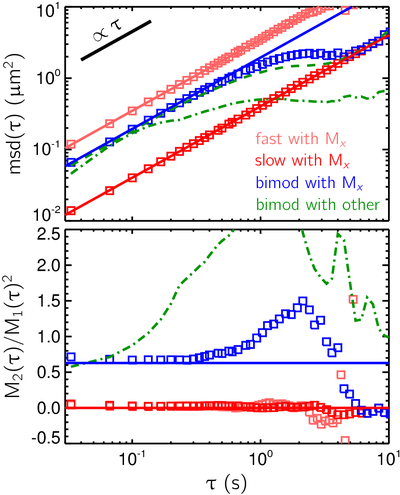
The ensemble
mean of msd (top plot) and the ensemble scaled variance of msd (bottom
plot) of trajectories in the bimodal fluid. The squares are obtained
using estimators M1 for the mean and M2/M12 for
the scaled variance for the separate fluids (red) and the bimodal fluids
(blue). The green curves are obtained using other estimators (see main
text).
 close
close