The same plot of land that was once a blacksmith shop became a storage shed, became a part of a railroad, then became a part of I-93, one of the main highways through Boston. Once a plot of land largely defined by the surrounding railroads, Chinatown has served many uses until becoming a cultural center for the Chinese population in the Boston area as it is known today. As time passes and cities develop, a plethora of different social, cultural, political, economic, or even individual forces cause change. Some changes are individualistically attributed, and others are part of a larger trend on a global scale. Because of this, we can approach the process from the other end--analyzing the trends and anomalies of change in a site and hypothesizing their origins to larger forces acting on the city and the country as a whole. As shown in figure 1, the site I analyzed lies on the eastern border of present-day Chinatown. As we watch my particular site change over time, there are three main forces that push the direction of development; it tells the stories of immigration, the evolution of transportation, and the urban renewal movement. Together, these stories explain some of the major changes that have occurred in my section of Chinatown.
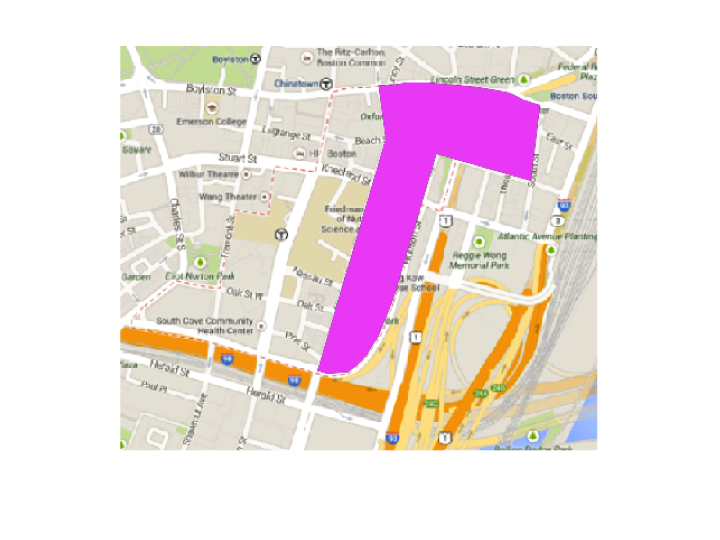 Figure 1: My site, highlighted in pink. Red dashed line depicts what Google defines as the boundary of Boston’s Chinatown. [Google Maps, Edited by Author]
Immigration
As my site is located in the area of Downtown Boston known as Chinatown, the immediate question for my site is how the Chinese moved into the area and how they made it their own. How did they establish an area once inhabited by another group as Chinatown?
Referencing trends in the country, in the early 1900’s, America’s large cities, including Boston, were home to two-thirds of all immigrants (Jackson 1985, 70). Chinatown, as the name implies, was home to Boston’s Chinese population, and is located right in Downtown Boston. The first traces of a Chinese population can be seen in the 1885 Sanborn map of my site. Although there are no Chinese landowners to be found in the site until later on, there are several Chinese laundries that have been specifically marked, all towards the north, in the more commercial area of Chinatown. Looking closer at the 1885 Sanborn map, there are five Chinese laundries within the site border and several more on the surrounding streets. However, these Chinese laundry shops are the only traces of Chinese in the area at this point in time. There are no signs of Chinese landowners in my site until 40 years later. This leads me to guess that the Chinese in the area were renting spaces in the late 1800’s as opposed to purchasing their own land, but are a significant presence in the area.
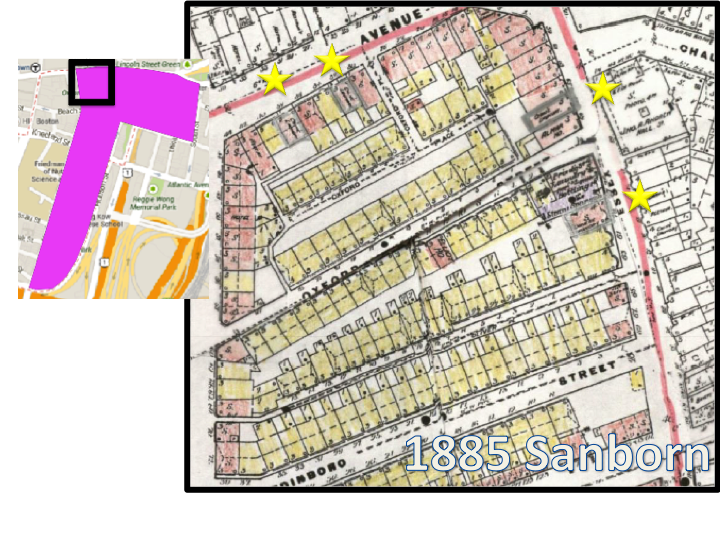 Figure 2: The picture above is a part of the 1885 Sanborn map, color coded by land-use. On this map, the pink line represents the border to my site, and Chinese laundries have been outlined in silver and then marked by yellow stars. Although there are no other indicators of a Chinese presence in the area, high density of these laundry shops indicates the existence of a Chinese population and that they must have been renting these spaces from other ethnic groups who had been in the area earlier. (By international color convention, red=commercial buildings, yellow=single family residential buildings, orange=multi-dwelling residential buildings, purple=industry, and blue=institutional buildings.) [Map of Chinatown 1885. Sanborn Fire Insurance Map, 1885.; Edited by Author ]
As more time passes, we can see the Chinese planting their roots in the site. Comparing the 1902 and 1929 Bromley maps, we see an increase in Chinese landowners. Where there is only one Chinese landowner in my entire site in 1902, there are several by 1929. However, these Chinese-owned establishments are mostly in the north, the commercial parts of the block. Perhaps this reflects an importance placed on business as opposed to residential life in the Chinese community as they worked to buy their shops before their homes or they were living in the spaces above their shops.
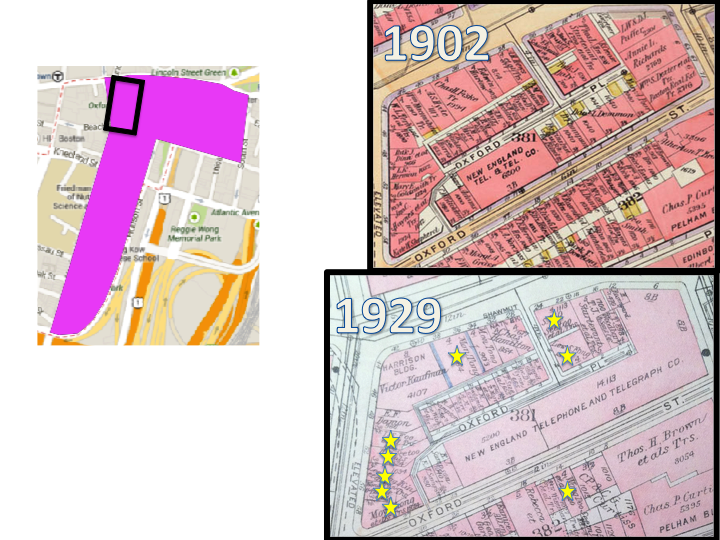 The two pictures on the left depict the same block in my site in 1902 and 1929. The stars mark landowners with Chinese last names. There are no Chinese owners at this point in time although there are definitely traces of Chinese in the area (refer to 1885 Sanborn map in figure 2). [Map showing central area of Chinatown, from Atlas of the City of Boston, Boston Proper and Back Bay, from Actual Surveys and Official Plans (Cambridge: G.W. Bromley & Co. 1902, 1929), http://dome.mit.edu/handle/1721.3/47999; Edited by Author]
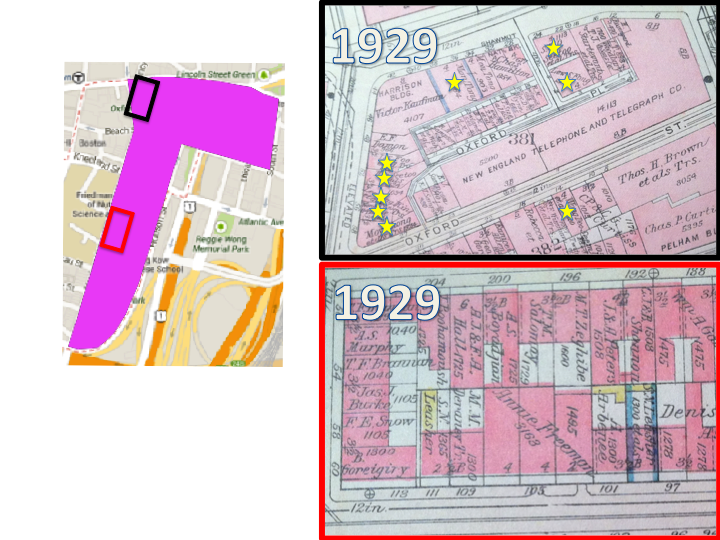 Figure 4: First traces of Chinese land owners (marked by yellow stars) on my site are found in 1929. Chinese are beginning to establish themselves although they have been living on the land for a long time. These two snapshots of blocks on the 1929 Bromley Map show that the first landowners all exist on the north end of the site. In fact, south of Beach St., there is only one Chinese landowner on the map. You can see from the 1929 Bromley that the landowners in this block are a range of ethnicities as there are surnames such as Freeman, Murphy, and even Bouhamoush. [Map showing central area of Chinatown, from Atlas of the City of Boston, Boston Proper and Back Bay, from Actual Surveys and Official Plans (Cambridge: G.W. Bromley & Co. 1929), http://dome.mit.edu/handle/1721.3/47999; Edited by Author]
Fast forward two more decades, to the 1951 Sanborn map, these Chinese laundry shops no longer exist. Instead, the Chinese presence in the area is depicted through Chinese restaurants and other institutional organizations such as a Chinese Masonic temple, a Chinese Y.M.C.A, and several Chinese stores and restaurants. A transition from laundry shops to restaurants and the increase in institutional organizations hints at an elevation in economic standing in this area. In addition, although there are still some tenements in the area, there is an overall increase in size of shop fronts and residential buildings, which continue to support the theory that land in my site has become more valuable. This could be a result of time, the Chinese having stayed in the area long enough to develop and truly establish themselves, or a result of more drastic changes caused by uirban renewal and transportation.
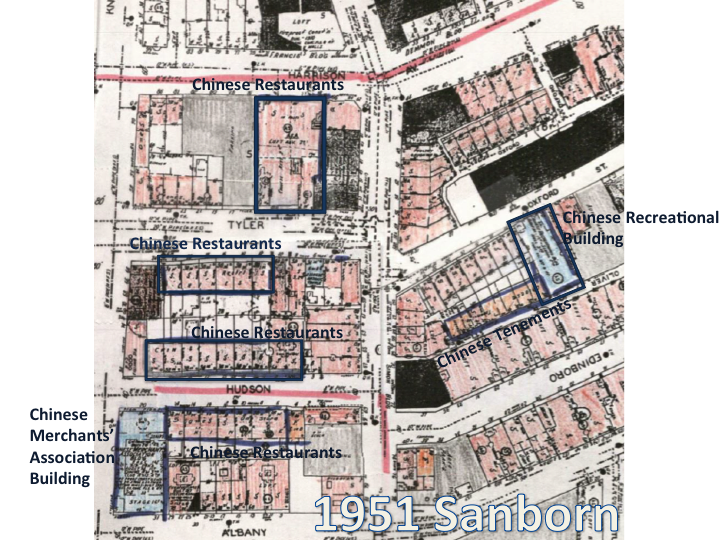 The figure above is a portion of the 1951 Sanborn map, colored by land-use. The blue outlined buildings depict all areas explicitly noted as Chinese establishments and have been identified as such. [Map of Chinatown 1951. Sanborn Fire Insurance Map, 1951.; Edited by Author]
Transition in Transportation
When comparing maps from the present day to those in the 1800’s, the biggest change in my site would be the construction of the I-93 Expressway. In fact, I-93 is the eastern border of present-day Chinatown, not only is it significant to the story of transportation in the site, but it has also had a large impact on the boundaries of the cultural district known as Chinatown. The highway actually plows through a significant portion of land that was once commercial and industrial buildings. And so, it brings me to ask--why was this particular area chosen for the Expressway?
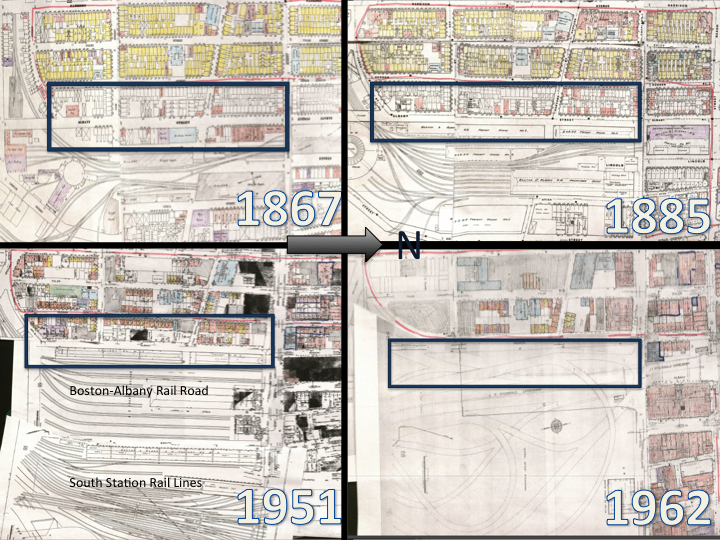 Figure 6: Here are four Sanborn maps from 1867-1962 of my site, colored by land-use. Note: (1) On each of these maps, the same region has been boxed in blue to highlight the change in those blocks. As you can see, in 1867, much of the lower half of the block had been used for industry and trades (blacksmithing, carpentry, machine shops, etc.). By 1885, those buildings were replaced by large freight depots which were then completely taken out, along with the rest of the rest of the Boston-Albany Railroad. (2) The railroad itself started off as a few rails but expanded as trains grew as the main mode of transportation all the way until the rails were completely taken out and replaced by the Expressway. You can see the number of parking garages now in the site to accommodate for the influx of automobiles in the city, brought by the highway. (3) From the 1951 map to the 1962 map, you can see the general trend of an increase in size of buildings--plots of land have been combined into bigger lots. (4) Tufts Medical School has also began to encroach on the site in 1962. [Map of Chinatown 1867, 1885, 1951, 1962. Sanborn Fire Insurance Map, 1867, 1885, 1951, 1962.; Edited by Author ]
From the three earlier maps, you can see that there were once railroad tracks that the Expressway replaced. Comparing the 1867 map to the 1885 map, you can see that the railroad actually expanded, engulfing the nearby storage depots, reflecting the rail as the main form of transportation in that time period and a demand for more rail lines. In fact, the rails grew so much that even the St. James Church in the 1867 version of the map disappeared to make way for more freight depots in the 1885 map. However, by 1962 map, the railroads are completely gone and were replaced by highways. As the introduction and popularization of the automobile occurred in the early and mid 1900’s, the railroads probably saw less traffic. Trains slowly became an antiquated form of transportation as people transitioned to cars. In addition, as you can see from the 1951 map, the South Station tracks are directly east of the Boston-Albany tracks. This leads me to hypothesize that the rail system was not replaced completely by the automobile but that the Boston-Albany tracks and the South Station tracks were consolidated to just South Station, which is still in existence today. This allowed the land that the Boston-Albany tracks were occupying to be transformed into a more modern mode of transportation--highways.
Not only did new technology change the type of transportation in the area, it made many of the trades seen on the 1867 map, such as carpentry and blacksmithing, obsolete. While the railroad was surrounded by such trades at the beginning, they did not remain so for long and were replaced by storage depots or more rail lines. Thus, new technology also opened up land opportunities for other industries or expansion to move into the area. Again, as the rail lines themselves started becoming antiquated, they opened up the opportunity for the Expressway to move in. The amount of land made available by the Boston-Albany track, especially in a dense city like Boston, I imagine, was a large factor in the placement of the new highway.
In addition, the area surrounding the Boston-Albany tracks were most likely easy areas to swallow into the highway. As a general trend, the maps shown in figure 6 become more and more dense which may have been attributed to the growing rail lines which brought more business to the area. However, the resident housing by the rail line probably was not very desirable because it was not only surrounded by dense commercial areas, but also by the rail lines which would bring noise, grime, and overall uncleanliness. In addition, the leather district began to set up camp east of my site with several leather factories, first seen in 1951. To house all the workers who lived close to their jobs in the leather factories and the rail lines, tenement housing can be seen both on my site and surrounding my site, close to those trades. These areas were probably relatively easier plots of land for the government to buy and transform into the new highway because of their low desirability.
The addition of the Fitzgerald Kennedy Expressway may have been the physical manifestation of the Interstate Highway Act of 1945 which provided for 41,000 miles of highways (Jackson 1985, 249). In addition, there were many Housing Acts passed in the 1930’s and 1940’s to reduce slums in the major cities (219). These acts might have been the push from legislation that Boston needed to take in land for highway construction and Chinatown was a prime location.
Urban Renewal and Gentrification
The transformation of transportation is a large part of the urban renewal movement in the United States, so, this segment of my site’s story is largely intertwined with, and is an extension of the previous transportation segment. Urban Renewal brought about the construction of much infrastructure in cities and overall gentrification. Moreover, the addition of a highway increased the land value of the area and renovations made the area much more desirable than before, naturally attracting more people to come live in the city.
The urban renewal effort was an effort to replace run-down housing with public housing projects, highways, and other government projects using eminent domain. Although Chinatown did not experience massive demolition as other areas of Boston did, such as the West End, the addition of the Expressway was a part of Boston’s efforts in urban renewal. According to Jackson (1985), highways were seen as “social and economic therapy” because they decreased the cost of working downtown for commuters from the suburbs (164). To pay for the costs of these new roadways, property-tax increased along the highways which then increased the economic standing of these areas (164). This can be seen in the addition of the Expressway right outside my site which brought about some drastic changes. Entire blocks were renovated and turned into parking lots as institutions such as the New England Medical Center and Tufts Medical School quickly moved into the surrounding area. Because they were able to amass such large plots of land from many small landowners so quickly, this suggests that the government was involved in the process. It is possible that the government forced all of the landowners to give up their land, consolidated that land, and sold it to these large institutions. Although this was not as drastic a change as having entire neighborhoods demolished, the opportunity for institutions to move into the location was facilitated by the urban renewal movement and lead to gentrification.
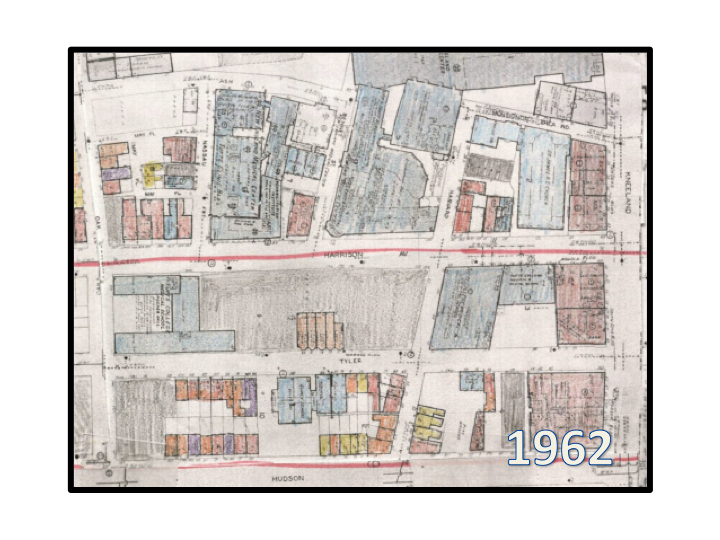 Figure 7: The figure above is a portion of the 1962 Sanborn Map of my site, outlined in pink. Although this map shows more than my site, you can see the number of large institutions (colored in blue) in the area and the large plots of land they have managed to acquire. Not only do they have land for their buildings, they also have land for large parking lots. The number of parking lots in the area also reflects the use of cars in this time period. [Map of Chinatown 1962. Sanborn Fire Insurance Map, 1962.; Edited by Author ]
One of the goals of urban renewal was to build cheap public housing in the city in place if demolished slums and other undesirable living spaces (Jackson, 1985). When most of the drastic changes in my site first occurred, there were no housing projects put up but instead, the empty lots were turned into parking spaces. Later on, first seen in the 1981 map, Tai Tung Village, a large apartment complex on the southern tip of my site, was built. This large apartment complex, which is still standing today, is several stories taller than its neighboring buildings and is completely made of concrete, much different from its red brick surroundings, and takes the place of transitory parking lots and empty space. Between 1967 and 1981, not only was Tai Tung Village constructed, but also the first green space in my site. There is a playground on the east side of Tyler St., which may be a sign of attempts of gentrifying the neighborhood and making the site a more desirable and enjoyable place to live. Although the construction of Tai Tung Village did not immediately follow the institutional expansion, the area did not change ownership in between. Perhaps the government decided to reiterate the ideas of urban renewal and use the land they could not sell to institutions for public housing development.
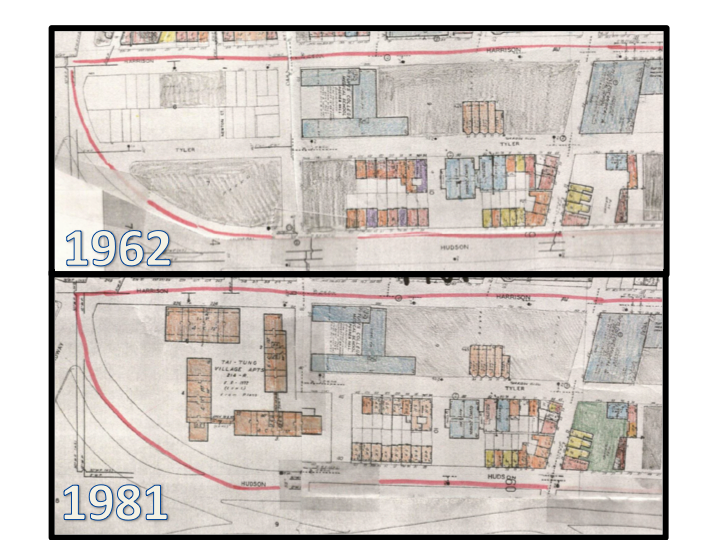 Figure 8: The figure above is composed of two Sanborn maps from 1962 and 1981 colored according to land-use. Notice the addition of the Tai Tung Village Apartments from lots that used to be empty space and Parking lots as well as the addition of the first playground or park in the site. [Map of Chinatown 1962, 1981. Sanborn Fire Insurance Map, 1962, 1981.; Edited by Author ]
Conclusion
Looking at these maps from 1867 through 1962, although examining only one small section of Boston, we can see several forces at work: change in demographic, a transition in transportation, and urban renewal. Each of these separate stories, when taken individually, reflects what these forces are capable of in an urban environment. We have watched how a site largely dependent on railroads changed to accommodate the automobile, how urban renewal can pave the way for institutional expansion, how a cultural group slowly gains influence in an area and fights to make a footprint. An analysis of maps can show that, although it is often thought of as just a tourist attraction or a cultural center today, Chinatown has played several different roles. Whether the site was commercial, residential or empty lots at a certain time, the one role my site has continued to play is that of a canvas. Tracking my site through time has allowed us to see the changes that have occurred with time and the forces behind them.
Bibliography:
Jackson, Kenneth T. 1985. Crabgrass Frontier: The Suburbanization of the United States. New York: Oxford University Press.