A proper analysis of the ever changing city landscape would be remarkably incomplete without a deep analysis of the city’s changing character over time. Following a study of the natural processes at work within my site, I will now trace the major changes of my site, a process facilitated by the use of maps from different periods of history. By reading into these maps, the goal will be not only to discover and unveil the changes that have taken place physically within my site, but also to offer an explanation for their change and to fit them into a larger pattern of evolution in these seven blocks of East Cambridge. I will analyze the time span of 1873-1988, including the present day in order to explain the change. These maps will ultimately reveal that the forces of change in my site include transportation, land ownership, historical forces, and the interesting role of land usage that was not expected upon first analysis of the site. Ideas from Kenneth Jackson’s Crabgrass Frontier will also be used to connect the site to a larger image of the changing urban and suburban landscapes in America. The outcome of this analysis will reveal that historical developments often have lasting effects on the living, breathing, and unpredictable organism of the city, and that this site has been strongly influenced by changes of pace in development which has led to its diversity even today.
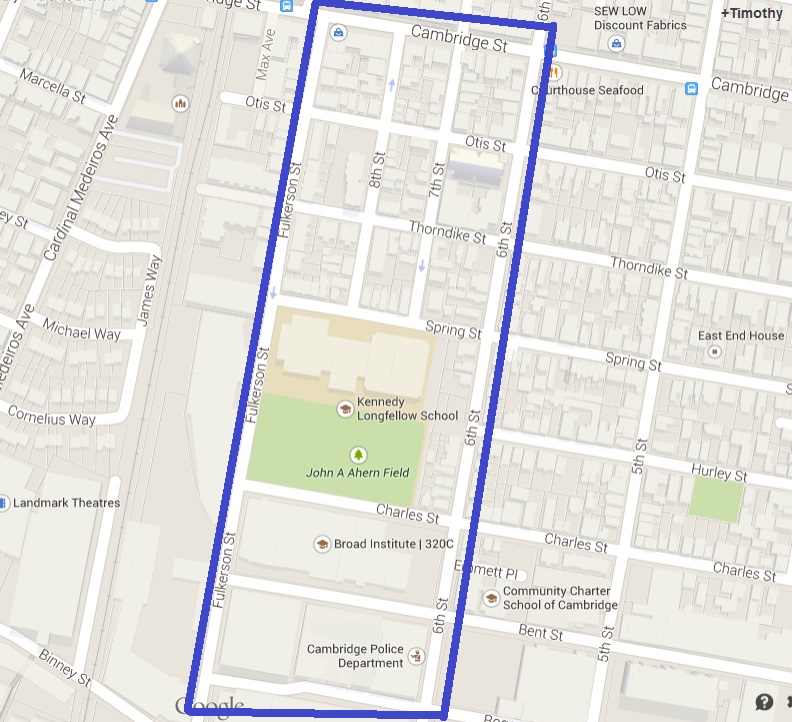 Figure 1- A modern day Google Maps view of the site is the easiest way to see the resultant final structure of the site, so that its changes over time can be referenced to the present day
The first time of analysis for my site will take place in 1873. Two maps from this time have been selected, and each distinctly reveals that my site was impacted significantly by physical factors as well as by land ownership. Figure 1 above shows a modern day map of my site, with the boundaries labeled in blue. All of the future maps will have the general site labeled in blue. This figure will be crucial in drawing connections between the modern day view that we have of my site and the forces that impacted it almost 150 years ago. Figure 2 depicts the northern half of my site from an 1873 Hopkins map, included below. Figure 2a is a close up view of one of the important features of this site to be discussed.
The most glaring evidence on this map relates to the density of settlement not only in my site but throughout this section of what becomes East Cambridge. Settlement into the area was funneled from Boston across what is today the Charles River Dam, which is pictured just outside of the top right of Figure 2. It is obvious from this map (and will be even clearer once paired with Figure 3) that settlement moved west and southwest from this landing point. This map from 1873 was chosen because it lays my site in a period where it has begun to be settled but where the area of my site remains partially open and partially settled, in a transition state. The moving development forms an “arrowhead” like shape that is positioned just on top of my site in 1873. The established parts of the city are already dense and diverse, while there is a fine line that separates this with the open space of my plot. Comparing figures 1 and 2a, the most evident difference between 1873 and the present on this small part of the plot is the absence of the Sacred Heart Church at the intersections of 7th, 6th, Otis, and Thorndike Streets. In Figure 2a we see evidence of this church’s destiny in the buildings on that site, specifically their owners. On figure 2a, three pairs of buildings are labeled with arrows in order to indicate that they were owned by the same individual. These three owners were Patrick Pafferty, Silas and John Buck, and Peter and J. Nelson. One person from each of these three groups owns land both in the site of the present day church and in the immediately surrounding area. Some, such as Silas and John Buck, had expansive plots of land that spanned much of 1873 East Cambridge, though these maps have been excluded for convenience. This pattern of land ownership suggests that the site was chosen for the church because the owners there had plenty of other surrounding land, because they all shared this similar interest, or because they were investors that bought an excess of land in the area in order to build on it later. Regardless, this trend is not found on any other part of this site at this time, making it easier for a church to perform the problematic move to a block that was residential previously. No one owner had enough land in this area to build a large building like a church, and thus it came down to the most negotiable scenario for the site of the building. In addition we can see the trend of land purchase at this point in time with the ownership of Saunders on the left hand part of the figure 2 (indicated in red). These plots roughly outline the shape of the western arrowhead that was travelling across Cambridge, and this “arrowhead” shape determines much of the makeup of the future city (arrowhead shown in orange). We see this exact pattern again in Figure 3, a different Plate of the same 1873 map from figure 2.
The part of the map to the top left circled in red shows property owned by Ringe and Green, which spans a similar right angle shape to the land that we saw previously in figure 2. This part of the “frontier” was especially important in that it takes up most of the space that eventually becomes the Thorndike Public School that will be seen. As a sort of corollary to the church scenario previously, the singular ownership of this plot likely played a role in its destiny for becoming the site of a public school building. The fact that this plot was singularly owned and shaped similarly to the Saunders land from before was influenced heavily by the pattern of movement and development into this part of Cambridge. New plots of land were purchased and wrapped around the tip of this “arrowhead” that has been formulated, and they stayed so wrapped and close because of the density of settlement. This land was not settled sparsely and later populated, but it moved into the free space with the density that it would always maintain, a characteristic that had an impact on how and where major parts of my site developed. In addition, it is important to note that the southern part of my plot had not been developed at this point, and that one of the streets, Binney Street, was originally supposed to follow a grid structure, but it eventually became curved as see in figure 1. This change squeezed the southern part of my plot more closely to the main road by cutting off a small block, and had an effect on how this area developed, as will be seen in further maps. Overall, this time period sets up the development of the site with land ownership and the pattern of settlement and its associated density, laying the subtle track for how the site exists even today.
The next time segment is 1900, where the turn of the century will show the lack of major change over the 27 year span from 1873 and how it set the stage for the future of the site. Figure 4 is shown below in comparison to figure 2.
From this map we can see little major change occurring between the times, except for the sprouting of the first main building of the Sacred Heart Church. Additionally the Saunders owned land was developed, following the pattern of westerly change behind the arrowhead described earlier. The southern part of the plot is depicted in figure 5 below.
The main remnants of the 1873 map are found near the top of the image where the diagonal line cuts through a plot of open space. This rectangular line comes from the previous map where a system of rectangular plots placed at an angle were being taken over by the vertical rectangles that had developed by 1873, yet this part remained, and will become important in the next set of maps for the plot. In further comparison to figure 3 some development has taken place on the border of Sixth Street and at the intersection of ninth and Spring Street, but other than this the plot remains empty with random and unmarked property lines. The movement of the arrowhead has been remarkably slow during this 27 year span, leaving only a small penetration into the plot and a weak foothold for any residences in figure 5. This mysterious glitch in settlement is also taking place during a time of industrial expansion, which will manifest itself in the following maps. The buildings that have been built differ from what is found elsewhere in the site at the time. Small factories or shops selling consumer goods have made the penetration, and likely serve the adjacent neighborhoods to the east. Although there are not many buildings there to begin with, the fact that they are distinctively non-residential swings the momentum for these blocks to have a future in industry. Looking at the rest of the site in figures 2, 3 and 4, we see density of settlement and few open spaces. Realistically, it is difficult to build fields, schools, and factories on plots of residential land. Even the blocks between fifth and sixth streets show stark differences in figures 3 and 5, yet by 1900 there has been little expansion west past sixth street. Due to the slow timing of expansion here, regardless of its cause, these plots are destined for a different composition over the coming years, which will be demonstrated by the following time periods.
The next time span (1900-1934) will be used to capture the important changes that took place on one of the most important blocks of my site containing the Sacred Heart Church, as well as its surrounding changes. Figure 6 below is the 1934 Sanborn map of the northern part of my site.
For the majority of this image there are only minor changes taking place. Indicated on the map is a large section of one of the blocks that has become a storage warehouse and active business for horses and wagons acting as liveries in the area, as well as the sugar refinery that took over part of the area and the school that was built. This school was built into the strange boundary discussed from figure 5, which allowed for the expansion of the sugar refinery buildings past Ninth Street. Zooming in on the area bordered by Otis, 6th, 7th and Thorndike Streets (boxed in light blue) we see the vast changes to the Sacred Heart Church over the past 34 years. The church has added a convent, parochial school, homeless shelter, large rectory, and two parallel balconies since figure 4 in 1900. This expansion and the purchase of the large plot seen in 1900 relates to the observation of landowners from 1873 in figure 2. Included also to give insight into the time period between 1900 and 1934 is two photos taken of the church today that illustrate the nature of some of these changes. Figures 7 and 8 are included below.
The variety of building materials and discontinuities in the construction suggest a piecewise yet rapid expansion of the building during this period of time, leading to the entire block being filled with the activities of the church when roughly 50 years ago it was filled with flats and dwellings. Strangely enough just after the production of the first automobiles, the block directly to the west of the church became a livery stable for transportation, shaping the notion that this area was becoming a type of self-serving residential area with the convenience of the city. In a chapter entitled “The Transportation Revolution and the Erosion of the Walking City” Ken Jackson states that the village of Cambridge “developed three important suburban characteristics between 1800 and 1850: a set of clear municipal priorities, a preference for residential over commercial expansion, and a stubbornness to remain politically independent” (Jackson 21). The fact that the neighborhood was densely settled since its early conception explains why the red and purple commercial areas have been pushed towards the edges of Cambridge Street to the north, and this is also explained by Jackson’s point that new suburbs wanted to identify as residential area separate from cities. The apparent changes to the plot by 1934 reveal that the site’s history as a neighborhood has played a role in keeping commerce and industry mostly removed from the site, while fostering and protecting the transportation and institutions that feed a neighborhood.
The change that occurred from 1934 to 1970 and subsequently from 1970 to 1988 illustrates that the centrality of changes in my site are in the main public buildings and institutions. The first two figures will display the change in the northern part of the plot. Figures 9 and 10, below, show the northern part of the plot in 1970 and 1988 respectively.
The first major change that is seen in figure 9 is that the Thorndike Public School has been completely removed, though the property lines have remained. The Sacred Heart church has remained largely unchanged though it has rounded out its borders and expanded slightly, but the plot that previously held the horse livery and stables has been removed and replaced by a large apartment building. Kenneth Jackson posits that in order to look at the “underlying causes” for social forces in the city “we must look not just to transportation technology and the powerful mechanical forces unleashed by the Industrial Revolution but to the development of new cultural values” (Jackson, 44). This quote begins to encapsulate the general idea of what is occurring within the northern part of my site. With the fast paced settlement of the late 1800s and early 1900s we see a reflection of Jackson’s statement where residential construction is the focus. After this however we see the pouncing industrial development that took over parts where this cultural foothold had not set in. In this way we see the importance of timing in the development of my site, and more importantly we see the two different sides of the city suburb emerging with an industrial half and a residential half. Jackson’s statement helps us to see that without proper timing natural forces would drive the suburb to be defined entirely by cultural forces. It is notable the lack of change in the other buildings in the site, with changes centering on the main buildings or plots used for centralized activity, such as the school and the livery. Some of the commerce on Cambridge Street has disappeared as well. Looking further at figure 10 from 18 years later we see vast changes again in one of these areas. The empty plot that used to hold the school has now been absorbed and the property lines have finally been restructured to fit the horizontal pattern of the neighborhood. The adjacent plot which held an industrial mill work building in 1970 has been absorbed as well for the building of the Robert E Kennedy School, which still stands today in that site. It is unknown the reasons for the first elementary school leaving the site to be followed by this one, though it is likely uninfluential. The important note however is the fact that the plot has been used for a similar land use since it was first founded, even when it was unoccupied for a period of time. This also applies to much of the rest of the site, with dwellings and flats showing little pattern of change over time. The southern part of the plot had a slightly different experience as will be shown in the following figures. The southern part of the plot has gone through a different set of changes mainly because its course of development did not start until the 1900s and the map in figure 5. Figures 11 and 12 (1970 and 1988) are included to outline the changes in this part of the plot that have had significant impact since that time.
The map in figure 11 demonstrates the end result of the most rapid period of change for this part of the site. The eastern dwellings and flats that were seen in figure 5 have been replaced by large factory and warehouse buildings that sprung up between 1934 and 1970. Between Bent and Charles Street is a beer factory and storage warehouse that took over an entire block, south of that is a block taken up by two factories producing steel and paper products, and finally in the last block is land owned by the same steel company, though only one shed is located there in 1970. These three blocks of the site seemed destined to become residential based on the figure 5 map. The recognizable entrance of residences into the plot along the arrowhead shape did not occur however, and instead the pause that took place in the early 1900s allowed for this plot’s industrial development. The availability of large plots of land made the site perfect for this, and as we have seen in the other parts of the site, this establishment of land use has been unshakeable over time. In figure 12 we see that in 1988 the map is nearly identical, with only the addition of a small building from the steel company to mark change. In figure 1 as well we see that in the present this plot is inhabited by industry, and though the industry has changed (due in part to the eventual creeping of MIT’s influence into my site leading to the establishment of the Broad Institute building) the plot has retained this land use. The pause in this plot’s development led to its diverse nature in a residential area, but it formed in a similar way via a persistent land use.
Analyzing this site’s changes over time deepens a broad understanding of its character as a neighborhood in Cambridge. This site was formed as part of a residential outpouring from Boston in the mid 1800’s, and is made up of two different halves. The northern half was founded with residential influence, and despite some efforts along its edges it has remained a residential and institutional center. The southern part of the site was paused in the early 1900’s in terms of development. This pause opened the door for an industrial age to utilize the area, and even today industry defines this plot. These two plots intersect at the John Ahern Field, the block that has seen the most uncertainty through time. The uncertainty that we find here in the plot exhibiting different combinations of land uses at different times also represents an uncertainty throughout the rest of the site. This plot was not greatly affected by transportation or ownership, but it was markedly affected by density of settlement and the timeline of land use. This site differs greatly from others around it because of its geographic position at the tip of expansion and the delicate way in which small changes led to deeper changes. In looking at this site today, the uncertainty of its founding has been forgotten and what remains is a remnant of the differences between two periods of time, generating a visual gradient that can be witnessed exhibiting what forces affect modern cities.
Works Cited:
Jackson, Kenneth T. Crabgrass Frontier. New York: Oxford UP, 1985. Print. Figures 2 and 2a :
"Sequence 21: Hopkins, Griffith Morgan." Atlas of the City of Cambridge. Harvard University Library, n.d. Web. 10 Apr. 2015.
Figure 3:
"Sequence 20: Hopkins, Griffith Morgan." Atlas of the City of Cambridge. Harvard University Library, n.d. Web. 10 Apr. 2015.
Figure 4:
"Cambridge 1900-1940." Sanborn Volume 1. Vol. 1. N.p.: Proquest Digital, n.d. 21. Web. 10 Apr. 2015.
Figure 5:
"Cambridge 1900-1940." Sanborn Volume 1. Vol. 1. N.p.: Proquest Digital, n.d. 26. Web. 10 Apr. 2015.
Figure 6:
"Cambridge 1900-1940." Sanborn Volume 1. Vol. 1. N.p.: Proquest Digital, n.d. 27. Web. 10 Apr. 2015.
Figures 7 and 8:
Taken by the author who reserves rights to them.
Figures 9 and 11:
"Sanborn Volume 1." Volume 1: Cambridge 1970. Vol. 1. N.p.: Sanborn Maps, n.d. 12-40. Print.
Figure 10 and 12:
"Sanborn Volume 1." Volume 1: Cambridge 1988. Vol. 1. N.p.: Sanborn Maps, n.d. 12-40. Print.
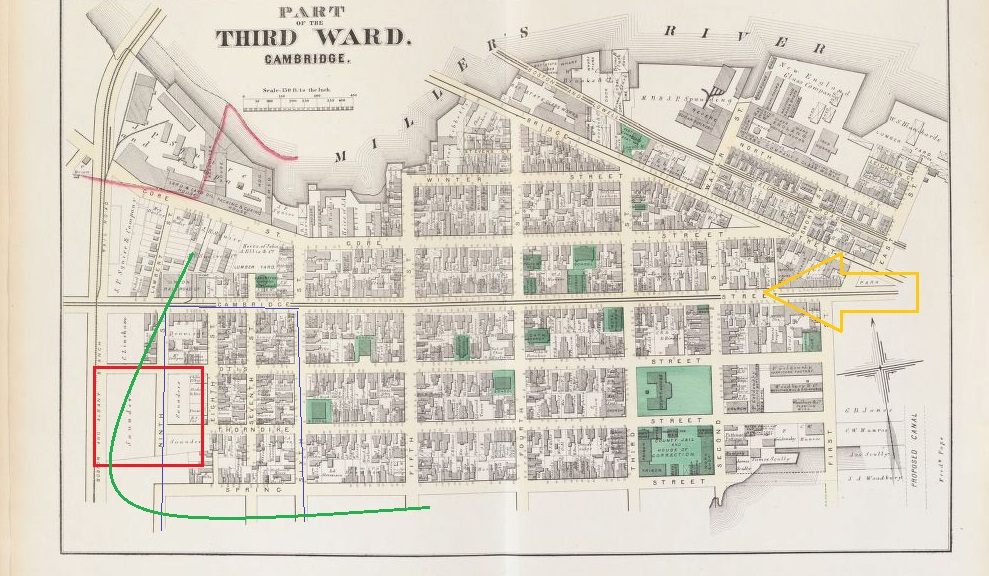 Figure 2- An 1873 Hopkins showing a broad view of my site and East Cambridge. The blue border delineates the location of my site, and the green line shows the general shape and concentration of moving development at the time, referred to as the “arrowhead” due to its shape. The red box shows the Saunders property which lies at the edge of this arrowhead, and it is one of many empty properties bought along this border which shaped the way that buildings were developed and how land was parceled. The orange arrow indicates the direction of settlement from Boston.
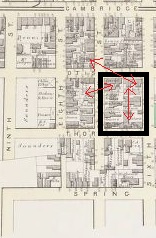 Figure 2a- This is a zoomed in version of figure 2 showing the eventual site of the Sacred Heart Church. The red arrows indicate places where buildings were owned by the same person in a minimum of two locations. This likely played a role in these individuals’ decisions to sell the land for the building of this church, and this pattern is not found as significantly anywhere else on the site
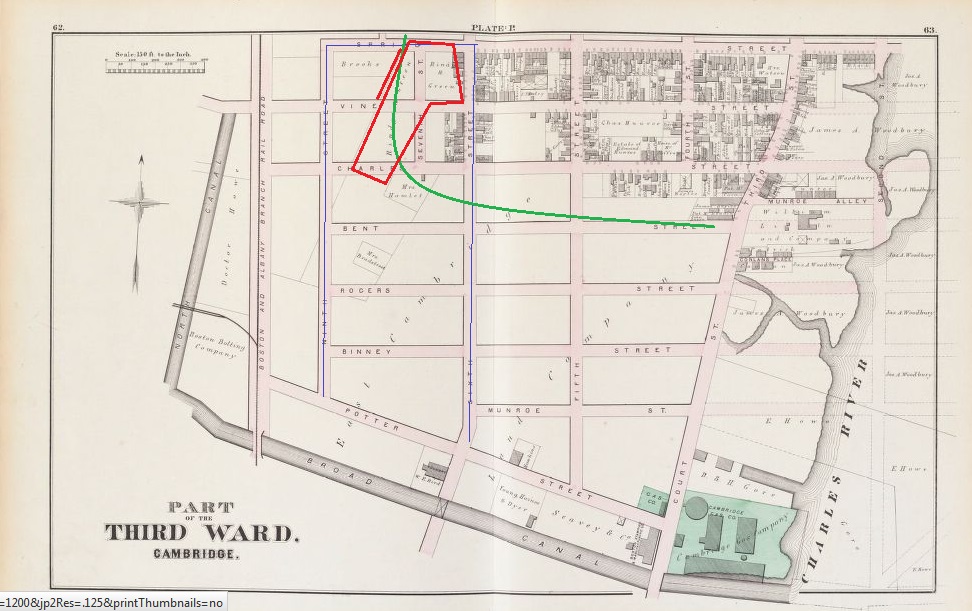 Figure 3- A different plate of the Hopkins 1873 map shows the southern end of the plot with the arrowhead shape indicated in green and the site boundaries again in blue. The red border shows another instance of land being purchased at the arrowhead frontier as in figure 2. This land owned by Ringe and Green was turned over many times and also had its boundaries reshaped during the construction of small industrial plots and two schools since 1873 as will be seen. The diagonal property line indicated by the double red line survived until the building of the present day school between 1970 and 1988
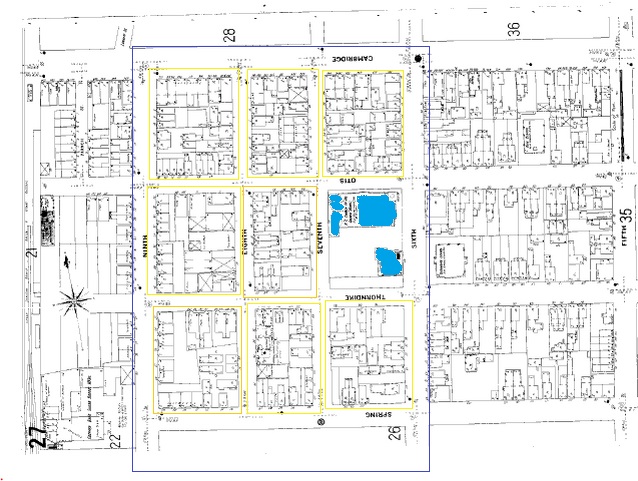 Figure 4- This 1900 Sanborn shows that the only land use change occurred at the site of figure 2a with the first building of the Sacred Heart Church. Outside of this the northern part of the plot is 100% residential with only flats and dwellings occupying the space. Blocks with the majority single family are boxed with yellow, and majority multifamily homes are boxed with orange.
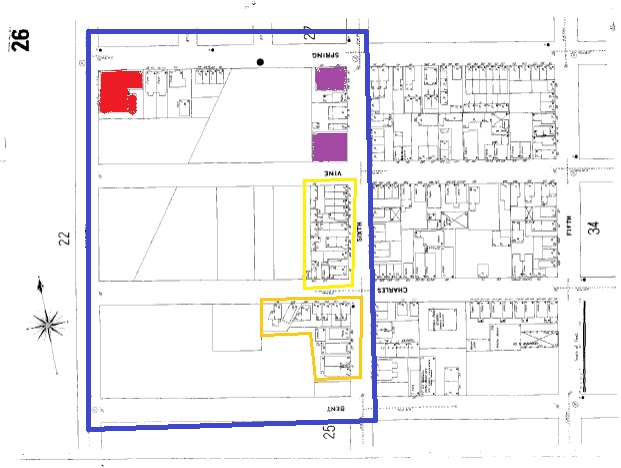 Figure 5- This 1900 Sanborn shows the southern part of the site with the boundary marked in blue. The few commercial and industrial buildings are noted, but they are still not making any noticeable foothold in the neighborhood. The two industrial buildings in purple are cigar and sausage factories, and the commercial building in red is a shop that make and sells wooden barrels. These are not what would be considered major pillars of industry, and as will be seen they are not the obvious cause of what this southern plot eventually becomes. The plot is still dominated by the residences, again marked in yellow and orange.
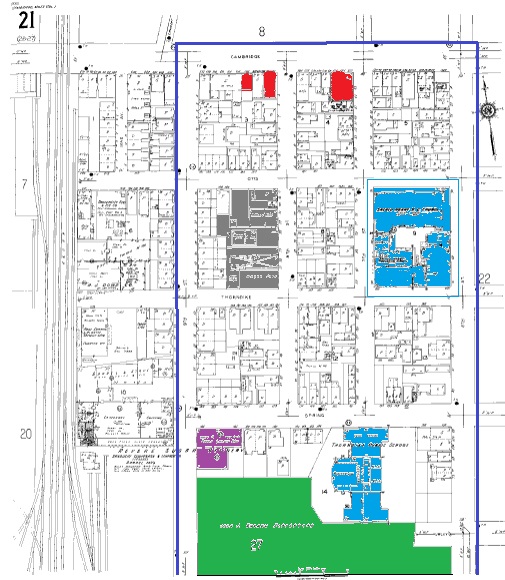 Figure 6- This figure shows one of the periods of major change in the northern part of the plot. Everything that is uncolored is a single or two family residential building. As can be seen the edges of the plot on Cambridge Street and 9th Street there is some industrial and commercial presence, though it is minor and of the type seen in figure 5. Towards the center of the plot there is a horse livery station in grey (transportation) and the Sacred Heart Church has been fully developed (blue). Towards the south the Thorndike Public Schools have been built and the plot to the south has been established as a field. The density and rapid settlement of the rest of the plot eliminated any significant chance of a large field being created, and the pause of development that is subsequently discussed is what leaves this plot available to become a field. This in turn also invites a school to enter and use the plot.
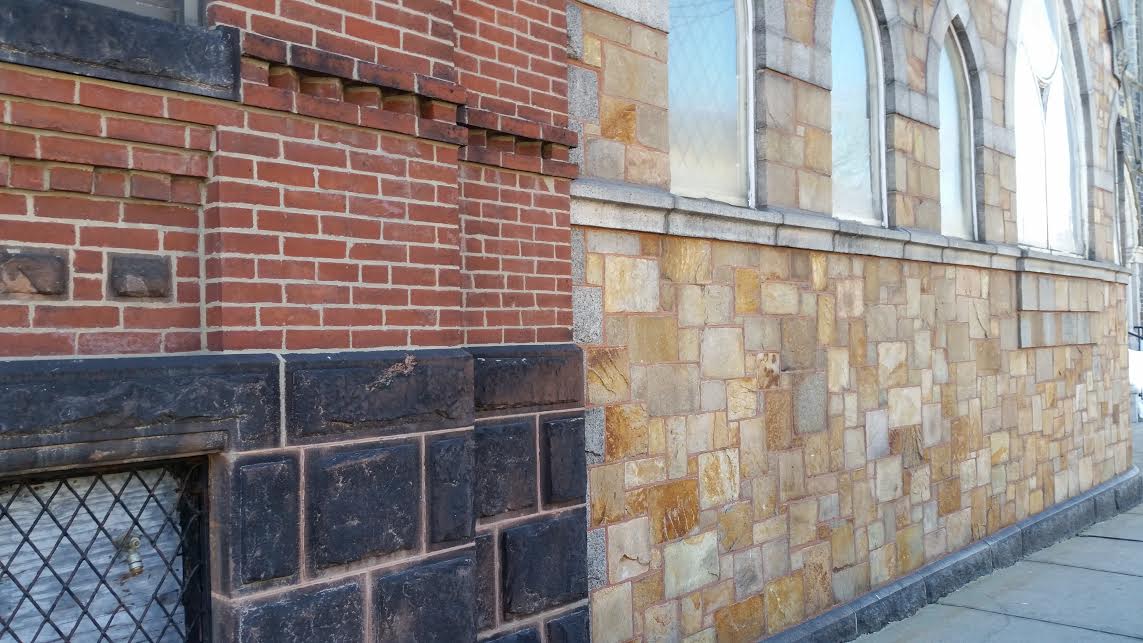 Figure 7- These photos show the side of the Sacred Heart Church from 6th street facing west. The intersections of different building materials offers some physical evidence of the rapid expansion of the church from 1900-1934 which is seen clearly on the map via its great size difference. The rapid development of this church (and also of the school) during a period where there was very little commercial and industrial growth provides a perspective of the character of this part of the plot
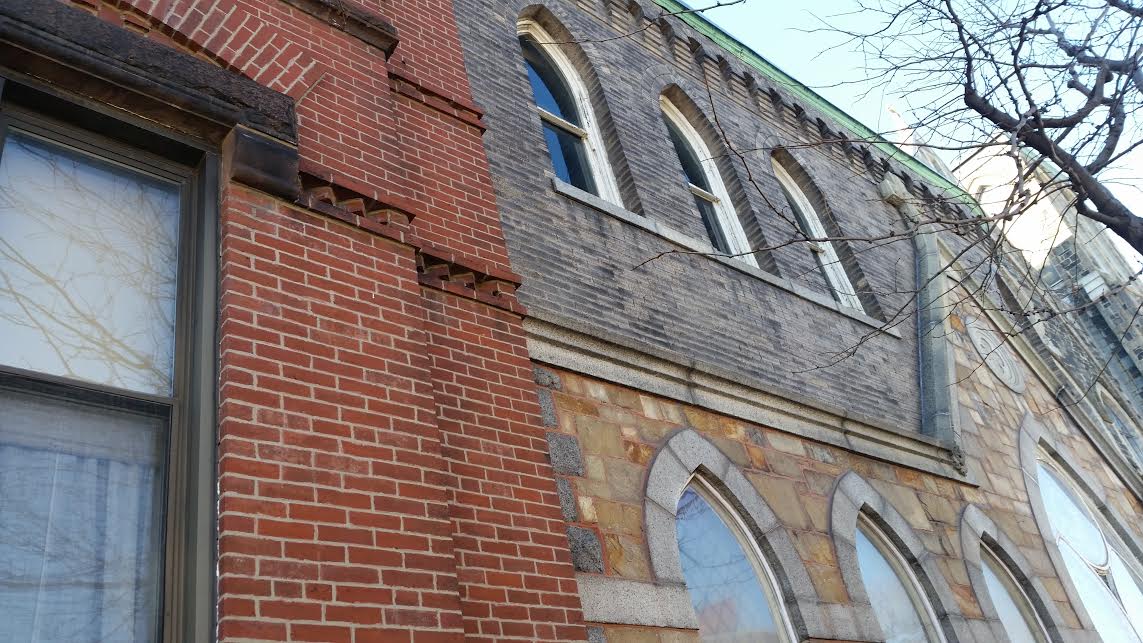 Figure 8 offers another view of the intesecting building materials directly above the one in figure 7. This is where the balcony meets the main chapel
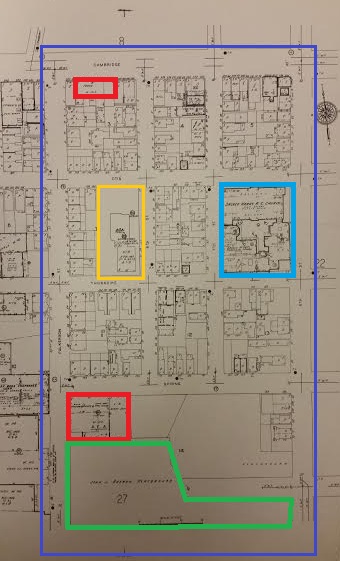 Figure 9- The 1970 Sanborn highlights some changes to the northern plot as it sets itself up to become more of what it is today. The first major change is the loss of the Thorndike School and also of the livery stable. The effect of transportation on this site in the form of the livery was short lived and likely unimportant, and the livery was replaced by a large multi-story apartment building, boxed in orange. The school plot however still retains its general shape and is bordered by the field, and it is adjacent to one of the remaining two commercial buildings in the site. These changes are quite opposite to the ones seen in figure 10
 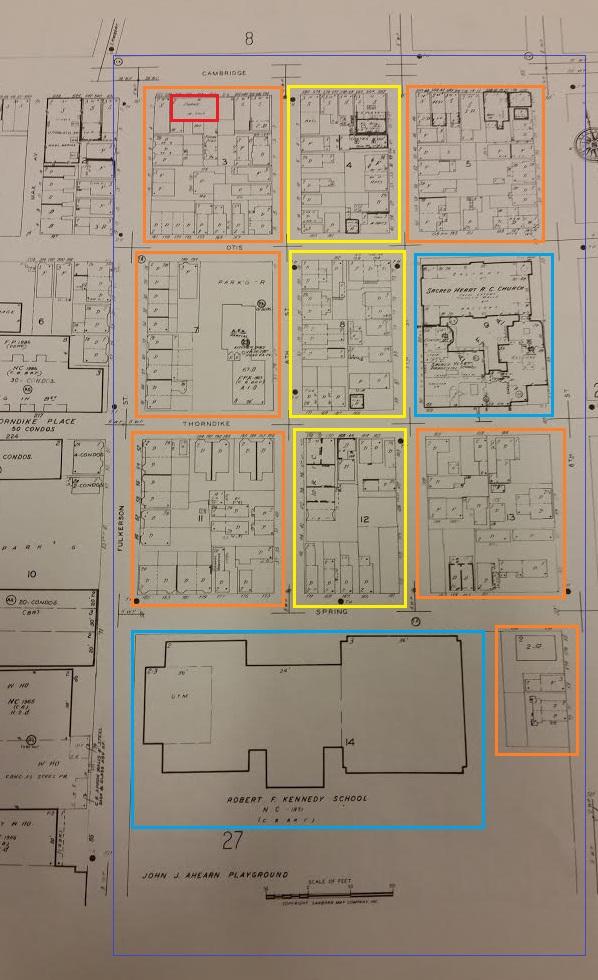 Figure 10- This 1988 Sanborn shows what comes closest to the final image that we get of the northern part of the site. The main part of the plot is dominated by residences which have been marked with yellow or orange depending on the proportion of single to multi-family homes. The new Robert F. Kennedy School has been constructed in place of the Thorndike school, and again the survival of the Ahern field played a large role in keeping this an educational institution site. The replacement of a small school with this one lends itself to the ideal location next to a large green space and proximity to a dense neighborhood and church. It is no doubt a great monument to Robert F Kennedy who died 20 years prior to the making of this map
 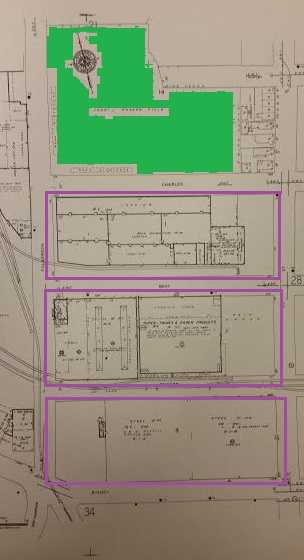 Figure 11- In this 1970 Sanborn we see the greatest period of change for the southern part of the plot. The small commercial presence and residential buildings that were creeping onto the plot have disappeared and been replaced by large industrial buildings, with companies including a beer factory, paper products factory, and steel company that owns 1.5 blocks of land. The pause in development of these 3 blocks south of the Ahern field leads to their sudden explosion into industrial areas due to the availability of large plots
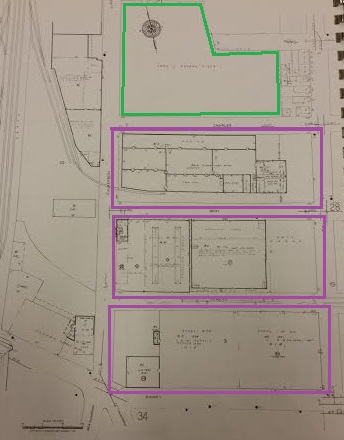 Figure 12- This 1988 Sanborn of the southern part of the plot shows little change since 1970. Each industrial building is still the same with the addition of one small building for the steel company in the block furthest south. Presently as is seen on figure 1 these blocks contain industries such as the Broad Institute (brought by MIT) and Ironwood Pharmaceuticals, and also the Cambridge Police Department. The blocks remain large and intact as opposed to the ones of the northern section which were distinctively sectioned off even in the 1873, vastly affecting the future of the northern half