Massachusetts Institute of Technology - Department of Urban Studies and Planning

11.188: Urban Planning and Social Science Laboratory
11.520: A Workshop on Geographic Information Systems

GPS Data Gathering

April 19, 2017


Administrative

  • Lab #7 (raster analysis): due Wednesday, April 19
  • Homework #3: Raster Analysis and ModelBuilder- now online
    • Part 1 (raster) due Wed., April 26
    • Part 2 (discussion and model builder) due Wed.. May 3
  • Lab #8 (web services): mapping field-collected data, due Mond. May 1
  • In-class text: solutions and graded test have been uploaded to Stellar

Outline for Today

  • Introduction to FlockTracker
  • Lab 8 overview: In this exercise, you will be describing neighborhood conditions based on field observations to be mapped and analyzed in ArcMap. You will use a mobile app called FlockTracker1 to gather data in the field, and a few tools in ArcMap to visualize, analyze and summarize your results:
    • Create CSV point dataset with FlockTracker using the survey form created for Lab8;
    • Load your dataset into ArcMap to create a shapefile, and symbolize the track points to analyze patterns in the data;
    • Load and review the pictures taken with FlockTracker using ArcMap;
    • Use Network Analyst to indicate your trajectory in ArcMap; and
    • Create a new shapefile to summarize data observations using new polygons that subdivide the study to help you describe your characterization of the neighborhood
  • FlockTracker setup workshop in preparation for Monday's (04/24) fieldwork.

Lab 8 Announcements

  • Lab 8 due dates:
    • Field work: Monday April 24th.
    • Due: May 1st, via Stellar.
  • Your submission should include three complete maps (make sure to include all map elements), featuring your observations on “land use”, “community characteristics”, and “physical conditions”, on separate maps. In addition, include one paragraph summarizing your findings. This should describe the information that you have noted in each of the three maps. Each of these maps should include the original track points, the line trajectory, the polygon(s) that summarize your analysis, and a couple photos taken with  FlockTracker to describe the type of observations made. The layout of these documents should be prepared in ArcMap, with no need to use additional graphic design software. You should submit ONE PDF per group, including your three maps and the names/roles of all members of the group.
  • See detail instructions for Lab 8 here.

Vector Data Creation and Manipulation

See lecture from April 12, "Georeferencing, Data Creation & Advanced Raster Operations", regarding the the creation and manipulation of shapefiles in ArcMap.


Network Analysis

Some additional information regarding Network Analysis from previous lectures that can be useful as further reference for Lab 8.

  • Encoding proximity using a network (or graph) model, facilitates certain types of connectivity analyses
    • Find shortest path along streets from Point A to Point B
    • Find shortest path through N cities (Traveling Salesman problem)
    • How far can you get in 30 minutes
  • Many transportation analyses use network data models
  • Many hydrological analyses use network data models (runoff, flow, ...)
  • Additional information on Network Analyst below


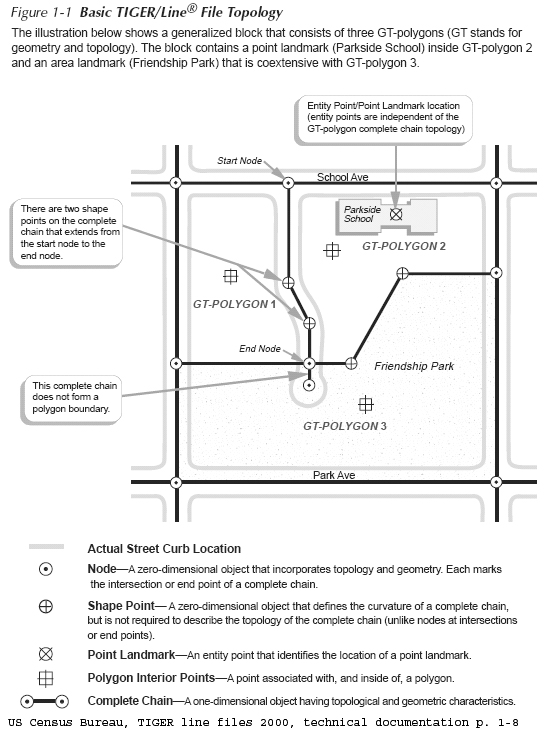
Network Example: using US Census Bureau, TIGER Line Files

  • Geocoding Strategy using TIGER
    • Encode road network as street centerlines links connecting nodes (usually intersections)
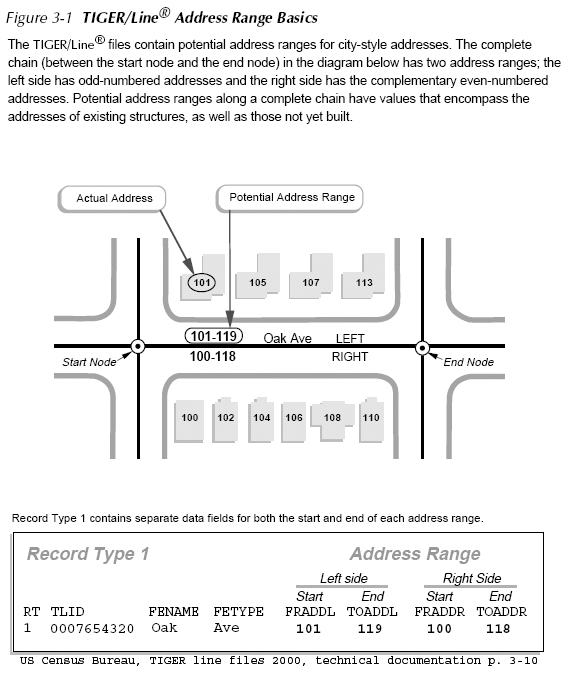
    • Attach address information to each street segment
    • Use 'in reverse' to match street address to street segment to get approximate X,Y location
  • TIGER: Topologically Integrated Geographic Encoding and Referencing system
    • Examine attribute table and note columns for to/from information
    • http://www.census.gov/geo/www/tiger/
    • US Census Bureau TIGER line file 2000, technical documentation
      • at Census: http://www.census.gov/geo/www/tiger/rd_2ktiger/tgrrd2k.pdf
      • in class locker: http://mit.edu/www/data/census2k/tiger_tgrrd2k.pdf
  • Illustrative Example
    Street centerline road segments
    Attaching address ranges to road segments


What is a Network?

A network is a system of linear features connected at nodes
E.g, nodes could be where three or more street segments intersect.
The linear feature connecting any given pair of nodes is called an arc, or network link.
Each arc on a network is represented as an ordered pair of nodes, in the form from node i to node j, denoted by (i, j), and thus has direction.
A network representation that is good for transportation modeling may differ from a geographically accurate representation of the physical road (e.g., street centerline, handling exit ramps, 3D overpasses, etc.)


Other basic elements of a network:

A shortest path is the shortest (or least 'cost' path) from a source node (origin) to a destination node.  In practice, pathfinding seeks the shortest or most efficient way to visit a sequence of locations.

A tour is an enclosed path, that is, the first node and the final node on the path are the same node on the network.

A stop is a location visited  in a path or a tour.

Events or locations may be viewed as collection points (e.g., 'origins' or 'destinations' ) where certain resources are supplied or consumed.

A turn on a network is the transition from one arc to another arc at a node (there are 16 ways in which two intersecting roads can allow vehicle flow among the 4 links that 'connect' to the one node).

'Location-allocation' models often use network representation of connected places in order to determine the optimal locations for a given number of facilities (e.g., stores, restaurants, banks, factories, warehouses, libraries, hospitals, post offices, and schools) based on some criteria, assign people to the the 'nearest' facility.


Last modified 13 April 2016 [jf]. Back to the 11.188 Home Page.
Back to the CRON Home Page.