Massachusetts Institute of Technology - Department of Urban Studies
and Planning
| 11.521 |
Spatial Database Management and
Advanced Geographic Information Systems
|
| 11.523 |
Fundamentals of Spatial Database
Management
|
In-Lab Exam (with solutions) - 21
March 2017
Instructions
This is an open-book, open-note examination. You are free to use the web
(especially the class web pages and online SQL documentation) to help you.
Like any examination, however, we expect your submission to reflect your
work exclusively. Hence any dialogue via any means (e.g., voice, paper,
e-mail, IM, texting) with anyone other than the class instructors is
prohibited.
The exam starts at 4:05 PM in the Room W31-301 Computing Lab. It is
intended to be finished by 6:00 PM but you can continue until 7:00 PM so
that there is less time pressure. All the tables needed for the exam
questions are accessible in Postgres using your personal account that we
have been using for lab exercises and homework. These tables are also
available in a personal geodatabase that can be opened using MS-Access (as
well as ArcMap).
The exam is worth a total of 100 points.
An effective way for you to prepare your exam answers is to use the same
familiar methods you have used for the lab assignments and homework.
Create an ASCII text or HTML or Word file in your Athena locker to contain
your answers. Name your exam username_exam.txt
if you use text format or username_exam.html if you
use HTML format. An MS-Word or PDF formatted document is also okay. For
your own security, we suggest that you save the final draft of your work
in the "Private" subdirectory of your locker (i.e., the user smith
might create the text file on her I:\ drive from a WinAthena PC and name
it I:\Private\smith_exam.txt). We strongly recommend that you
retain the file containing your SQL queries, and final answers and work
products until we return the graded exams to you.
- Remember to upload your answers to Stellar (in plain ASCII text
or MS-Word, HTML, PDF, and/or JPEG format) before leaving the room.
- Make sure to include your name and Athena user ID near the
beginning of each uploaded file (failure to include this will cost you
1 point)!
- Please confirm with an instructor that your exam has been
received.
Upload your exam to the homework section on Stellar: https://stellar.mit.edu/S/course/11/sp17/11.521/homework/
Finally, don't spend all your time on one or two questions.
Start by looking over all the questions to get a general sense of what,
and how much, is being asked, and the grade points associated with each
question. Then start work on your answers but move on to the next
question if you've spent more than 10 minutes on any one of them.
Good luck!
Data Preparation
Before beginning your work, copy the 'exam17_data'
folder from the 'data' folder in the class locker into a local drive
such as C:\TEMP. All the data that you will need for the exam can be
found either in your local copy of this folder or in the Postgres
database. Unless specified otherwise, all tables referenced in this
document are the names of tables in the Postgres database, exam17,
on the server that we have used for the class. All the queries required
for the test can be done either in Postgres or in MS-Access but a few
are easier in Postgres and the examples provided are tested in Postgres.
The datasets for this exam include newly released
2016 Boston data that are available on the city's open data portal: http://data.boston.gov We have
downloaded datasets related to Boston parcels, assessed values, and
building code violations and we have extracted data about East Boston
for use in this test. All the information needed for the exam is
provided in the 'exam17_data' folder containing the following:
| Type of Data |
File or Table Name |
Description |
| ArcMap doc |
./11.521_exam17_start.mxd |
ArcMap document, similar to the one we have been using since lab
#2, with several shapefiles and web servers pre-loaded that will be
a helpful starting point for the test. |
| Shapefile |
./shapefiles/ebos_buildings02 |
The familiar East Boston shapefile of building footprints from
2002 that we have used in exercises. The coordinates are stored on
disk in Mass State Plane (mainland) NAD83 (feet) coordinates.
|
| Shapefile |
./shapefiles/ebos_parcels05 |
The familiar East Boston shapefile of parcel boundaries from 2005.
The coordinates are stored on disk in Mass State Plane (mainland)
NAD83 (feet) coordinates. |
| Shapefile |
./shapefiles/ebos_parcels16 |
A new shapefile of East Boston parcel boundaries as of fiscal year
2016. It is similar to the familiar ebos_parcels05 shapefile but
stores boundaries on disk in lat-lon coordinates based on WGS84.
)Since the shapefile includes projection information, ArcMap
converts it on the fly to the Data Frame coordinate system for
viewing.) |
| Shapefile |
./shapefiles/ma_towns00 |
The familiar boundary shapefile of Massachusetts cities and towns
that we have used in lab exercises. The coordinates are stored on
disk in Mass State Plane (mainland) NAD83 (meter) coordinates. |
| Postgres Table |
eboston.bos05eb
|
The familiar 2005 assessing records for East Boston that we have
been using in lab exercises. |
| Postgres Table |
eboston.bos16eb
|
The 2016 version of the same type of assessing records for East
Boston that we have been using from bos05eb. |
| Postgres Table |
eboston.bad16pids
|
A list of PID values in the bos16eb assessing tables that are
considered 'bad' because they are repeated in more than one record
even though the PID field is supposed to be unique in the assessing
records. |
| Postgres Table |
eboston.mass_landuse
|
The same lookup table of Massachusetts land use codes that we have
used in lab exercises. Match 'ptype' in assessing tables with
'stclass_txt' in mass_landuse since both are stored as text. |
| Postgres Table |
eboston.matown2000
|
Attribute table from the MATOWNS00 shapefile of Massachusetts city
and town boundaries that we have used in lab exercises. |
| Postgres Table |
eboston.
ebos_parcels05_wgs84
|
Attribute table from the EBOS_PARCELS05 shapefile together with a
geometry column (that you will not need) that stores boundaries in
WGS84 coordinates. |
| Postgres Table |
eboston.
ebos_parcels16_wgs84
|
Attribute table from the EBOS_PARCELS16 shapefile together with a
geometry column (that you will not need) that stores boundaries in
WGS84 coordinates. |
| MS-Access database |
./gdb_access/
11.521_exam17.mdb
|
A Personal Geodatabase containing the seven Postgres tables listed
above. Note that this personal geodatabase is just an MS-Access
database with some extra 'GDB_*' tables that are not needed for this
exam. |
Part I: Writing SQL Queries (35 points)
For Part I, we will use the bos16eb table
that contains tax assessing data for real estate in East Boston. It is
analagous to the bos05eb table with 2005
assessed valued that we have used for class exercises. A few columns are
renamed or added but we will let you know ifthey matter for any questions
that we ask in the test.
Let us start by examining the land use categories and property types that
appear in bos16eb and compare them with our
familiar bos05eb data. Both tables are
available in and MS-Access. In Postgres, the bos16eb
and bos05eb tables are in the eboston
schema of the exam17 database. Make sure that
your search path looks at the 'exam17' as well as 'public' schema or you
will have to prefix all the Postgres tables names with 'exam17.'. For
MS-Access, both tables are included in the 11.521_exam17.mdb
database within the the exam17_data folder.
Show your SQL queries as part of your answers throughout the exam. Doing
so will enable you. to obtain partial credit in the event your answer is
not quite right.
Question I-1. (2 points each, 8 points total)
(I-1a): How many rows are there in bos16eb
____8329_______? how many in bos05eb
____7235____ ?
Select count(*), count(pid), count(distinct pid)
  from eboston.bos16eb;
 -- 8329;8329;8071
Select count(*), count(pid), count(distinct pid)
     from eboston.bos05eb;
     -- 7235;7235;7235
(I-1b): How many PID values are NULL in bos16eb
___none___? how many in bos05eb
__none_____?
count(*) counts the number of rows in the outpue and
count(pid) counts the non-null values of PID. Since they are the same,
there nust not be any null values in the PID column.
(I-1c): How many unique values of PID (the parcel
identifier) are there in bos16eb ___8071___?
how many in bos05eb ____7235_____?
count(distinct pid) will count the number of unique
values in the PID column. MS-Access does not support count(distinct xxx)
and, instead, you could do this:
select count(*)from (select distinct pid from
eboston.bos16eb) a;
Hmm, for bos05eb, there are no duplicate PID values in
the table, but for bos16eb there are a few hundred more rows than unique
PID values. That is suspect and led to our constructing the bad16pids
table that we use later on.
(I-1d): How many rows are there in the shapefiles for
Boston parcels in 2016 and 2005:
in ebos_parcels16____6558_______? and in ebos_parcels05
_____6554_______?
Select count(*), count(pid_long), count(distinct
pid_long)
from eboston.ebos_parcels16_wgs84;
-- 6558;6558;6558
Select count(*), count(pid_long),
count(distinct pid_long)
from eboston.ebos_parcels05_wgs84;
-- 6554;6554;6553
Hmm, every pid_long value is unique in
ebos_parcels16_wgs84, but ebos_parcels05_wgs84 has one duplicate. That
extra polygon comprise the entrance and exit road polygon next to the
airport parcel. We mentioned this issue in the test and pointed out that
it would not affect any of our answers to the other questions.
Question I-2. (4 points each, 12 points total)
(I-2a): What is the most common property type (ptype)
among all of the East Boston assessing records in bos16eb
___105____? How many records have this property type ___2142______?
select ptype, count(*) from eboston.bos16eb
group by ptype order by count(*) desc;
-- 99 rows and no null values
"105";2142 - three-fam dwelling
"102";1476 - residential condo
"104";1221 - two-fam dwelling
"101";977 - single-fam dwelling
"985";338 - other exempt building
"132";318 - residential land (unusable)
"995";281 - condo main (no value)
"13";218 - residential/commercial use
"111";217 - apt. 4-6 units
"106";97 - res ancill improvement
... rest have fewer than 100 cases
Well, triple deckers are still king, and residential
condos are second.
(I-2b): What is the most common property type (ptype)
among all of the East Boston assessing records in the 2005 table, bos05eb __105_____?
How many records have this property type ___2199____?
select ptype, count(*) from eboston.bos05eb
group by ptype order by count(*) desc;
-- 88 rows and no null values
"105";2199 - three-fam dwelling
"104";1246 - two-fam dwelling
"101";982 - single-fam dwelling
"102";632 - residential condo
"132";356 - residential land (unusable)
"985";274 - other exempt building
"111";230 - apt. 4-6 units
"013";196 - residential/commercial use
"106";111 - res ancill improvement
"995";92 - condo main (no value)
Wow, residential condos have gone from 632 to 1476 units
over the eleven years. Three-family dwellings have dropped by only 57
units, however. So, many of the condos must be on other types of
property - like on the docks in East Boston (where the Clipper Ships
were built a few hundred years ago) that are in the process of
redevelopment.
(I-2c): Write a SQL query that lists the property
type code (ptype), the description (descript
in mass_landuse), and the frequency of occurrence for
the 2016 table, bos16eb. Be sure that you
pay attention to data types when joining the tables.
In the previous two answers, only the codes and counts
were specified in the query and I added the description by hand. We can
join in the mass_landuse table to get the descriptions. However, there
is a data type matching issue when we do this. PTYPE in the assessing
tables is text. However, we see that property type codes less that 11
are stored without the leading zero. Matching with
mass_landuse.stclass_txt will only match the 3-character codes. Instead
we can convert ptype to integer and then match mass_landuse.stclass.
Here is that query:
select ptype, count(*) pcount, m.descript
from eboston.bos16eb b, eboston.mass_landuse m
where cast(b.ptype as integer) =m.stateclass
group by ptype, m.descript order by count(*) desc;
| ptype |
pcount |
descript
|
| 105 |
2142 |
Three-Fam Dwelling
|
| 102 |
1476 |
Residential Condo
|
| 104 |
1221 |
Two-Fam Dwelling
|
| 101 |
977 |
Single Fam Dwelling
|
| 985 |
338 |
Other Exempt Bldg
|
| 132 |
318 |
Res Land (Unusable)
|
| 995 |
281 |
Condo Main (No Value)
|
| 13 |
218 |
Res/Commercial Use
|
| 111 |
217 |
Apt. 4-6 Units
|
| 106 |
97 |
Res Ancill Improvement
|
| 130 |
77 |
Residential Land
|
| 986 |
62 |
Other Public Land
|
| 31 |
57 |
Com/Res Multi-Use
|
| 337 |
55 |
Parking Garage
|
| 112 |
53 |
Apt. 7-30 Units
|
| 332 |
50 |
Repair/Service Garage
|
| 390 |
46 |
Commercial Land
|
| 320 |
44 |
Retail/Warehouse/Service
|
| 902 |
37 |
City of Boston
|
| 317 |
34 |
Storage/Garage
|
| 109 |
32 |
Multiple Blds/1 Lot
|
| 125 |
31 |
Subsd S-8
|
| 908 |
27 |
Boston Housing Authority
|
| 907 |
26 |
121-A Property
|
| 343 |
25 |
Office 1-2 Story
|
| 319 |
23 |
Strip Center/Stores
|
| 326 |
22 |
Restaurant/Service
|
| 316 |
20 |
Warehouse
|
| 979 |
18 |
Hospital (Exempt)
|
| 976 |
18 |
School
|
| 906 |
16 |
Religious Organization
|
| 901 |
13 |
Commonwealth of Mass
|
| 980 |
13 |
Water Treatment Plant
|
| 384 |
13 |
Boat House/Marina
|
| 357 |
12 |
Retail Condo
|
| 387 |
10 |
Pay Parking Lot
|
| 114 |
9 |
Apt. 100+ Units
|
| 342 |
9 |
Medical Office
|
| 325 |
8 |
Retail Store Detached
|
| 131 |
8 |
Res Land (Secondary)
|
| 344 |
8 |
Office 3-9 Story
|
| 391 |
7 |
Com Land (Secondary)
|
| 407 |
7 |
Machine Shop (Small)
|
| 341 |
6 |
Bank Building
|
| 402 |
6 |
Office: Industrial
|
| 336 |
6 |
Com Parking Garage
|
| 328 |
6 |
Fast Food Restaurant
|
| 400 |
6 |
Old Manufacturing
|
| 353 |
6 |
Social Club
|
| 340 |
5 |
Office (Attached)
|
| 420 |
5 |
Tanks: Above Ground
|
| 333 |
5 |
Self-Service Station
|
| 465 |
4 |
Com Billboard
|
| 440 |
4 |
Industrial Land
|
| 903 |
4 |
Bost Redevlop Authority
|
| 108 |
4 |
Condo Parking (Res)
|
| 121 |
4 |
Rooming House
|
| 311 |
4 |
Laudromat/Cleaner
|
| 358 |
4 |
Office Condo
|
| 970 |
4 |
Church, Synagogue
|
| 314 |
4 |
Truck Rental
|
| 974 |
3 |
Fire Station
|
| 905 |
3 |
Charitable Organization
|
| 401 |
3 |
Whse: Industrial
|
| 355 |
3 |
Funeral Home
|
| 300 |
3 |
Hotel
|
| 392 |
2 |
Com Land (Unusable)
|
| 329 |
2 |
Bar/Tavern/Pub
|
| 127 |
2 |
Subsd Housing S-202
|
| 26 |
2 |
RC: Two Res Units
|
| 327 |
2 |
Restaurant/Lounge
|
| 973 |
2 |
Administrative Bldg
|
| 25 |
1 |
RC: One Res Unit
|
| 978 |
1 |
Library
|
| 356 |
1 |
Comm Condo
|
| 904 |
1 |
Private School/College
|
| 324 |
1 |
Supermarket
|
| 441 |
1 |
Ind Land (Secondary)
|
| 118 |
1 |
Elderly Home
|
| 27 |
1 |
RC: Three Res Units
|
| 335 |
1 |
Car Wash: Automatic
|
| 315 |
1 |
Piers/Dock
|
| 404 |
1 |
Light Mfg/R & D
|
| 370 |
1 |
Bowling Alley
|
| 312 |
1 |
Mini-Storage Warehouse
|
| 318 |
1 |
Cold Storage Warehouse
|
| 307 |
1 |
Veterinary Hospital
|
| 414 |
1 |
Food Processing Plant
|
| 446 |
1 |
Water/Sewer Utility
|
| 395 |
1 |
Air Terminal
|
| 424 |
1 |
Electric Substation
|
| 367 |
1 |
Race Track
|
I forgot to request that you limit the output to those
codes with at least 50 records, so the list is long - 92 rows. If you
matched via: b.ptype=m.stclass_txt then you would loose the 2-digit
codes and have only 87 rows.
Question I-3. (3 points each, 15 points total)
(I-3a): Let's examine which parcel identifiers (PID)
exist in both the 2005 and 2016 tables. We try this query:
select count(*) as row_count, count(distinct a.pid) as pid_count
  from bos05eb a, eboston.bos16eb b
 where a.pid = b.pid;
|
row_count
|
pid_count
|
|
7351
|
7105
|
Explain briefly why the two number differ? How many parcel identifiers
(PID) exist in both tables? __7105_______?
There are 7351 matches between a row in the bos16eb
table and a row in the bos05eb table with the same PID value. But, we
know from earlier queries that bos16eb has duplicate PID values in some
rows so 7361 overstates the number of unique PID values that match..
There are only 7105 unique PID values that appear in both tables.
(I-3b): How many parcel identifiers (PID)
exist in bos16eb but not in bos05eb
__978 records and 966 distinct pids______?
select count(*), count(distinct pid) from
eboston.bos16eb a
where pid not in (select pid from bos05eb);
-- 978 966 rows
Wow, quite a few new assessing records in 2016. Perhaps
a few owner-occupied triple deckers were converted into 4 records for a
condo-main ground parcel plus three condo units instead of the original
one assessing record for the triple decker.
(I-3c): How many parcel identifiers (PID)
exist in bos05eb but not in bos16eb
____130_______?
select count(*), count(distinct pid) from bos05eb a
where pid not in (select pid from eboston.bos16eb);
select count(*), count(distinct pid) from bos05eb a
where not exists (select pid from eboston.bos16eb b where a.pid=b.pid);
Both queries return the same value, 130. The second
query is harder to interpret but executes faster. So, the 130 assessing
records that disappeared may have resulted from adding more units on the
same parcel or convertin from owner-occupied triple deckers into condo
that haveo 4 records instead of the original one record per parcel.
Among those parcel identifiers (PID) that exist in bos16eb but not in bos05eb,
let us examine their property types (ptype).
(I-3d): What are the different property types (ptype)
for the records with those parcel identifier records (PID)
that exist in bos16eb but not in bos05eb?
First, create a view of assessing records in bos16eb but
not in bos05eb:
CREATE VIEW jf_hold16pid as
select pid, ptype from eboston.bos16eb a
where pid not in (select pid from eboston.bos05eb);
Select distinct ptype from jf_hold16pid order by ptype;
-- 29 different property types are in jf_hold16pid.
I-3e): Write a SQL query that lists the frequency of
occurrence of each property type (ptype) among those
parcel identifier records (PID) that exist in bos16eb
but not in bos05eb? Show the table of
results for all property types that are associated with at least 3
assessment records. Sort the table by the record count in decreasing
order.
select ptype, descript, count(pid) as type_count
from jf_hold16pid p, eboston.mass_landuse m
where cast(p.ptype as integer) =m.stateclass
group by ptype, descript
having count(pid) >= 3
order by type_count desc;
| ptype |
descript |
type_count |
| 102 |
Residential Condo |
854 |
| 995 |
Condo Main (No Value) |
33 |
| 101 |
Single Fam Dwelling |
17 |
| 105 |
Three-Fam Dwelling |
9 |
| 986 |
Other Public Land |
9 |
| 357 |
Retail Condo |
8 |
| 907 |
121-A Property |
7 |
| 130 |
Residential Land |
6 |
| 108 |
Condo Parking (Res) |
4 |
| 390 |
Commercial Land |
3 |
| 104 |
Two-Fam Dwelling |
3 |
| 985 |
Other Exempt Bldg |
3 |
| 420 |
Tanks: Above Ground |
2 |
| 317 |
Storage/Garage |
2 |
| 337 |
Parking Garage |
2 |
| 106 |
Res Ancill Improvement |
2 |
| 465 |
Com Billboard |
2 |
| 976 |
School |
1 |
| 904 |
Private School/College |
1 |
| 905 |
Charitable Organization |
1 |
| 446 |
Water/Sewer Utility |
1 |
| 125 |
Subsd S-8 |
1 |
| 132 |
Res Land (Unusable) |
1 |
| 970 |
Church, Synagogue |
1 |
| 901 |
Commonwealth of Mass |
1 |
| 903 |
Bost Redevlop Authority |
1 |
| 358 |
Office Condo |
1 |
Wow, 854 residential condos and the next highest
count is 33 - and these are for condo-main ground parcels. For your
information, I omitted the 'having count(pid) >=3' clause to get
the full table in the listing.
Part II: Short Answer and 'Fix SQL' Questions (22 points)
Question II-1. (7 points each, 14 points total)
(II-1a): The following query is intended to list the
Massachusetts municipalities along with their 1980-1990 change in
population for those municipalities that have more than ten polygons
associated with them in the shapefile. However, the query does not work
properly. Briefly explain why and show the corrected SQL query. (Note:
the Postgres table matown2000 is the attribute table
associated with the ma_towns00.shp shapefile that we
have used in lab exercises.)
SELECT town, count(town) tcount, (pop90 - pop80) pop_change
  FROM eboston.matown2000
 WHERE count(town) > 10
 GROUP BY town
 ORDER BY tcount desc;
There are two problems with the query: (a) the
population change computation needs to use aggregation functions since
it is not part of the 'group by', and (b) the count(town)>10
condition should be in a 'having clause' rather than the 'where' clause.
One of several correct queries is:
SELECT town, count(town) tcount, min(pop90 - pop80) pop_change
  FROM jf.matown2000
 GROUP BY town
HAVING count(town) > 10
 ORDER BY tcount desc;

TOWN                      TCOUNT POP_CHANGE
--------------------- ---------- ----------
BOSTON                        19       3564
WESTPORT                      17         -9
BARNSTABLE                    15       5869
GLOUCESTER                    15        624
GOSNOLD                       15         40
IPSWICH                       12        307
SCITUATE                      12       -487

7 rows selected.
It is also acceptable to retain (pop90-pop80) and add it
to the 'group by' clause. Then you would need to check that it did not
differ within a town so that the result had one row per town.
(II-1b): Consider the following query:
select count(*), count(pop80), count(distinct town)
  from eboston.matown2000;
The query returns the counts: 631, 631, and 351 respectively. Explain
briefly why all four numbers are not the same and what each number
means.
The first two counts of 632 represent respectively
the number of rows in the table and the number of rows with a non-null
value in the 'pop80' column. The 351 count is the number of unique
Town names in the 'Town' column.
If we added count(town)
to the query, we would get 611 on postgres but 631 in MS-Access and
ArcGIS. There are 611 polygon rows that have a Town name in the Town
column. The remaining 20 rows are blank in the Town column. In
Postgres these rows are coded as NULL and not counted by count(town).
However, the shapefile and MS-Access table have an actual blank space
' ' saved in the field! So, those rows are not counted as NULL. Note,
this result is common whereby numeric fields might have a 'zero' and
text fields might have a blank instead of NULL for missing cases.
Beware!
Question II-2. (8 points)
(II-2): Explain briefly what is meant by the phrase
'many-to-many relationship.' How are many-to-many relationships
typically handled when designing relational databases? Illustrate your
points using one of the database schemas that we have considered in
class lectures and exercises. (A verbal explanation is sufficient. No
need for an ER diagram or table definitions.)
Many-to-many : When two tables have a 'many-to-many'
relationship, each row of each table might match up with more than one
row of the other table. For example, in the URISA proceedings database,
the titles and keywords tables have a many-to-many relationship. The
titles table contains one row per paper and the keywords table contains
one row per keyword, but each paper can relate to as many as 5 keywords
and each keyword can be used by any number of papers.
Many-to-many relationships are usually dealt with
through a third 'match' table, effectively creating two one-to-many
relationships in place of the original many-to-many relationship. For
example, in the URISA database, the match table
relates paper numbers to keyword codes.
Part III: Thematic Mapping of SQL results (43 points - actually 45 so
max=102)
In Part III, we will use the 2005 and 2016 parcel and assessment data to
examine the nature and location of some of the real estate changes that
have occurred during this interval. Before starting, however, we need to
address some problems with the 2016 data. The parcel identifier, PID, in
the bos16eb table is not unique. There are 91
different parcel identifiers (PID) that have more than one record in bos16eb and these instances account for 349
records. For your convenience we have provided a table, bad16pids,
that lists PID, and the number of records, BADCOUNT, for each record that
involves duplicate PID values.. The bos05eb
table for 2005 assessment records has no duplicated PID values so there is
no need for a 'badpids' table for 2005.
Question III-1. (7 points)
(III-1): Rewrite your SQL query from question
I-3e so that it lists the frequency of occurrence of each
property type (ptype) along with the text description
of the property type for all parcel identifier records (PID) that are
listed in bad16pids.
select ptype, descript, count(pid) as type_count
from eboston.bos16eb p, eboston.mass_landuse m
where p.ptype=m.stclass_txt
and pid in (select pid from eboston.bad16pids)
group by ptype, descript order by type_count desc;
This query works but yields 26 rows and omits ptype values < 10 due to
data type mismatch.
ptype
|
descript |
type_count |
| 985 |
Other Exempt Bldg |
99
|
| 995 |
Condo Main (No Value) |
43
|
| 109 |
Multiple Blds/1 Lot |
32
|
| 907 |
121-A Property |
21
|
| 979 |
Hospital (Exempt) |
18
|
| 908 |
Boston Housing
Authority |
17
|
| 980 |
Water Treatment Plant |
13
|
| 384 |
Boat House/Marina |
10
|
| 112 |
Apt. 7-30 Units |
8
|
| 111 |
Apt. 4-6 Units |
8
|
| 317 |
Storage/Garage |
6
|
| 316 |
Warehouse |
6
|
| 114 |
Apt. 100+ Units |
5
|
| 901 |
Commonwealth of Mass |
5
|
| 320 |
Retail/Warehouse/Service |
4
|
| 986 |
Other Public Land |
3
|
| 402 |
Office: Industrial |
3
|
| 332 |
Repair/Service Garage |
3
|
| 314 |
Truck Rental |
2
|
| 337 |
Parking Garage |
2
|
| 326 |
Restaurant/Service |
2
|
| 125 |
Subsd S-8 |
2
|
| 407 |
Machine Shop (Small) |
2
|
| 401 |
Whse: Industrial |
2
|
| 400 |
Old Manufacturing |
2
|
| 974 |
Fire Station |
2
|
select ptype, descript, count(pid) as type_count
from eboston.bos16eb p, eboston.mass_landuse m
where cast(p.ptype as integer)=m.stateclass
and pid in (select pid from eboston.bad16pids)
group by ptype, descript order by type_count desc;
This query yields all 27 rows including the one with ptype = 13 instead of
013.
ptype
|
descript |
type_count |
| 985 |
Other Exempt Bldg |
99
|
| 995 |
Condo Main (No
Value) |
43
|
| 109 |
Multiple Blds/1 Lot |
32
|
| 907 |
121-A Property |
21
|
| 979 |
Hospital (Exempt) |
18
|
| 908 |
Boston Housing
Authority |
17
|
| 980 |
Water Treatment
Plant |
13
|
| 384 |
Boat House/Marina |
10
|
| 112 |
Apt. 7-30 Units |
8
|
| 111 |
Apt. 4-6 Units |
8
|
| 317 |
Storage/Garage |
6
|
| 316 |
Warehouse |
6
|
| 114 |
Apt. 100+ Units |
5
|
| 901 |
Commonwealth of
Mass |
5
|
| 320 |
Retail/Warehouse/Service |
4
|
| 986 |
Other Public Land |
3
|
| 402 |
Office: Industrial |
3
|
| 332 |
Repair/Service
Garage |
3
|
| 314 |
Truck Rental |
2
|
| 337 |
Parking Garage |
2
|
| 326 |
Restaurant/Service |
2
|
| 125 |
Subsd S-8 |
2
|
| 407 |
Machine Shop
(Small) |
2
|
| 401 |
Whse: Industrial |
2
|
| 400 |
Old Manufacturing |
2
|
| 974 |
Fire Station |
2
|
In lab exercises, we have used the shapefile, ebos_parcels05,
to map ground parcels in East Boston. The corresponding shapefile for 2016
is called ebos_parcels16. In each case, the
field, PID_LONG, in the shapefile identifies the ground parcel. The first
7 characters of PID_LONG can be joined to the first 7 characters of PID to
match the assessing records to the corresponding ground parcel. (That is,
just as in the earlier exercises, we can match the shapefile ground
parcels to assessing records via: substr(ebos_parcels16.pid_long,1,7) =
substr(bos16eb.pid,1,7) since the first 7 characters identify the ground
parcel and the last 3 are either 000 or enumerate each unit of a
condominium property).
For the 2005 shapefile ( ebos_parcels05),
there are no duplicates of PID_LONG. However, in the 2016 shapefile (ebos_parcels16) one ground parcel
(pid_long='0104126000' is duplicated. Upon inspection, we see that this
record is for the large airport ground parcel including all the runways.
However, there is also a second smaller parcel in the 2016 data with the
same pid_long that is associated with a polygon that includes highway
entrance and exit ramps near the entrance to the airport. For the purposes
of this test, we can ignore this small ground parcel with a duplicated
pid_long identifier. However, if you wanted to be sure to avoid having any
duplicated ground parcels, you could exclude the one record for the
entrance ramp parcel by omitting the parcel where pid_long='0104126000'
and shapestlen < 2400).
Question III-2. (7 and 3 points, 10 total)
(III-2a): Draw a thematic map that highlights those
ground parcels that have duplicate PID values in bos16eb.
(That is, the parcels associated with the assessing records that have
PID values included in bad16pids.) Use a
color ramp to shade these parcels according to the number of bos16eb
records that share the same ground parcel identifier. (That is: pid_long
= substr(PID,1,7)||'000' ) You may want to zoom in on the more populated
parts of East Boston (so some of the islands are excluded) in order for
some of your smaller shaded parcels to be a little larger.
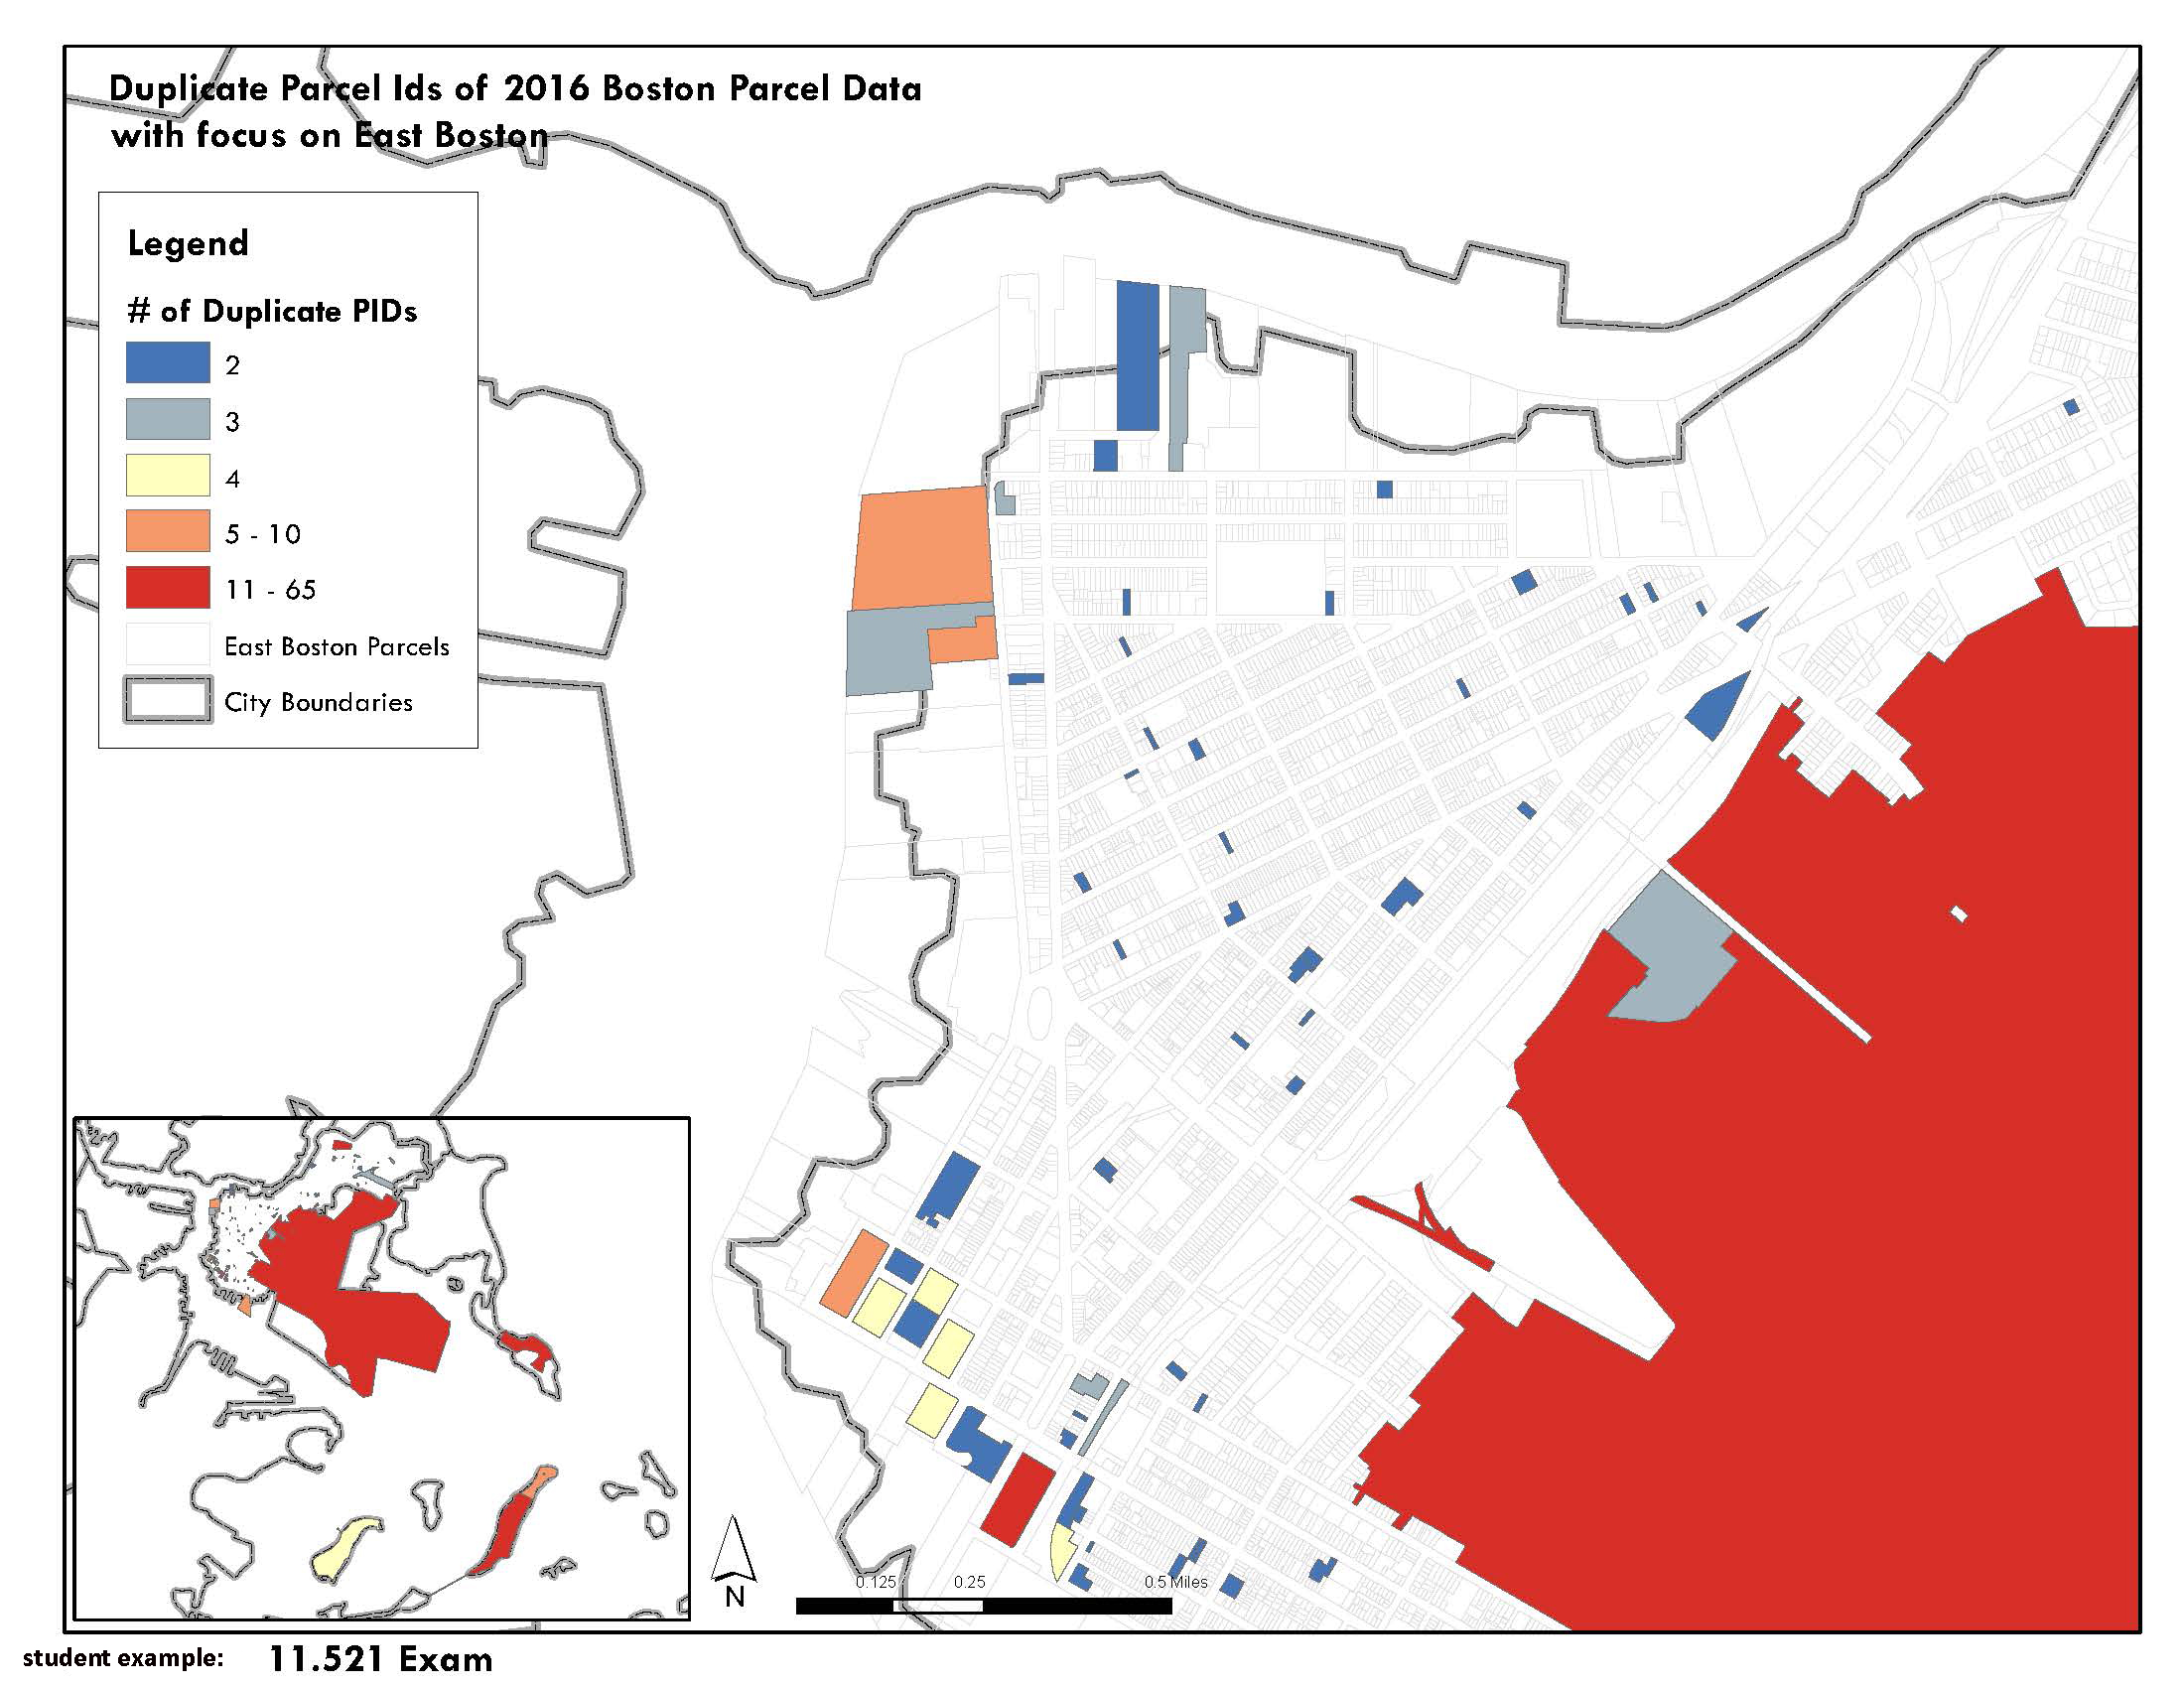
(III-2b): Comment briefly on any pattern that you see
regarding the location of the bad16pids
parcels and/or the frequency of duplication of PID.
The 'bad parcels' tend to be large parcels at the
water's edge and even including some harbor islands (which were not
included as part of East Boston in the 2005 data). They include
the airport, the train year to the north and other tax exempt property -
which may explain why assessing is not in a rush to fix the duplicate
pid issues since there is no tax to collect. Some of the larger
parcels at the water's edge, however, are not public space. For
example one on the south side is a marina with many boat slips - you can
see this using the ESRI imagery web service. In addition, there
are a number of small parcels - probably triple deckers - scattered
throughout the interior of East Boston.
Question III-3. ( 7 points)
(III-3): Create a view, xx_okparcels, that collects
all the unique ground parcels (that is, the substr(pid,1,7) portion of
PID) that appears in both bos16eb and bos05eb and are associated with at least one PID
value that is not in bad16pids. Substitute
your initials for 'xx' in xx_okparcels so you have a unique table name.
Remember that your view needs to be in the 'public' schema rather than
in the 'exam17' schema. (NOTE:This number of ground
parcels is not the same as computed earlier in question I-1c for
assessing records since that question referenced the full PID value and
not just the first 7 characters.) How many ground parcel identifiers do
you find in both tables: ___6096_____?
create view jf_okparcels as
select distinct substr(a.pid,1,7)||'000' as pid_long
from eboston.bos05eb a, eboston.bos16eb b
where substr(a.pid,1,7) = substr(b.pid,1,7)
and b.pid not in (select pid from eboston.bad16pids);
Since the assessing tables can have multiple rows with
the same ground parcel (that is, the first 7 characters - e.g., for
condos), then there can be duplicate matches and a 'distinct' in the
select clause will omit them. The ground parcel identifier always has
'000' at the end so I appended '000' to the first 7 characters to build
pid_long.
For all these ground parcels that appeared in both years (after excluding
ground parcels that only contained PID values in the bad16pids
table) let us determine how many ground parcels transitioned from
non-condo in 2005 to condo in 2016. To determine these numbers, we can use
the CM_ID column in the bos16eb and bos05eb
assessing tables. The CM_ID value is NULL for non-condos and, for condos,
is set equal to the ground parcel identifier.
Question III-4. ( 6 points each, 12 total)
(III-4a): Create a view, xx_noncondo05, that lists
all the ground parcels from xx_okparcels that were not
condos in 2005. Show your query and state the number of non-condo 2005
ground parcels that you find: ___6005_______.
create view jf_noncondo05 as
select distinct pid_long
from jf_okparcels p, eboston.bos05eb b
where cm_id is null
and substr(p.pid_long,1,7) = substr(b.pid,1,7);
There are 6005 unique ground parcels and the next query
shows that they are associated with 6424 assessing records in bos05eb
and 7467 records in bos16eb:
SELECT COUNT(*) FROM eboston.bos05eb
where substr(pid,1,7)||'000' in (select pid_long from jf_noncondo05); --
6424
SELECT COUNT(*) FROM eboston.bos16eb
where substr(pid,1,7)||'000' in (select pid_long from jf_noncondo05); --
7467
(III-4b): How many of these non-condo 2005 ground parcels became condos
by 2016? Create a view, xx_newcondo16 that selects these ground parcel
identifiers and report both the number of 2016 ground parcels (from
xx_okparcels) that became condos ___157_______
and the total number of assessing records associated with these
condo-converted ground parcels ____1061_______.
create view jf_newcondo16 as
select pid_long, count(*) unit_count
from jf_noncondo05 p, eboston.bos16eb b
where cm_id is not null
and substr(p.pid_long,1,7) = substr(b.pid,1,7)
group by pid_long order by count(*) desc;
select count(pid_long), sum(unit_count) unit_total
from jf_newcondo16;
Wow,157 parcels are converted and they account for more
than 1000 units. Instead of just converting triple-deckers, many
of these must be clustered housing with 10+ units per parcel.
Let's take a closer look, even though it was not requested on the test:
select count(*) pid from eboston.bos16eb
where cm_id is not null
and substr(pid,1,7)||'000' in (select pid_long from
jf_okparcels);
-- 1780 units from okparcels in 2016 are condo
select count(*) pid from eboston.bos05eb
where cm_id is not null
and substr(pid,1,7)||'000' in (select pid_long from
jf_okparcels);
-- 739 units from okparcels in 2005 were condos
So, East Boston more than doubled its number of condo
units by adding more than 1000 condo units between 2005 and 2016.
However, we saw from question I-2b that triple deckers are still king
with 2142 housing units in triple deckers as of 2016. That number
dropped a bit from 2199 in 2005, but is still a few hundred more than
the number of condo units.
Question III-5. ( 6 and 3 point, 9 total)
(III-5a): Create a thematic map showing those parcels that were
converted to condos between 2005 and 2016. Shade each ground parcel
based on the total number of assessing records that are associated with
that ground parcel. (NOTE: Not all of the pid_long values in
xx_newcondo16 will match to the polygons in ebos_parcels16. They should,
but the shapefile and assessing records came from different sources and
have not been fully reconciled. Do not worry about the xx_newcondo16
parcels that drop out of the match.)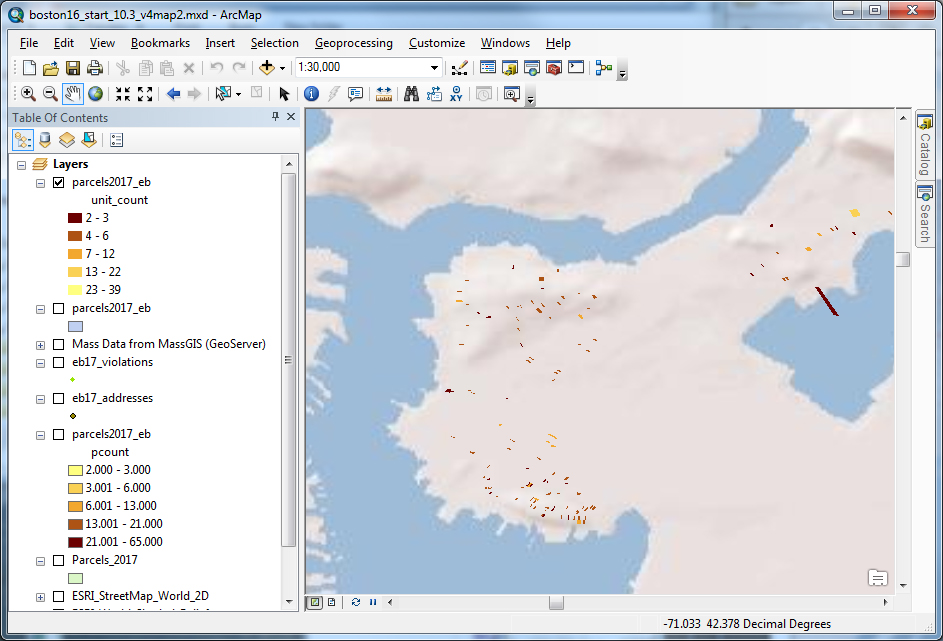
(III-5b): Comment briefly on the number of parcels that converted to
condos between 2005 and 2016 and any spatial pattern that you see in
this thematic map of new condos.
See queries and discussion at end of previous question
regarding which parcels converted to condos during the 11 years.
Compared with the 'bad15pids' the condo conversions tended to be
individual buildings, often triple deckers, scattered across the
small-parcel, residential neighborhoods away from the water's edge
(where the big new developments of clustered housing have occurred on
many of the 'badparcels'). There is some visible concentration of
parcels are on the north, east, and south hills that offer views of
Boston harbor.
Exam Turnin Checklist
Is your name and Athena ID at the top of your exam? If
not, you'll lose a point!
Is your completed test saved in a plain text (ASCII) file named username_exam.txt
or HTML (web page) file named username_exam.html, or
MS-Word file name username_exam.doc, or PDF
file named username_exam.pdf?
Did you upload your answers to Stellar:
https://stellar.mit.edu/S/course/11/sp17/11.521/homework/
Did you confirm with the instructor that your exam was received?
Home | Syllabus
| Lectures | Labs
| CRN | 37-312
lab | MIT
Last modified: 19 March 2017 [jf]