Project Amazonia: Characterization - Abiotic - Water
Introduction
The hydrologic cycle is a very important process in the proper functioning of the Amazon River basin. The most visible part of this cycle is the river itself. The river is 4,000mi in length, carrying approximately 20% of all of water discharged to the Earth’s oceans. The river originates in the high Andes Mountains, approximately 100mi west of the Pacific Ocean and travels east, terminating at the Atlantic Ocean. At the main outlet of the river, north of Marajo Island, the river is 40mi wide. At flood-stage, the river discharges 6,180,000ft3 at its mouth. The volume of water carried by the Amazon is so great that the salinity of the Atlantic Ocean is diluted within a 100mi radius from the terminus of the river.
The Amazon River is fed by a large network of over 1,000 tributaries. Seven of these tributaries are greater than 1,000mi in length, the largest of which is the Negro River. The Negro River alone carries 20% of the discharge of the Amazon River. The Amazon River’s tributaries can be roughly divided into three categories: blackwater, whitewater and clearwater1. Blackwater tributaries originate in the ancient crystalline highlands. Examples of blackwater rivers include the Jari, Trombetas, Negro, Tocantins-Araguaia and Xingu Rivers. These rivers are termed "blackwater" because they originate from acidic rains that are rich in humus and nutrient poor. Whitewater rivers, such as the Madiera are categorized by high sediment concentrations. Clearwater rivers like the Tapajos have slowed water rates where the sediment is allowed to settle.
The Amazon Basin rainforest covers an area of 2.3 million mi2. At its widest part, it rainforest stretches 1,725mi. The basin includes parts of several nations, including Brazil, Peru, Columbia, Ecuador, Bolivia, and Venezuela. Brazil, which encloses 2/3 of the basin, was chosen to be the focus of the Project Amazonia class.
The Basin can also be roughly divided into two broad categories: lowland and upland. Lowland areas principally border the Amazon River itself and its tributaries and are 12-30mi wide. These areas are characterized by a yearly flooding cycle. The other 2/3 of the basin is considered upland. Upland regions are covered by immense rainforests that transition to dry forests and savannas in the West. Upland regions may also be described as "gently undulating hills." These areas are composed of layers of alluvial soil deposited as much as 2.5 million years ago and contain many shallow oxbow lakes and wetlands. The average rainfall for upland regions is 60-120in/yr2.
Rainfall
Precipitation arises from
sources both within and outside the Amazon River basin. Sixty-four percent of
water vapor flux into the Amazon comes through the eastern border of the basin.
The remaining 36% enters through the northern border of the basin. Little water
vapor enters the Amazon Basin from the west because the Andes Mountains serve as
an
effective barrier to storm systems moving eastward from the Pacific Ocean. At
the same time, this also means that little water vapor escapes the basin through
its western border. Water vapor entering the Amazon through the eastern and
northern borders together account for approximately 50% of the precipitation in
the Amazon. The remaining 50% comes from precipitation recycling within the
Amazon Basin rainforest -- evaporation and evapotranspiration2.
Rainfall-producing mechanisms can roughly be divided into five scales -- continental, sinoptic, subsinoptic, meso-scale, and micro-scales. Each of these mechanisms is responsible for a different type of precipitation scheme. Our review of these mechanisms proceeds in the order of diminishing scale3.
At the continental scale, 80-90% of solar radiation absorbed at the surface is used to evaporate water. The remaining 10-20% is responsible for heating the air. The intertropical convergence zone in the Atlantic (ITCZA) as well as the convergence of Northern and Southern hemisphere trade winds function at this scale3.
The sinoptic scale (1000km) is the next smaller scale. At this scale, Southern hemisphere cold fronts or frontal systems, penetrate into Amazonia any time of the year. During the winter, these systems are characterized by a sharp 15-20º temperature decrease, lasting 3-5 days. During the summer, these systems are generally NW-SE oriented and cross the coast at 15-25ºS. It is believed that Northern hemisphere frontal may also have similar effects3.
At the subsinoptic scale (500-1000km), instabilities or squall lines in the atmosphere can cause precipitation. The highest frequency of such instabilities occur in July. These squall lines occasionally propagate inland, possibly due to convergence of sea breeze. These instabilities may also be associated with waves in the trade wind field triggered by the deep penetration of frontal systems over the subtropical Atlantic3.
Meso-scale (100km)
precipitation is caused by convective cells and clusters of Cbs. Precipitation
caused by such cells is characterized by a high intensity and short duration in
scattered locations. Micro-scale (1-10km) precipitation is caused by small
convective cells that form during the morning hours and precipitate around
14-15hrs local time3.
Pacific and Atlantic Ocean Surface Temperatures
Precipitation in
the Amazon is affected by land alterations such as clear-cutting and farming.
Certain changes to the land and soil will cause flooding, others will cause
drought. Sea surface temperature of the Atlantic and Pacific oceans also plays a
role in influencing the rainfall of the Amazon Basin region. When sea surface
temperatures drop, floods result and when the temperatures increase, drought
conditions are prevalent.
Three ocean regions affect the rainfall in the Amazon: 1. Atlantic Ocean 2.
Eastern Pacific Ocean and 3. Western Pacific Ocean. The most influential of
these three is actually the Western Pacific region, even though evaporation has
to travel across the Andes Mountains. The Atlantic and eastern Pacific regions
have similar, weaker effects on the rainfall of the Amazon4.
Variations in rainfall
On a decadal scale, water vapor input into the Amazon River basin has been
experiencing a decreasing trend since the 1960's. This trend is believed to be
associated with relaxed southeasterly trade winds, a decreasing east-to-west
pressure gradient, and a general warming of the sea surface temperatures in the
equatorial South Atlantic5.
On a yearly scale, precipitation variability may be attributed to the El Niño-Southern
Oscillation (ENSO) as well as several other secondary factors. Secondary factors
include the strength of the North Atlantic high, the position of the ITCZA, and
the sea surface temperature of Atlantic Ocean. Precipitation lags behind ENSO
by 3-4 months, with river discharge lagging an additional 3 months. This
additional lag is likely due to the contribution from subsurface drainage since
surface runoff tends to occur at a much shorter timescale. Soil water storage
similarly follows precipitation by approximately 1-2 months5.
On a season cycle, precipitation has been observed to vary up to 5mm/day, with
runoff vary up to 2mm/day and evapotranspiration remaining constant5.
Rainfall evolution
The simplest models of the flow of water through soil take advantage of the fact
that the surface soil can be divided into three major layers. The first of these
layers includes the top soil. The second layer extends to rooting depth (d2)
and the third layer extends to the total soil depth (d3). The sum of
the water saturation of the three components is equal to the total rainfall to
reach the land surface. The relationship between water saturation and rainfall
for each of the layers can be described by the following three mathematical
equations6.
A more physically
realistic general circulation model (GCM) developed at the NASA / Goddard
Institute for Space Science (GISS) introduces a canopy resistance and a
six-layer soil system. This new scheme also allows runoff to travel from a
river's headwater to its mouth according to topography and other channel
characteristics. This model also produces more realistic evaporation
statistics, taking into consideration conservation of mass, momentum, energy,
and water vapor7.
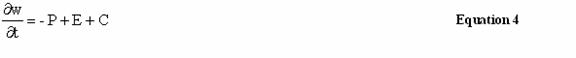
The water budget equation for the atmosphere is also related to precipitation
(P), evapotranspiration (E), the vertically integrated moisture convergence (C).
Evaporation
Evaporation can be
indicated by a measure called the precipitation recycling ratio (p).
This ratio is the contribution of evaporation within a region to precipitation
in the same region. A high precipitation recycling ratio estimate is not
sufficient to conclude a strong role for land surface hydrology in the regional
climate. Rather, it suggests a strong potential for significant changes in
surface hydrology to impact regional climate8.
The following model makes two assumptions: 1) atmospheric water vapor is
well-mixed, and 2) the rate of change of storage of water vapor is negligible
compared with water vapor fluxes at the time-scale for which the model is
applicable. The model supposes two distinct relationships for water vapor
evaporation, that within the region, and that outside the region, yielding the
equation,
![]()
where inflow is
represented by I, evaporation is represented by E, and the subscripts o
and w represent outside the region and inside the region,
respectively8.
Careful observation of evaporation data has led to the conclusion that the
atmosphere above the Amazon Basin is not a closed system. Data suggest that
there is a significant migration of moisture out of the basin. Furthermore,
this flux out of the basin accounts for only 68% of the flux into the system.
This implies that the outflux of atmospheric moisture from the basin may
contribute important input to the hydrologic cycles of the surrounding regions.
Furthermore, changes in the Amazon Basin evaporation levels may potentially
affect the moisture supply and rainfall of surrounding regions8.
The contribution to rainfall of precipitation recycling is largest to the west and south. The maximum rate of recycling occurs at the southwestern corner of the basin, where greater than 50% of precipitation can be attributed to evaporation8.
Evapotraspiration
Mechanisms controlling changes in evapotranspiration are primarily driven by changes in albedo, surface roughness and the depth of water available to plant roots. For example, increased albedo inhibits absorption of the incoming solar radiation, reducing the available energy for latent-heat exchanges9.
The Amazon rainforest is highly efficient in recycling water vapor back into the atmosphere. Measuring this parameter however, is has proved extremely difficult. One reason for this is that evapotranspiration levels are highly variable across the Amazon Basin as evidenced by the following data:
| 610mm/yr in the semi-arid Rio Grande basin | |
| 1520mm/yr in the Orthon River basin | |
| 780mm/yr in Andean part of Beni River basin | |
| 1220mm/yr in oriental basins of Mamoré River | |
| 800mm/yr in the Bolivian Andean part of the upper Madeira River basin9. |
|
|
Results of evapotranspiration are summarized below, showing great variability due to great difficulty in making precise measurements.
Table 1: Hydrologic cycle of the Amazon Region10
|
Research |
Rainfall |
Transpiration |
Evapotranspiration |
Runoff |
|||||
|
|
mm |
mm |
% |
mm/day |
mm |
% |
mm/day |
mm |
% |
|
Marques et al. 1980 |
2328 |
|
|
|
1260 |
54.2 |
3.5 |
1068 |
45.8 |
|
|
2328 |
|
|
|
1000 |
43.0 |
2.7 |
1328 |
57.0 |
|
|
2328 |
|
|
|
1330 |
57.1 |
3.6 |
998 |
42.9 |
|
Villa Nova et al. 1976 |
2000 |
|
|
|
1460 |
73.0 |
4.0 |
540 |
27.0 |
|
|
|
|
|
|
1168 |
58.4 |
3.2 |
832 |
41.6 |
|
|
2105 |
|
|
|
1569 |
73.4 |
4.3 |
532 |
26.6 |
|
Molion 1975 |
2379 |
|
|
|
1146 |
48.2 |
3.2 |
1233 |
51.8 |
|
Ribeiro et al. 1979 |
2478 |
|
|
|
1536 |
62.2 |
4.2 |
942 |
38.0 |
|
|
|
|
|
|
1508 |
60.8 |
4.1 |
970 |
39.2 |
|
Ipean 1978 |
2179 |
|
|
|
1475 |
67.5 |
4.0 |
704 |
32.5 |
|
|
|
|
|
|
1320 |
60.6 |
3.6 |
859 |
39.4 |
|
Dmet 1978 |
2207 |
|
|
|
1452 |
65.8 |
4.0 |
755 |
34.2 |
|
|
|
|
|
|
1306 |
59.2 |
3.6 |
901 |
40.8 |
|
Jordan et al. 1981 |
3664 |
1722 |
47.0 |
4.7 |
1905 |
52.0 |
5.2 |
1759 |
48.0 |
|
Leopolo et al. 1981 |
2089 |
1014 |
48.5 |
2.7 |
1542 |
74.1 |
4.1 |
541 |
25.9 |
|
Leopolo et al. 1982 |
2075 |
1287 |
62.0 |
3.5 |
1675 |
80.7 |
4.6 |
400 |
19.3 |
|
Shuttleworth 1988 |
2636 |
992 |
37.6 |
2.7 |
1320 |
50.0 |
3.6 |
|
|
|
Able-2B 1987 (1 month) |
290 |
|
|
|
157 |
54.1 |
5.2 |
|
|
Trends
Over the past twenty
years, the hydrologic cycle has experienced a number of trends, which are likely
to be indicators of the effect of deforestation on the whole Amazon River basin
region. If changes in water vapor transport continue into the future, combined
with decreases in evapotranspiration, all of the sources of water vapor into the
Amazonian atmosphere will be significantly altered. In turn, this will have
huge ramifications on the entire Amazon River basin ecosystem5.
The first of these trends is decreasing atmospheric transport of water vapor
both into and out of the system. This trend is believed to be associated with
relaxed southeasterly trade winds, a decreasing east-to-west pressure gradient,
and a general warming of the sea surface temperatures in the equatorial South
Atlantic5.
The second of these trends is increasing internal recycling of precipitation and
basin-wide precipitation. This is occurring even as evapotranspiration and
runoff have remained at a constant level across the entire basin. Annual mean
atmospheric trends do exist for the eastern part of the basin. On a yearly
scale, precipitation variability may be attributed to the El Niño-Southern
Oscillation (ENSO) as well as several other secondary factors which include the
strength of the North Atlantic high, the position of the intertropical
convergence zone, and the surface temperatures of Atlantic. On the decadal
scale, these factors are still important, but less so5.
Over the 1960's and 1970's there was a general increase in Amazon River basin
precipitation and river discharge. However, precipitation and river discharge
over 1970's and 1980’s were average. One explanation for this decrease is the
changes in the frequency and duration of the positive phases of the ENSO5.
Deforestation
No one doubts that deforestation will have a devastating effect on the hydrologic cycle of the Amazon Basin. Research has clearly shown that deforestation of the Amazon will cause a decrease in precipitation of 25% or 1.4mm/day11. From 1990-1993 rainfall decreased in almost every month, as evidence to this trend. However, reductions in rainfall will not occur uniformly across the basin. At some locations rainfall may decrease by up to 65%, whereas other locations (typically the mountainous regions of Peru and Ecuador) will experience increases in rainfall. Furthermore, changes in precipitation are not confined to the Amazon River basin itself. Evidence for this comes from the observation that during the southern summer and autumn there are large fluctuations in precipitation in eastern Brazil which seem to correlate with precipitation changes over deforested areas12.
Research has also shown that deforestation of the Amazon Basin will cause an increase in evapotranspiration of 0.7mm/day. Similarly, total runoff will decrease by 0.7mm/day11. Surface runoff however, will increase substantially, primarily as a result of decreased soil infiltration capacity and changes in the spatial distribution and intensity of rainfall12. In addition, temperature will increase 1-4°C. This results from a decrease in surface roughness and a decrease in the amount of energy used to evaporate water at the canopy and soil surface levels11.
In summary, these changes in the hydrologic cycle will be caused by:
|
|
1) Decreased surface roughness
2) Increased surface albedo
3) Changing soil properties
4) Decreased rooting depths, and
5) Decreased infiltration rates11.
|
|
One conclusion that may be drawn from the observation that the reduction in precipitation is larger than the reduction in evapotranspiration is that the length of the dry season will increase. In turn, deforestation will become self-perpetuating13.
Table 2: Model fields averaged over the simulation and over the Amazon Forest11
|
Field |
Control |
Deforested |
Change |
|
Daily Maximum Temperature (K) |
304.1 |
306.7 |
2.6 |
|
Daily Minimum Temperature (K) |
294.8 |
294.6 |
-0.2 |
|
Mean Surface Soil Temperature (K) |
298.8 |
299.4 |
0.6 |
|
Precipitation (mm / day) |
5.5 |
4.1 |
-1.4 |
|
Runoff (mm / day) |
2.0 |
1.3 |
-0.7 |
|
Evapotranspiration (mm / day) |
3.5 |
2.8 |
-0.7 |
|
Interception (mm / day) |
1.3 |
0.8 |
-0.5 |
|
Sensible Flux (W / m2) |
54.0 |
56.0 |
2.0 |
|
Absorbed Solar Radiation (W / m2) |
215.0 |
212.0 |
-3.0 |
|
Net Longwave Radiation (W / m2) |
59.0 |
74.0 |
15.0 |
|
Fractional Cloud Cover |
.53 |
.46 |
-0.07 |
|
Relative Soil Moisture |
0.7 |
0.4 |
-0.3 |
Table 3: Summary of Surface Variables for Control (C) and Deforested (D) Simulations Averaged over 3 years for Amazonia10
|
Surface Variable |
Control |
Deforested |
Percent Difference |
|
Evapotranspiration (m/d) |
3.12 |
2.27 |
-27.2% |
|
Precipitation (m/d) |
6.60 |
5.26 |
-20.3% |
|
Soil Moisture (cm) |
16.13 |
6.66 |
-58.7% |
|
Runoff (m/d) |
3.40 |
3.00 |
-11.9% |
|
Net Radiation (W/m^2) |
147.29 |
125.96 |
-14.4% |
|
Temperature (C) |
23.55 |
25.98 |
10.3% |
|
Sensible Heat (W/m^2) |
57.19 |
60.15 |
5.2% |
|
Bowen Ratio |
0.85 |
1.50 |
76.5% |
![]()
1: Saliot, A et al., "Particulate Organic carbon, sterols, fatty acids and pigments in the Amazon River system", Biogeochemistry, Kluwer Academic Publishers, 2001, v53 p79-103
2: "Amazon River" Encyclopædia Britannica < http://www.search.eb.com/eb/article?eu=121415 > [Accessed September 30, 2002].
3:Molion,
Luiz Carlos Baldicero "Climate variability and its effects on amazonian
hyrdology"
Water Management of the Amazon Basin
Ed. Braga, Benedite P. F., Jr., and Fernandez-Jauregui, Carlos A. UNESCO (1991):
261-274.
4: Shaw, Robinson. Sea surface temperatures impact weather in Amazon basin. <http://www.enn.com/enn-news-archive/1999/12/122499/sstamazon_8414.asp>
5: Costa, Heil, Marcos, and Foley, Jonathan. "Trends in the Hydrologic Cycle of the Amazon Basin". Journal of Geophysical Research. Vol. 104 No. D12. 1999.
6: Engman,
E. T. Remote sensing in hydrology / London : Chapman and Hall ; New York : Van
Nostrand Reinhold, 1991.
7: Marengo, J. A; Miller, J. R.; Russell, G. L.; Resenzwieg, C. E.; and Abramopoulos, F."Calculations of river-runoff in the GSS GCM: impact of a new land-surface parameterization and runnoff routing model on the hydrology of the Amazon River." Climate Dynamics 10 (1994) : 349-361
8: Eltahir, E. A. B., and Bras, R.L. "Precipitation Recycling in the Amazon Basin." Quarterly Journal of the Royal Meteorological Society 1994
9: Roche, M. A. Water and salt balances of the Bolivian Amazon. Ed. Benedite Braga, and Carlos Fernandez-Jauregui. 1991. 83-94.
10: Nobre, Carlos A. Possible climatic impacts of Amazonia Deforestation. Ed. Benedite Braga, and Carlos Fernandez-Jauregui. N.p.: n.p., 1991. 245-260.
11: Dickinson, Robert E. and Kennedy, Patrick, 1992, Impacts on regional climate of Amazon deforestation, Geophysical Research Letters 19 (19) P1947-1950
12: Lean, J., and P. R. Rowntree. "A GCM Simulation of the Impact of Amazonian Deforestation on Climate Using and Improved Canopy Representation." Quarterly Journal of the Royal Meteorological Society 1993:
13:Henderson-Sellers, A.; Dickinson, R. E., Durbudge, T. B., Kennedy, P. J., McGuffie, K., and Pitman, A. J., 1993, Tropical Deforestation: Modelling local- to regional-scale climate change, Journal of Gephysical Research Vol 98 No. D4 P7289-7315