|
Maps |
 |
Basemap (141 Kb) - The base map shows streets (including the names of major streets), bridges, surface rail lines, highways, Cobbs Creek on the west and the Schuylkill River on the east, the original WPLP project boundaries, and the boundary of the Mill Creek watershed. This map is literally the "base" for all the others; other information in the database is "overlaid" on this map. |
 |
Project Boundary (148 Kb) - This map shows the outline of the study area for the West Philadelphia Landscape Plan. |
 |
Building Footprints (227 Kb) - This map shows the outlines of building footprints in brown for most of the project area. Left: a detail of the area around the University of Pennsylvania. |
 |
Property Lines map (255 Kb) - This map shows property lines in green. Addresses of all corner lots are also provided to help locate specific sites at the scale of a neighborhood or block. Left: a detail showing the Mill Creek neighborhood.
|

|
 |
West Philadelphia Neighborhoods (156 Kb) - This map contains the boundaries and names of fifteen neighborhoods in West Philadelphia. Various state and local agencies may use neighborhood boundaries that differ from those used here. |
 |
West Philadelphia Public Education Catchment Boundaries (156 Kb) - This map contains the boundaries and names of the elementary, middle and high school catchment boundaries as designated by the Philadelphia School Board. |
 |
Mill Creek Neighborhood (138 Kb) - The image to the left was created by zooming in on the Mill Creek neighborhood from the larger West Philadelphia neighborhoods map.
|
|
|
 |
Land Use (163 Kb) - The Land Use map shows five categories of use: commercial, residential, industrial, institutional, and transportation. These five categories combine more specific categories used by the Philadelphia City Planning Commission (CPC). The WPDD uses standard land-use colors, and the submenu itself is coded to provide a type of key or legend. The more specific designations utilized by the CPC appear in the center of each property. For example, all residential properties appear as a yellow color, but if you look at a particular property, an "M" might indicate that the site is designated as a Multiple Dwelling Unit/University Dormitory. |
 |
Land use map for Mill Creek neighborhood (122 Kb) - The image to the left was created by zooming in on the Mill Creek neighborhood. |
 |
City Planning Commision Land Use Grid (160 Kb)The City Planning Commission maps its land use data using this grid. It is possible to purchase base maps using the alphanumeric codes indicated.
|
|
|
 |
Vacant Land map (183 Kb) - This map shows vacant land mapped in summer 1989. The land is organized in categories that describe the relationship between vacant properties and their immediate context. The categories are: Corner Lots (Orange), Missing Teeth (Purple), Lots Connecting Blocks (Light Blue), Swiss Cheese (Gray), Whole Blocks (Light Green), Multiple Contiguous Blocks (Red). |
 |
Vacant Land Cover (169 Kb) - This map shows the physical land cover -- pavement, bare soil, rubble, grass, trees -- of the open land shown in the Vacant Land map. It is based primarily on a field survey of vacant land conducted in summer 1989 and the Property Lines and Buildings map. The map was originally intended to be used to determine the relative amount of heat absorbed and re-radiated by ground and building surfaces and the amount of stormwater run-off or infiltration. |
 |
Ground Surface in Mill Creek (169 Kb) - To aid in a preliminary hydrological analysis, a detailed survey of ground surface conditions was conducted during the summer of 1996.
|
|
|
 |
Blocktypes: East/West (214 Kb)
There are ten basic block types in West Philadelphia: rowhouses with stoops; rowhouses with porches; rowhouses with tiny front yards; detached houses with yards; sides of houses; apartment blocks; rows of stores; large free-standing buildings; and a mixture of these types. There are variations within each block type; nevertheless, each type represents a specific environment with particular opportunities and limitations for change (see The West Philadelphia Landscape Plan: Shaping the Block.) Blocktypes are separated into those aligned east/west and north/south.
Blocktypes: North/South (217 Kb) |
|
|
|
 |
Sewers (215 Kb) - The sewer map shows the location of the main trunk sewer lines, as well as the smaller sewer lines down to the block level. Three sizes of sewage pipes are represented by different colors, line weights, and line styles. Most of West Philadelphia's storm drainage is carried by the Mill Creek sewer (in orange) which runs from Montgomery County to the north, through the middle of West Philadelphia andsouth to the Schuylkill River. The sewers carry combined sanitary and storm sewage. Many parts of this sewer line have caved in and been replaced since the original construction. |
 |
Sewershed Boundaries map (175 Kb) - Sewer "boundaries" refer to the delimitations of the sewersheds, the area drained by a particular network of combined sewers. |
 |
Sewer Department Grid (155 Kb) - The grid to the left is used by the Philadelphia Water Department in referencing its maps. The layout of the grid corresponds to that of the City Planning Commission, but the alphanumeric codes used are different.
|
|
|
 |
Topography: 2ft contours
The topography maps show contour lines at one, two, five, and ten-foot intervals. These lines are based on approximately four thousand street corner spot elevations digitized from Philadelphia City Streets Department and Water Department maps. They were interpolated using a road alignment and terrain modeling software called InRoads. Shown to the left are images of the 2ft contour interval (115 Kb) and 5ft contour interval (97 Kb) maps.
Topography: 5ft contours |
 |
 |
Digital Terrain Models (120 Kb)
|
|
|
 |
Hydrology: Mill Creek Watershed Boundary (137 Kb) - The West Philadelphia Landscape Project has focused on the Mill Creek watershed as because of the correlation between urban hydrology, vacant land, and damaged buildings and sidewalks. This watershed area comprises more than half of West Philadelphia. |
 |
Hydrology: Pre-urban (166 Kb) - This map shows ridgelines and course of streams prior to urbanization. Many streams once flowed across West Philadelphia. The largest of these was Mill Creek, a stream that drained nearly two-thirds of West Philadelphia. Its headwaters were in Lower Merion, and it flowed into the Schuylkill River south of Woodland Avenue near what is now 43rd Street. The Mill Creek cut a deep valley across parts of West Philadelphia and meandered and pooled in other areas. The large, grassy bowl in Clark Park was once a mill pond. In the late 1800s, Mill Creek was buried in city sewers. Its streambed was filled in and roads and houses were built on top, but it still flows in the sewer beneath city streets. |
 |
Hydrology: Low Points & Depressions (160 Kb) - The topography map was used to identify low spots within the watershed that are internally drained and which might therefore be prone to flooding and ground subsidence. These internally drained areas correlate closely with vacant lands. In some neighborhoods, most vacant land and vacant buildings are near these low points or along the current sewer alignment.
|
|
|
 |
Census Blocks(208 Kb) - This map shows the boundaries of tract, blockgroup and block boundaries used to reference U.S. Census data. Five other maps are derived from data from the U.S. Census of 1980 (the 1990 Census was not available during the original WPLP project). These maps include information on unemployment, income, racial/ethnic distribution, building vacancy rates, and population change from 1970 to 1980. The image to the left is from zooming in on the Walnut Hill and Garden Court neighborhoods.
|
|
|
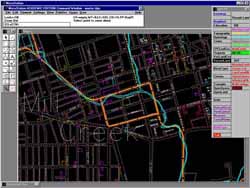
The Digital Atlas exists as a set of digital maps and a menuing system that allows overlay of the maps. They are currently stored as Microstation 5.0 (*.dgn vector) files in the Cartographic Modeling Lab of the Graduate School of Fine Arts. Microstation CAD software is a product of Bentley System's.
|