MITx
Projects made by MIT UROPs
Projects made by MIT UROPs
This applet helps students visualize the process of finding a line of best-fit by interactively minimizing the sum of least squares. For use in the MIT class 6.00 (Introduction to Computer Science and Programming) to understand least-squares algorithms.
<script src ="example-data.js"></script><script src ="work-data.js"></script><script src="https://ajax.googleapis.com/ajax/libs/jquery/1.10.1/jquery.min.js"></script><script src="https://ajax.googleapis.com/ajax/libs/jqueryui/1.10.3/jquery-ui.min.js"></script><script src="bootstrap/js/bootstrap.min.js"></script><script src="http://d3js.org/d3.v3.min.js" charset="utf-8"></script><link href="bootstrap/css/bootstrap.min.css" rel="stylesheet"><link rel="stylesheet" href="font-awesome/css/font-awesome.min.css"><link href="line-fitter.css" rel="stylesheet"><link rel="stylesheet" href="http://code.jquery.com/ui/1.10.3/themes/smoothness/jquery-ui.css" /><script src="line-fitter.js"></script><div class="line-fit"></div><script src="https://ajax.googleapis.com/ajax/libs/jquery/1.10.1/jquery.min.js"></script>If you want modify the width and height, simply change the width and height accordingly
...class = "line-fitter" style = "width: ; height: ;"
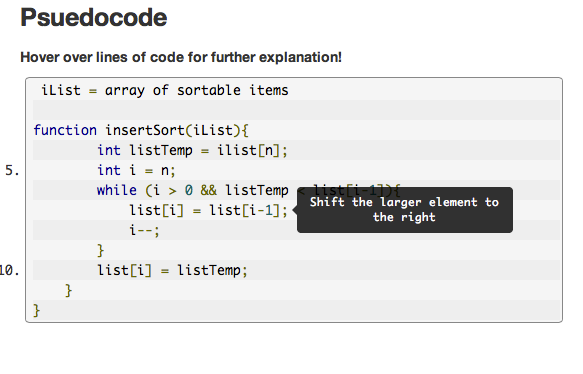
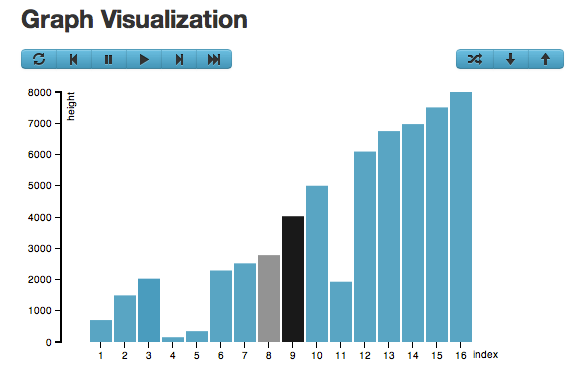
This webpage allows students to grasp an intuitive sense of the bubble and insert sort by using the interactive visualization of the sorts and understanding the commented pseudocode for the corresponding graph. Students can control the progression of the visualization sort to make sure they understand what is happening at each step of the sort.
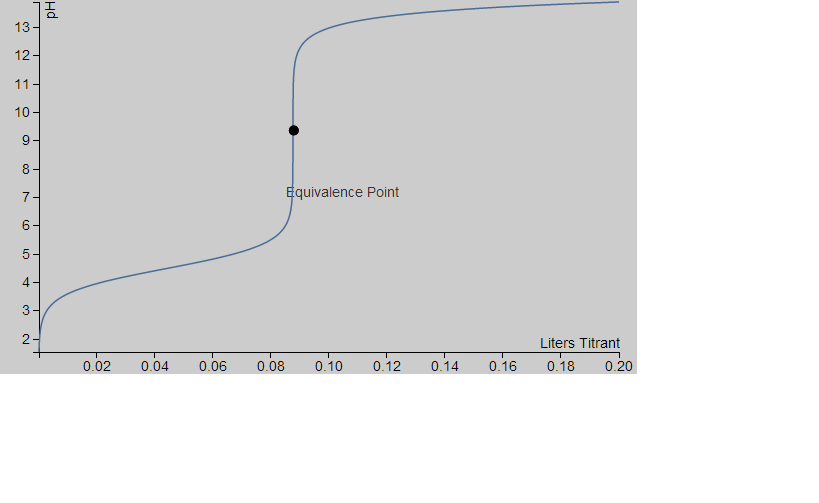
This applet allows students to simulate acid-base titrations and view the resulting titration curves, while circumventing the need for lab time, supplies, and supervision. Students can also change the variables of the experiment - the strength of the acids used, the concentration of titrant, and the amount of analyte - in real time, and observe how each variable affects the final titration curve.
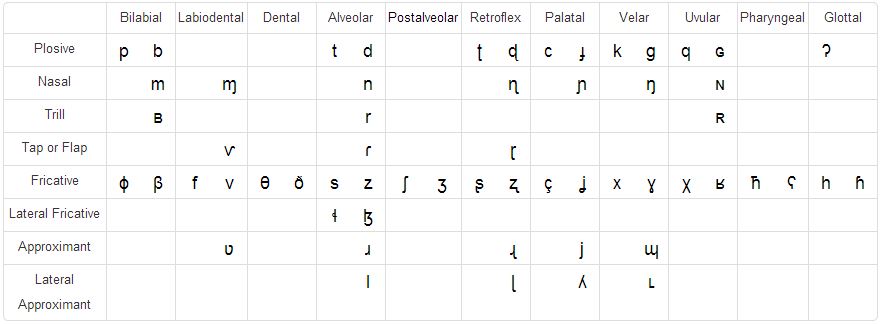
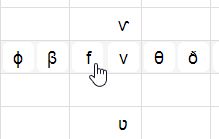
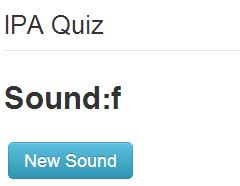
This applet has various tools that can greatly assist students in learning the International Phonetic Alphabet. The applet comes packaged with various tools, including a converter, various reference tables, and a quiz widget. Each widget can interact with the other when put on the same page, so the applet is most effective with all the tools combined.
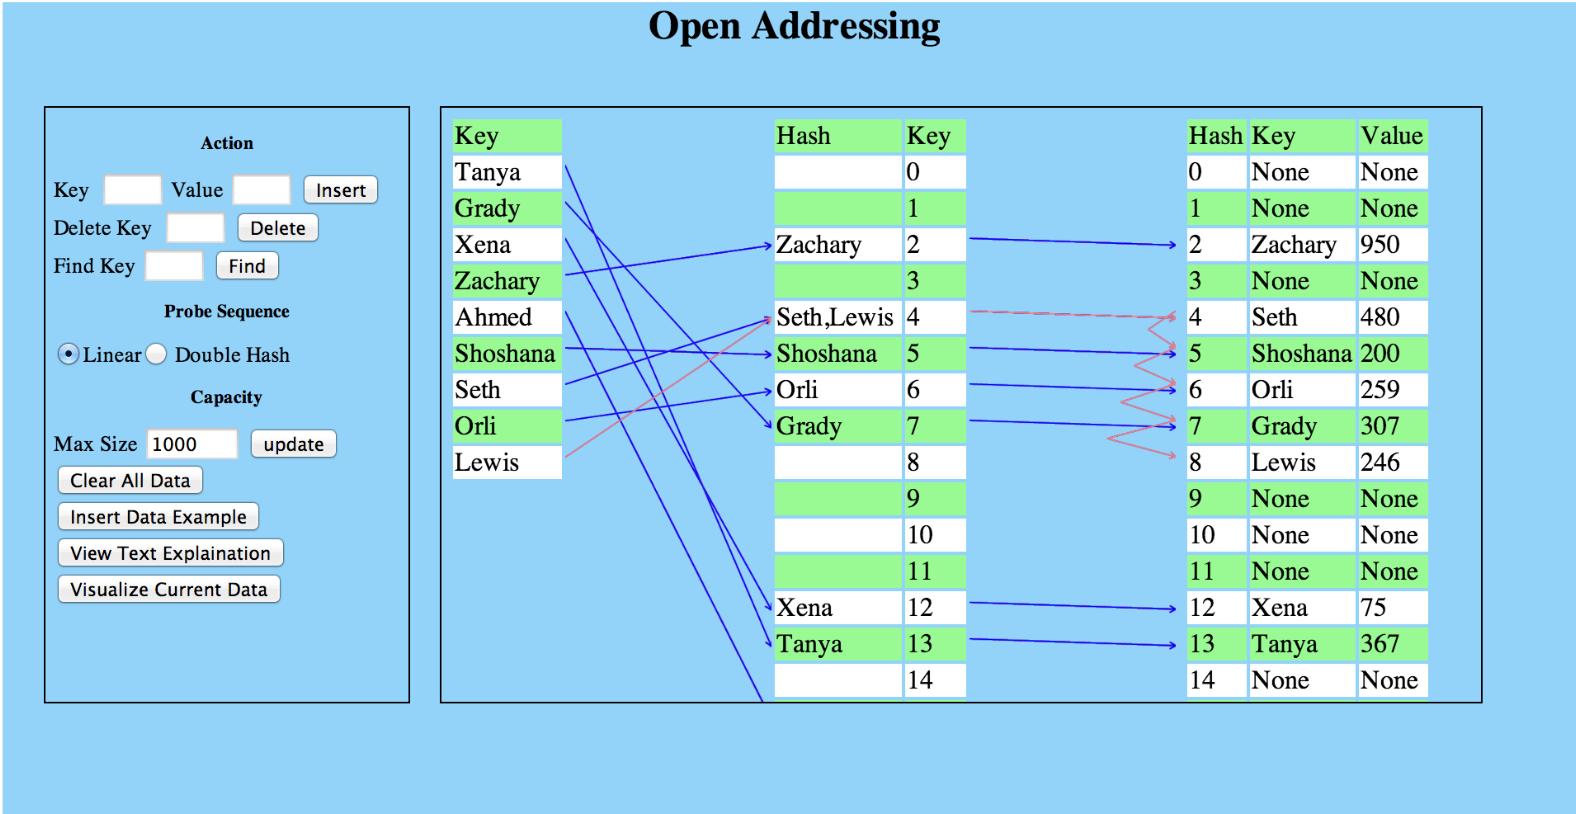
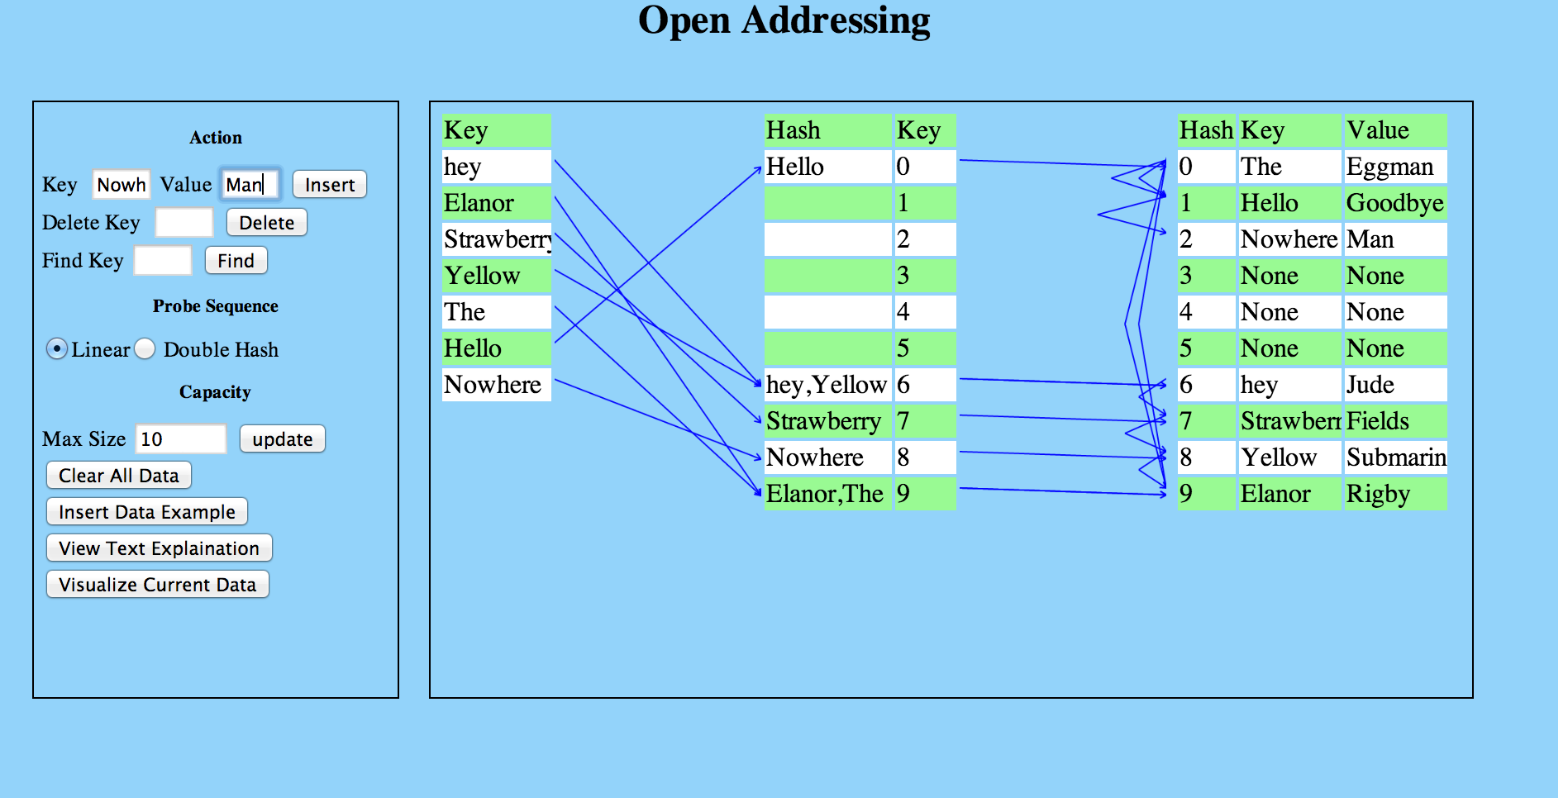
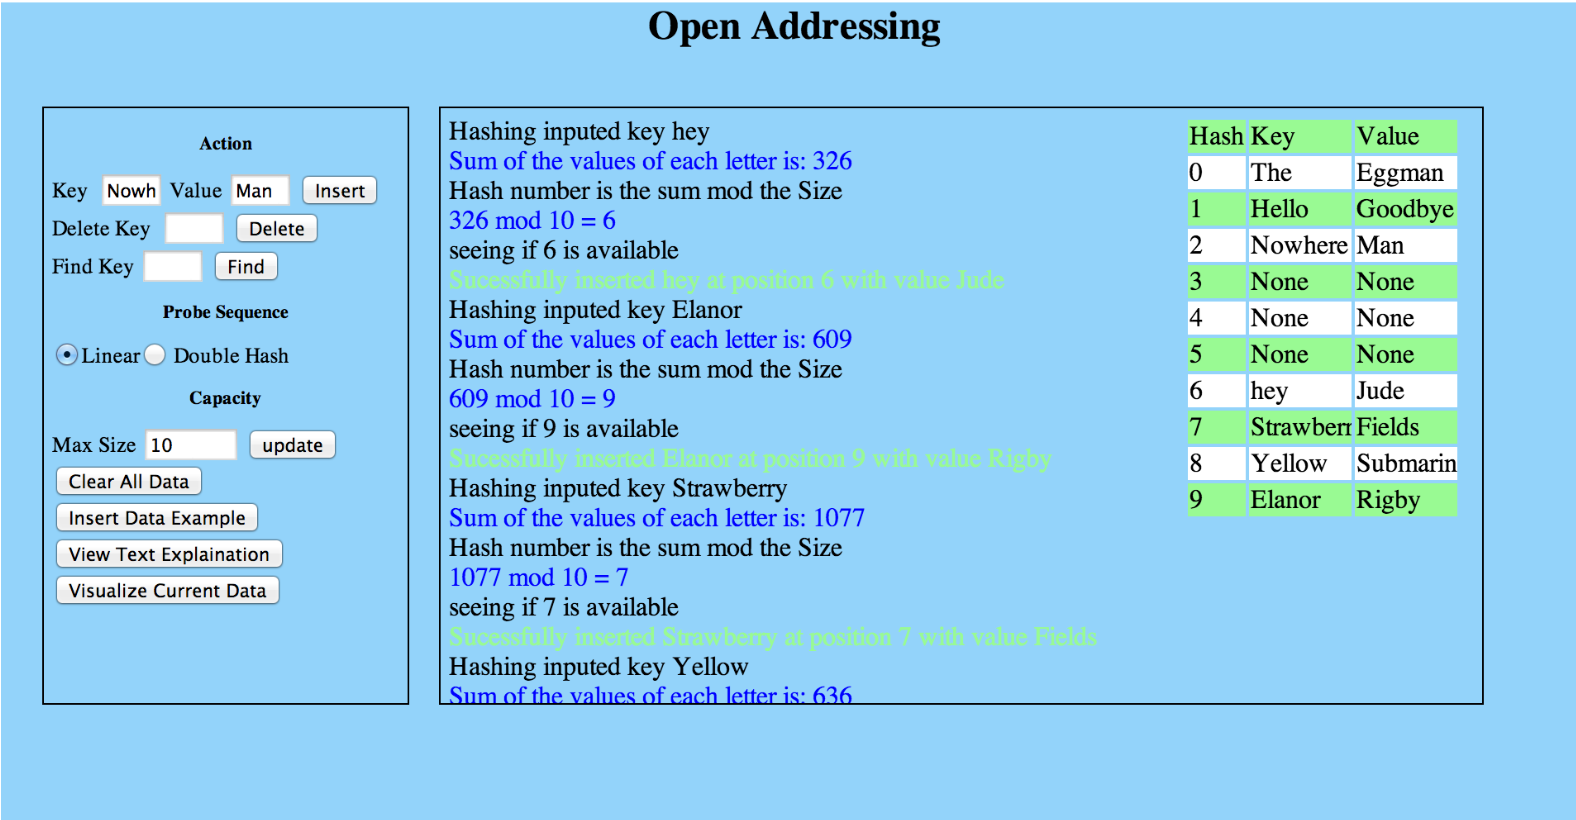
This tool is designed to visualize the process of hashing and Open addressing. It enables the user to visualize the data they themselves insert,delete,and find and visualize how pre-loaded data is placed into a hash table. There is also a written explanation for the process, if the user is a textual learner.
A visual representation and interactive simulation for State Machines, as covered in MIT's 6.01 (Intro to EECS) course, otherwise known as LTI (linear time-invariant) systems. Students can create, save, and simulate state machines with Gain, Delay, and Adder components.
<script src="https://ajax.googleapis.com/ajax/libs/jquery/1.10.1/jquery.min.js"></script>
<script src="https://ajax.googleapis.com/ajax/libs/jqueryui/1.10.3/jquery-ui.min.js"></script>
<script type="text/javascript" src="http://web.mit.edu/lu16j/www/state/jsPlumb.js "></script>
<script src="http://code.highcharts.com/highcharts.js"></script>
<script src="http://code.highcharts.com/modules/exporting.js"></script>
<script src="http://web.mit.edu/lu16j/www/boots/bootstrap/js/bootstrap.min.js"></script>
<link href="http://web.mit.edu/lu16j/www/boots/bootstrap/css/bootstrap.min.css" rel="stylesheet">
<script src="http://web.mit.edu/6.mitx/www/6.01-statemachine/definitions.js"></script>
<script src="http://web.mit.edu/6.mitx/www/6.01-statemachine/mvc.js"></script>
<link href="http://web.mit.edu/6.mitx/www/6.01-statemachine/mvc.css" rel="stylesheet">
<div class="statemachine" style="width:1000px"></div>
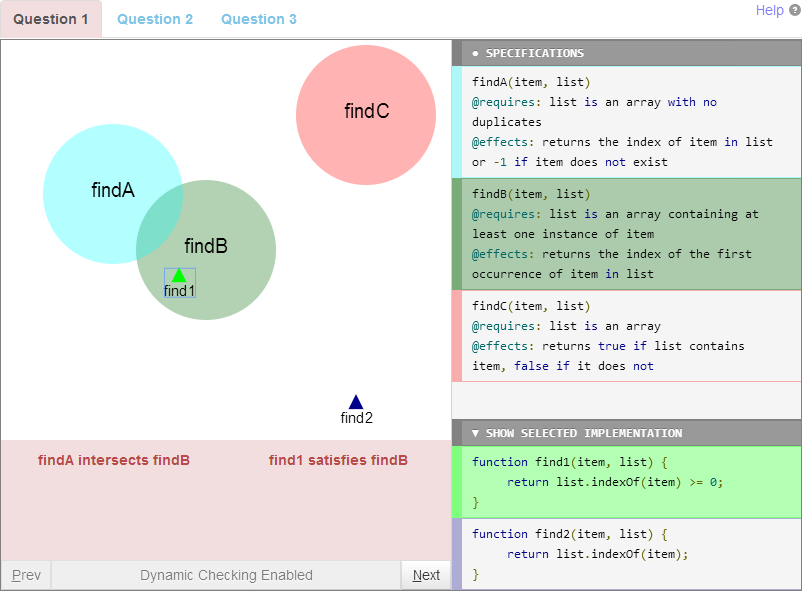
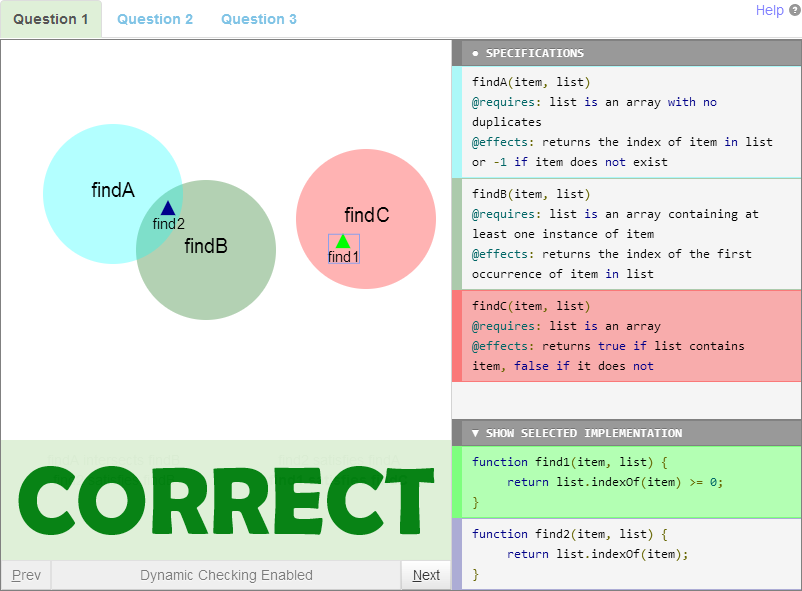
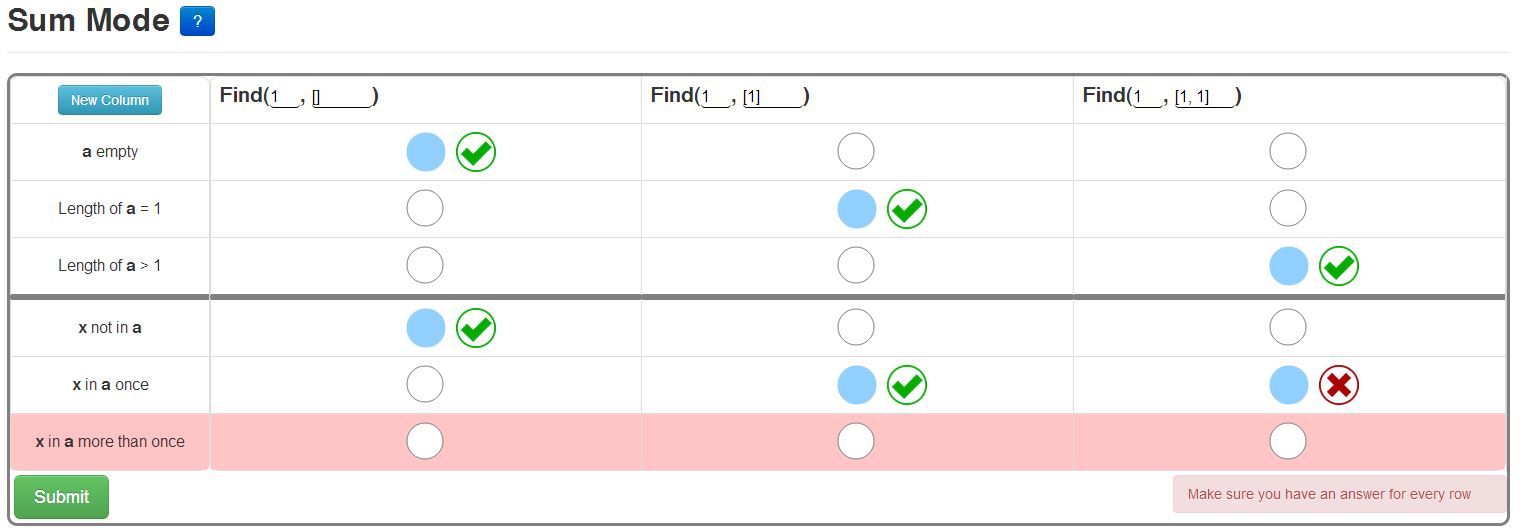
An exercise intended for students to gain intuition for writing good specifications, through interacting with an abstract visual representation of specs and impls.
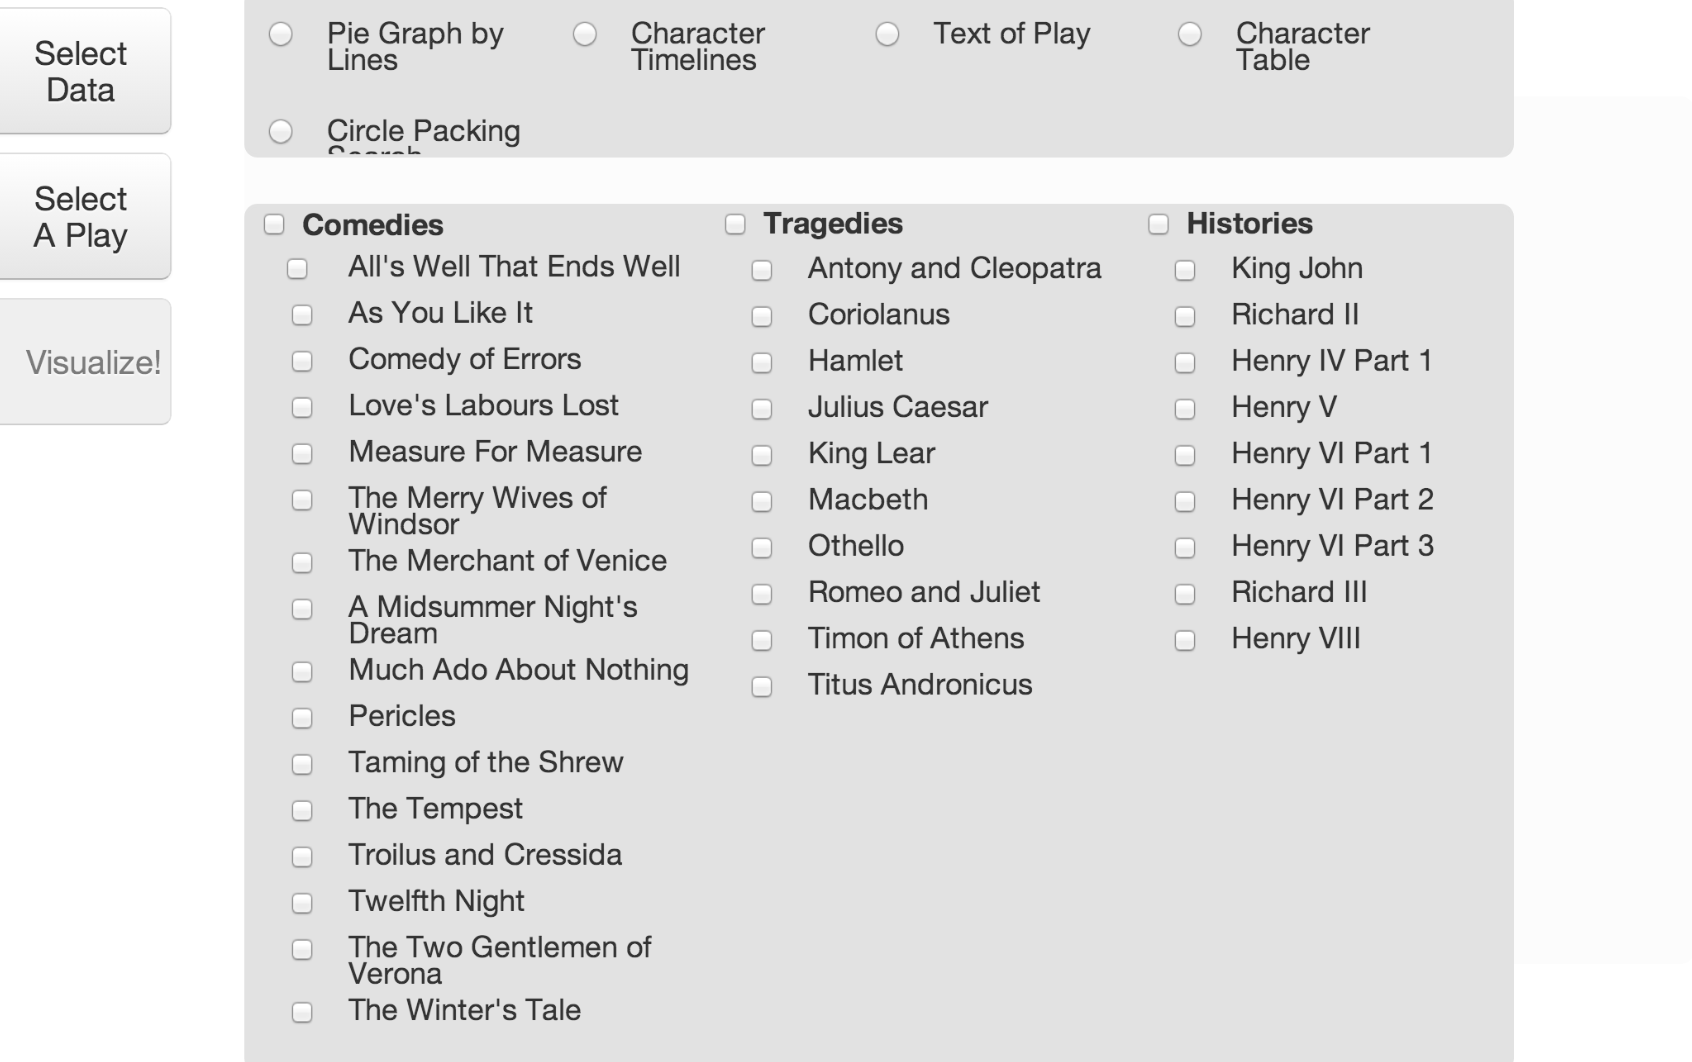
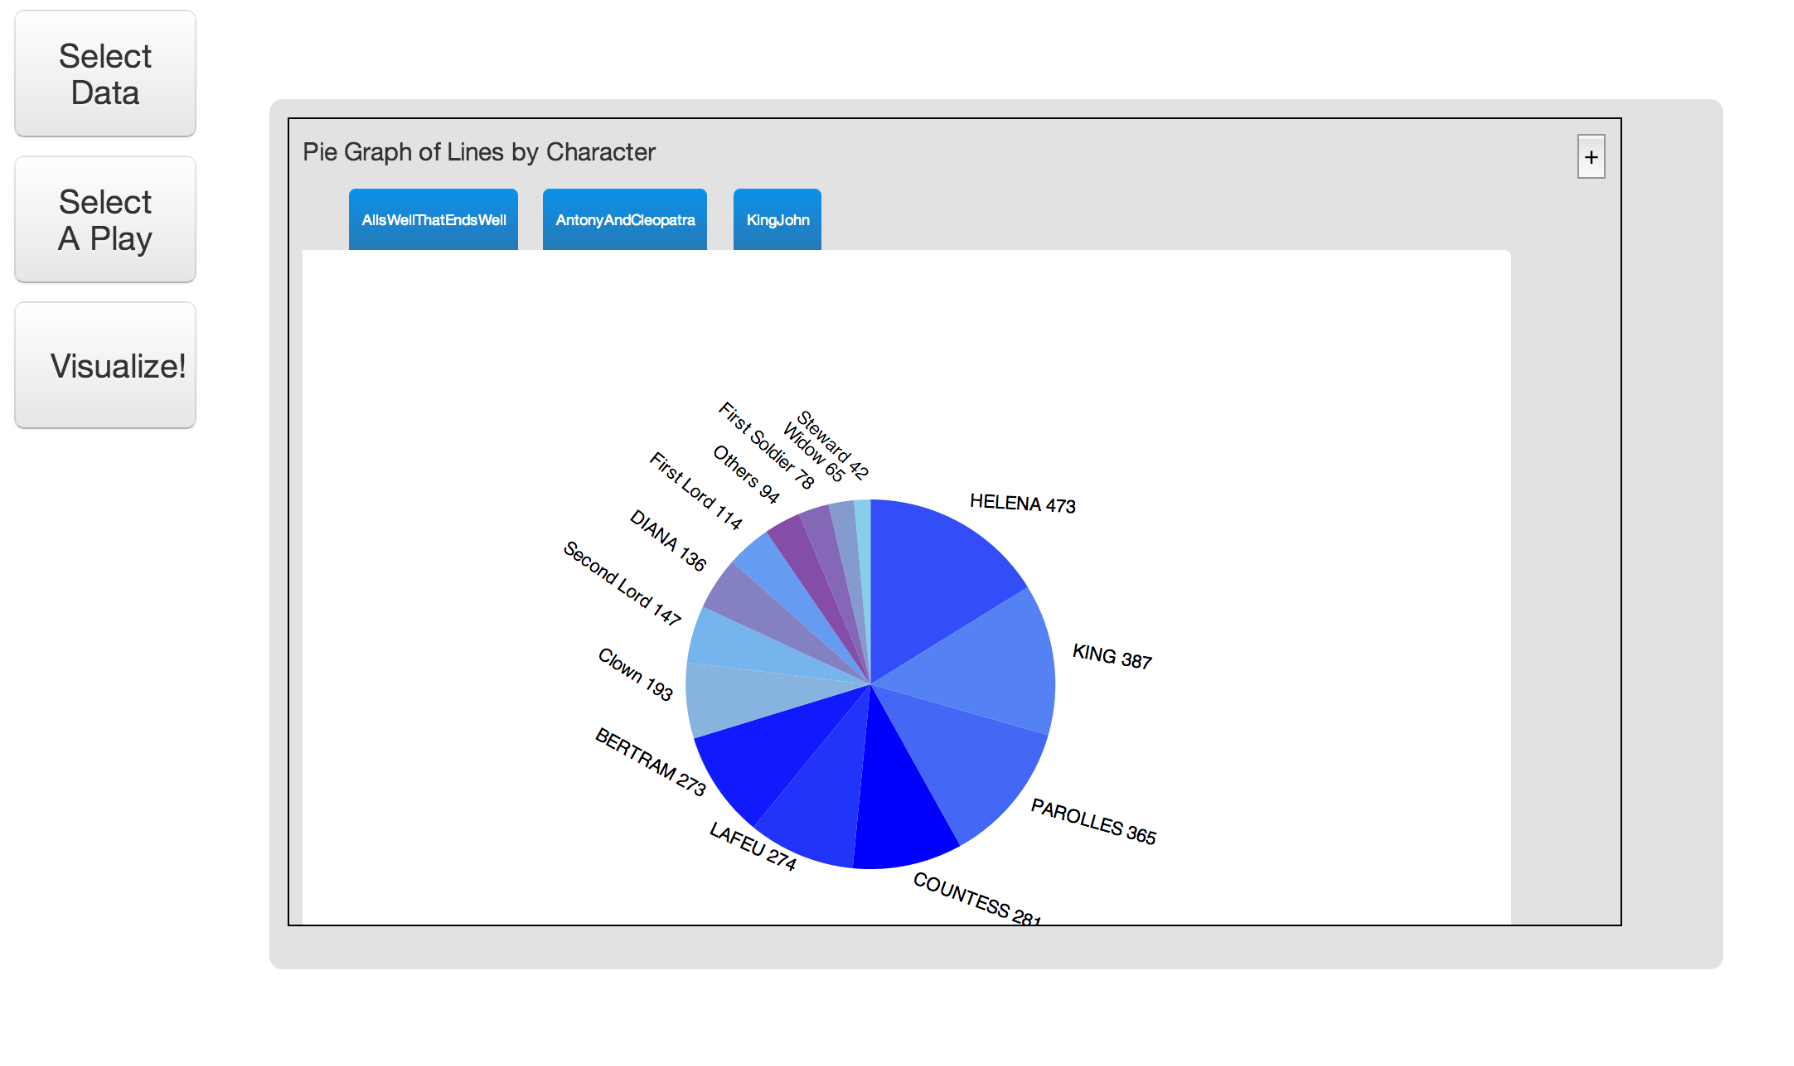
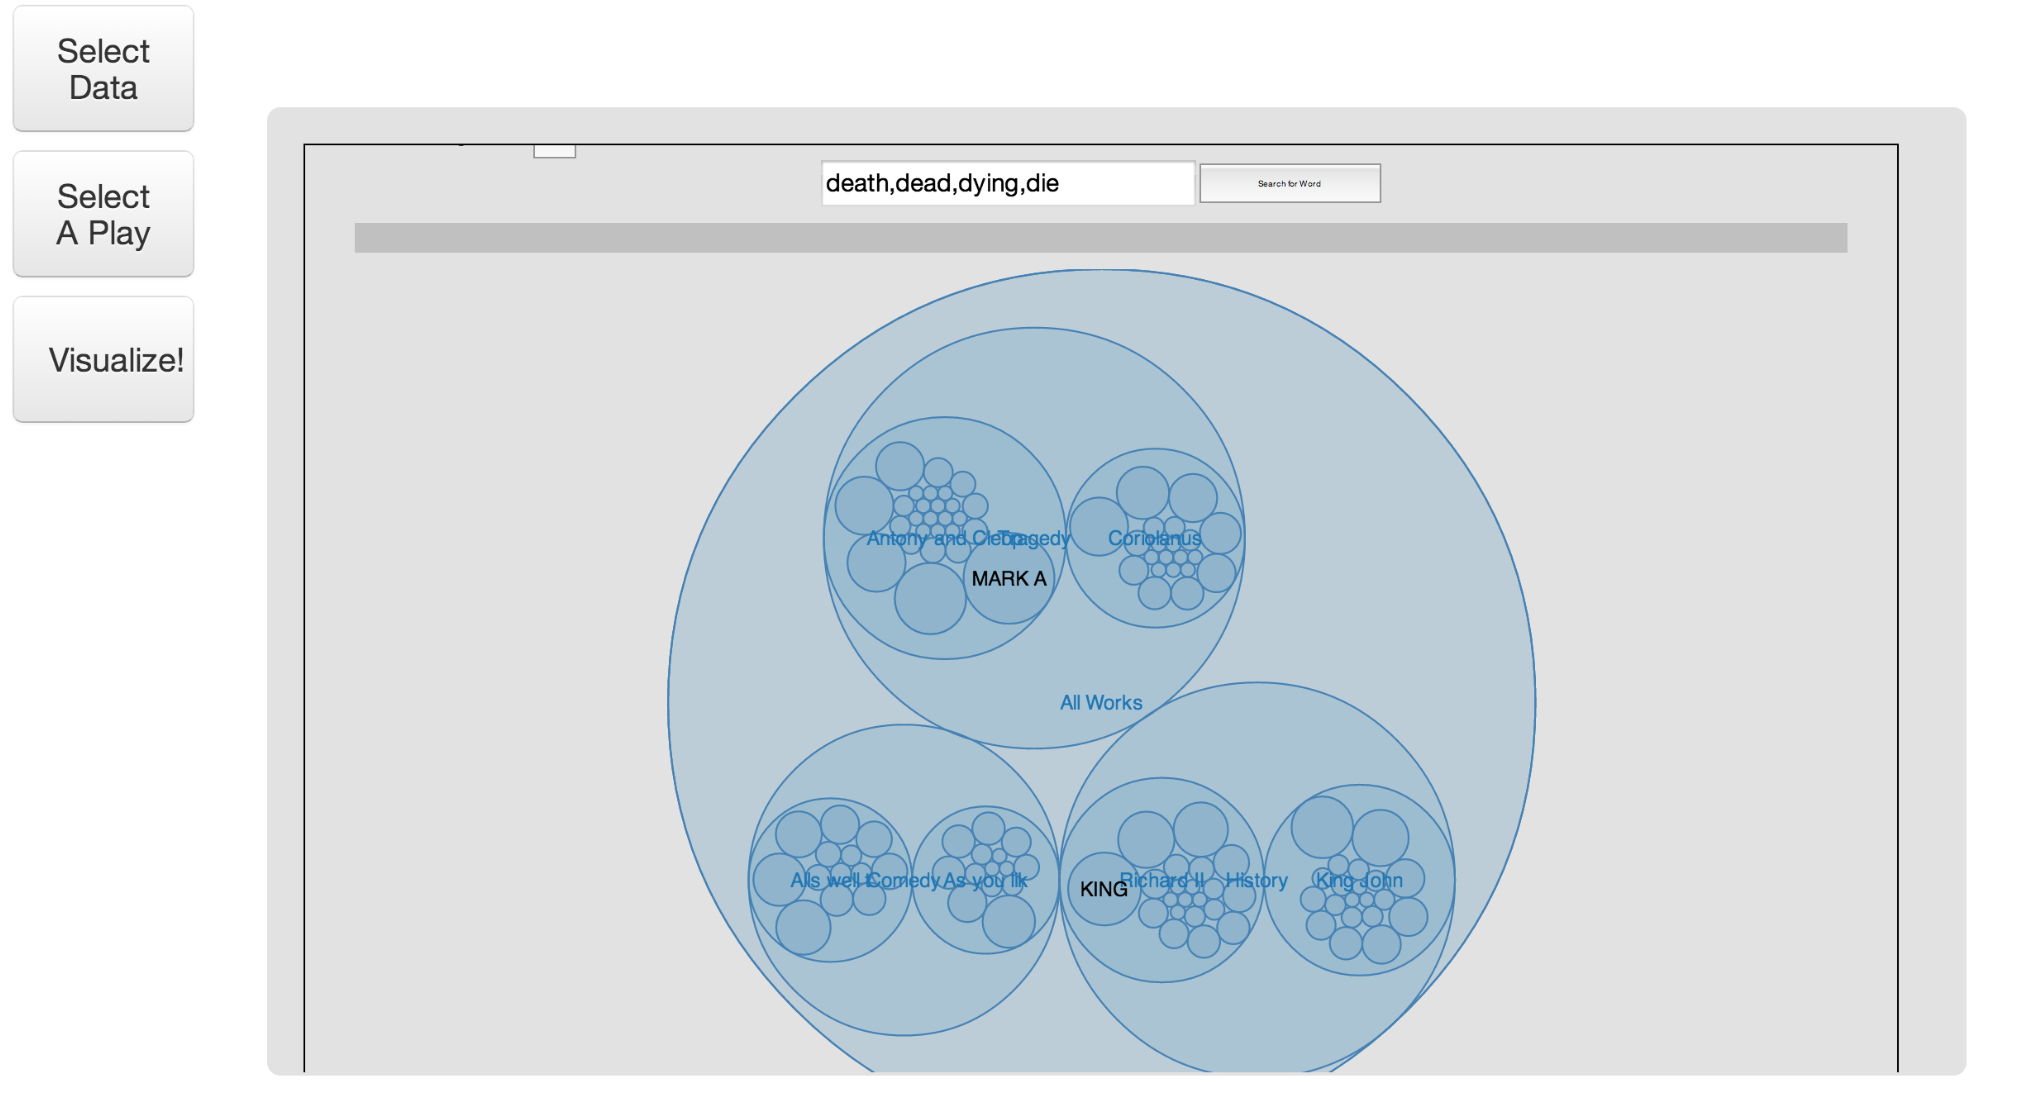
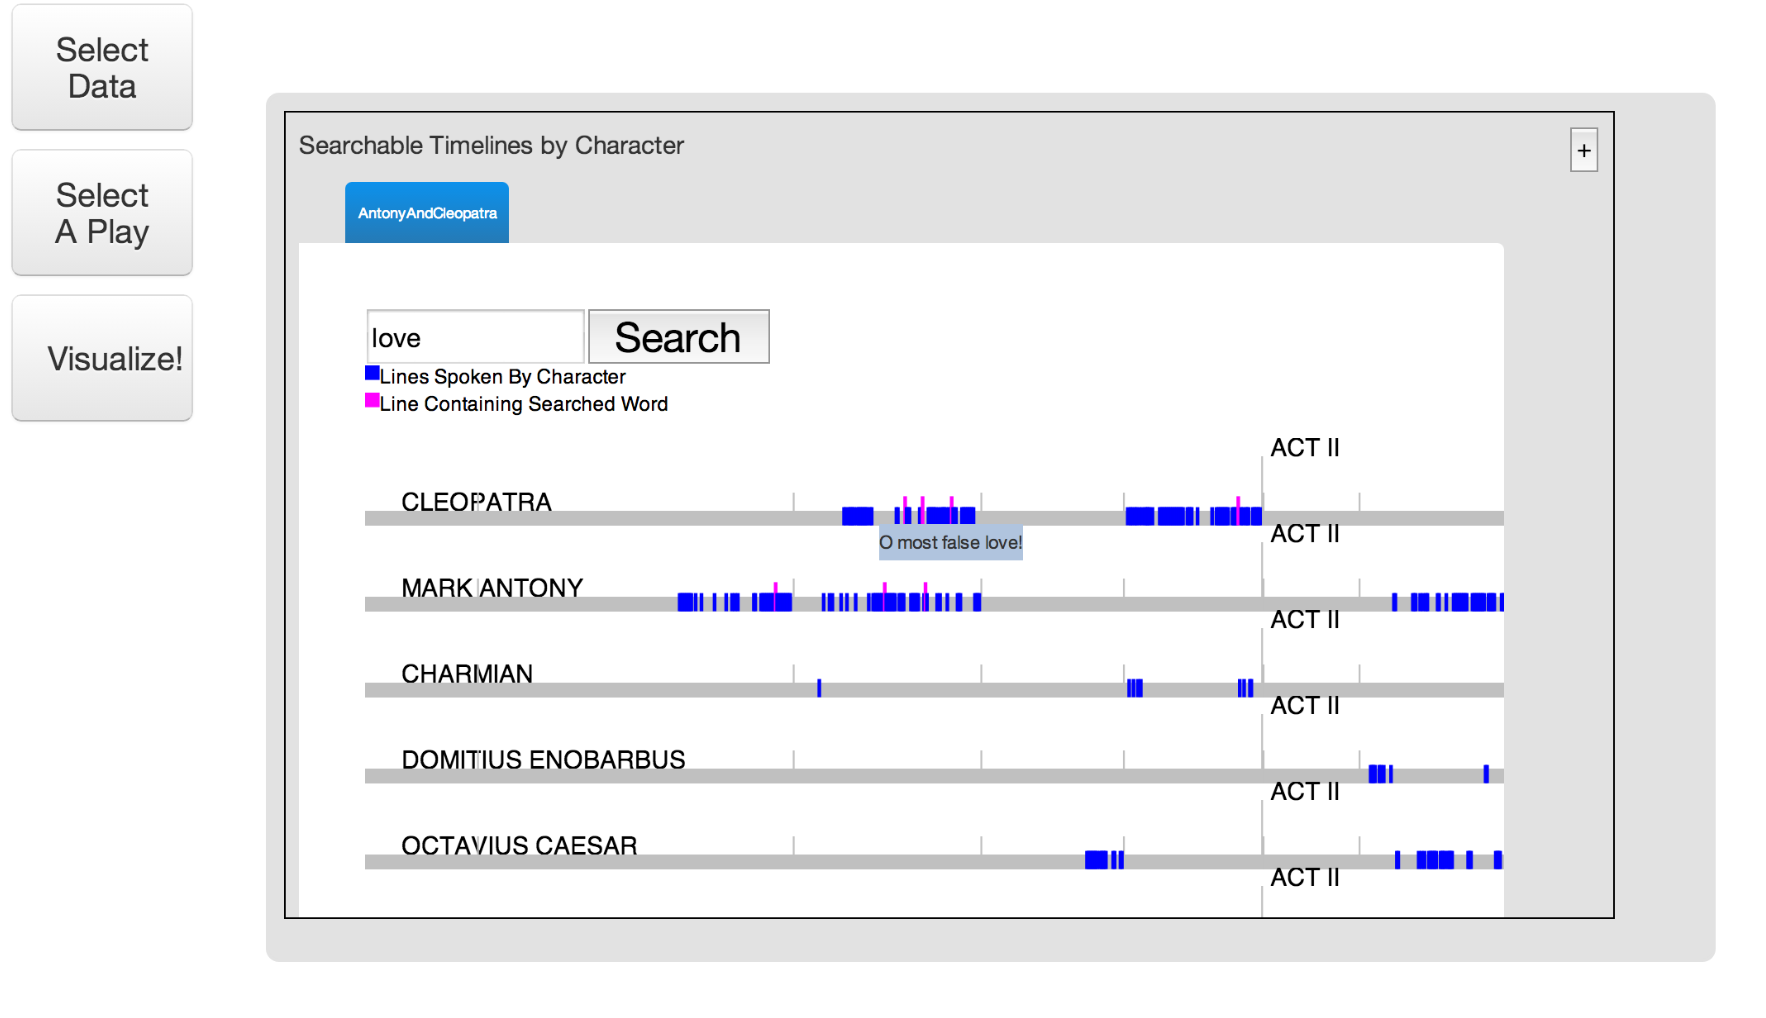
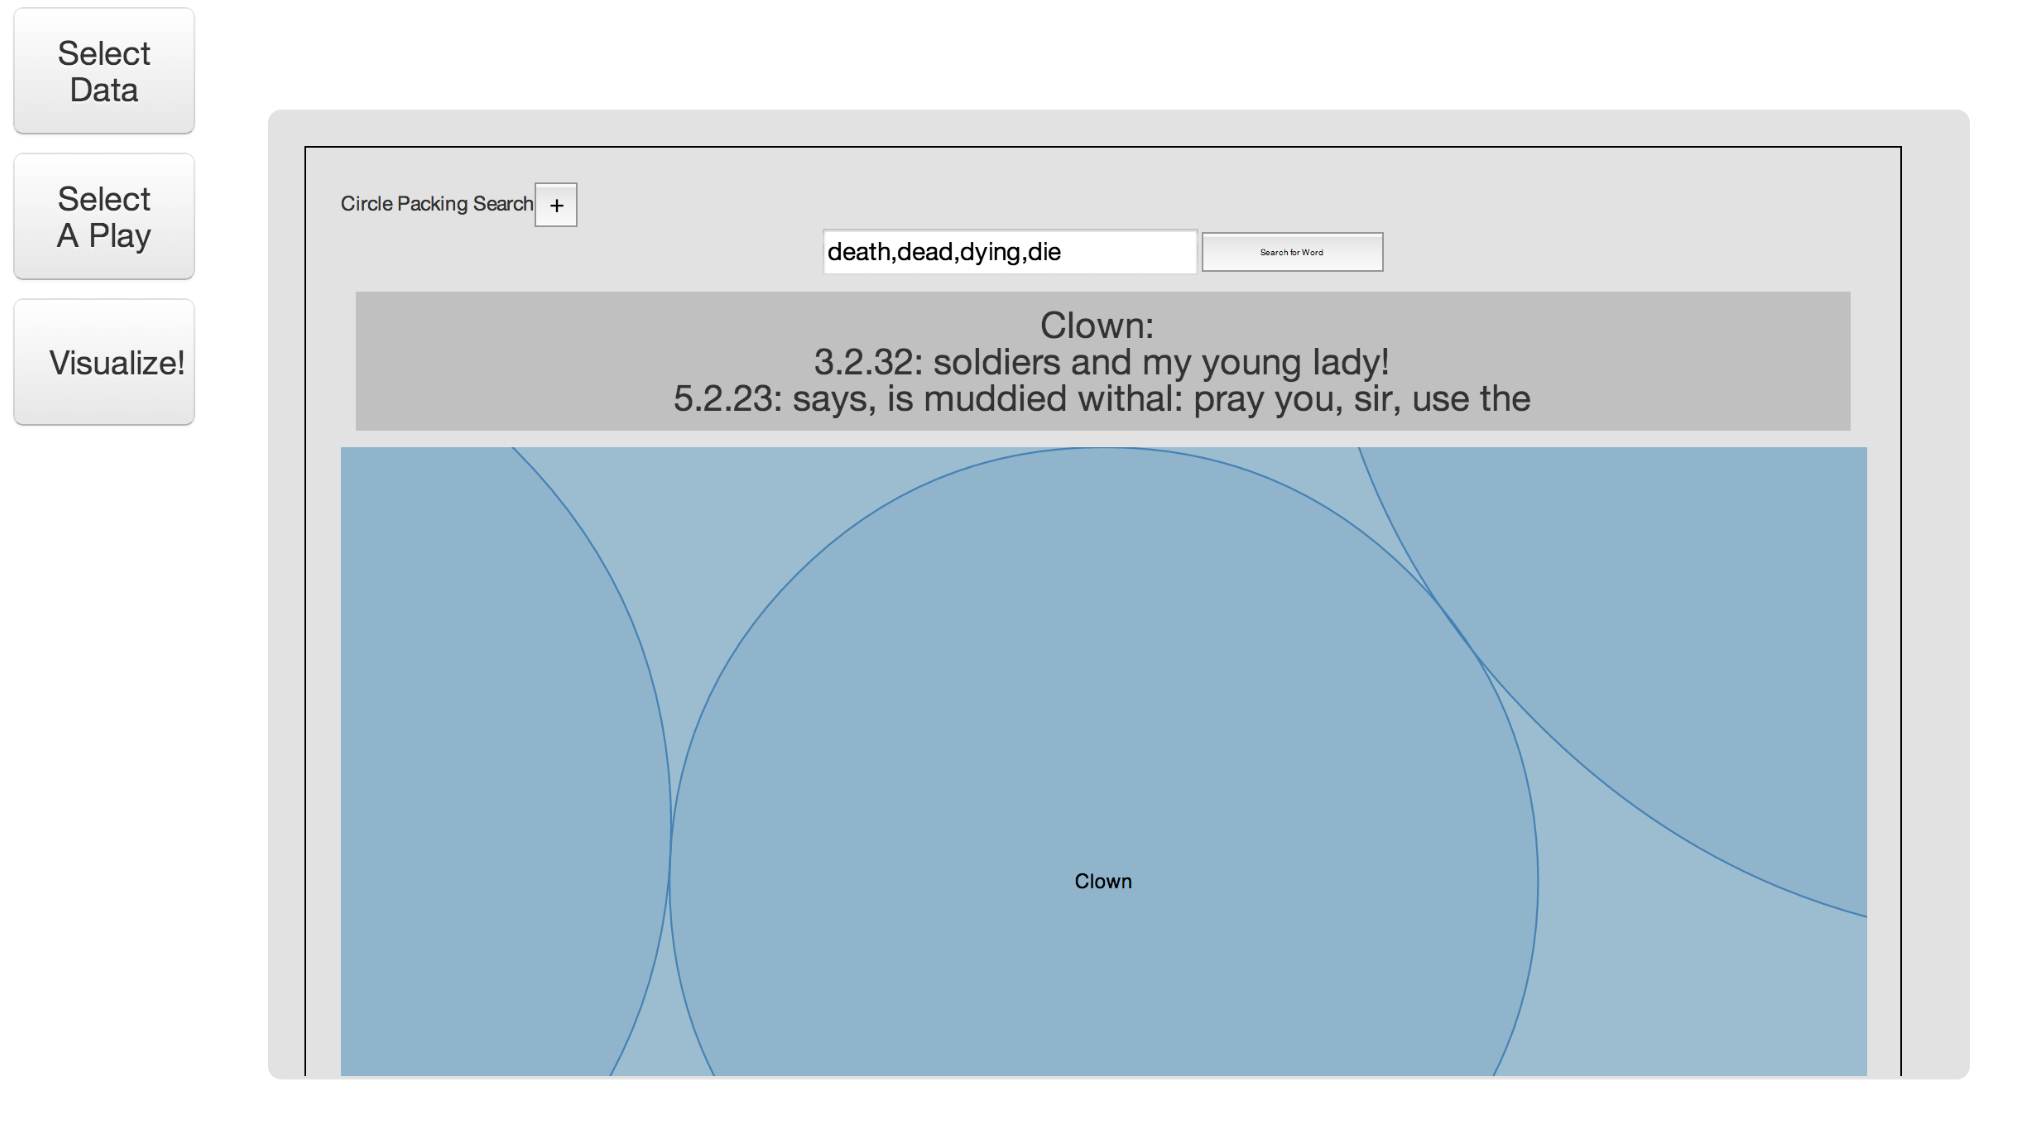
This tool is designed to offer a data visualization tool for the works of William Shakespeare. The goal is to allow students, readers, and actors to understand aspects of Shakespeare's work (such as character line distribution, word distribution, etc.) through intuitive, customizable, easy to use graphs and charts. This project focuses primarily on being able to search through specified texts for words that correlate to a certain image. For example, a student would be able to search for all the occurences of the words 'moon','lunar','cycles','wane','wax','crescent' and see the distribution of words by charachter and play.

A series of exercises that enable the student to get a better grasp on what JUnit Testing is, and how to use it properly. Using 3 different exercises, students get a more visual sense of JUnit Testing than they do in the classroom.

This application aims to make web design analysis and comparison easier and more interactive. It allows students and instructors view and dynamically interact with miniature versions of multiple websites at once. Users can make and share collecitons of websites, view comments, and filter websites by categories of the instructors choosing.
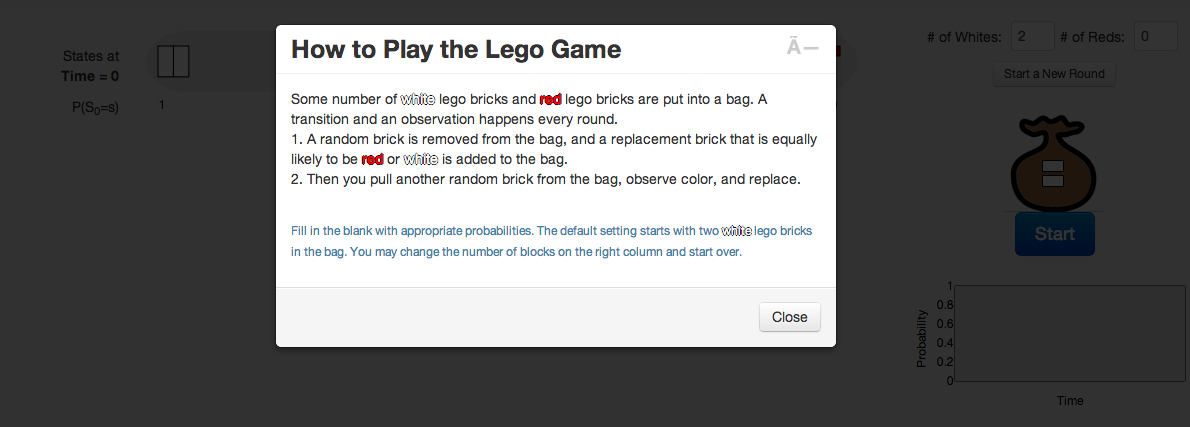
This applet, using a particular lego game example, helps students visualize how a Markov chain transitions the probability distribution of each state in discrete time. It also helps students to understand the application of Bayes' Theorem in updating the probability distribution. For use in the MIT class 6.01(Introducation to Electrical Engineering and Computer Science) to understand Markov chain and Bayes' Theorem.

This visualization charts edX student activity over the entire course. Two charts are shown - one charts the number of problem attempts from all students in the course per hour and the other charts the number of minutes of video that students watched per hour. These two charts can be filtered by student grade.
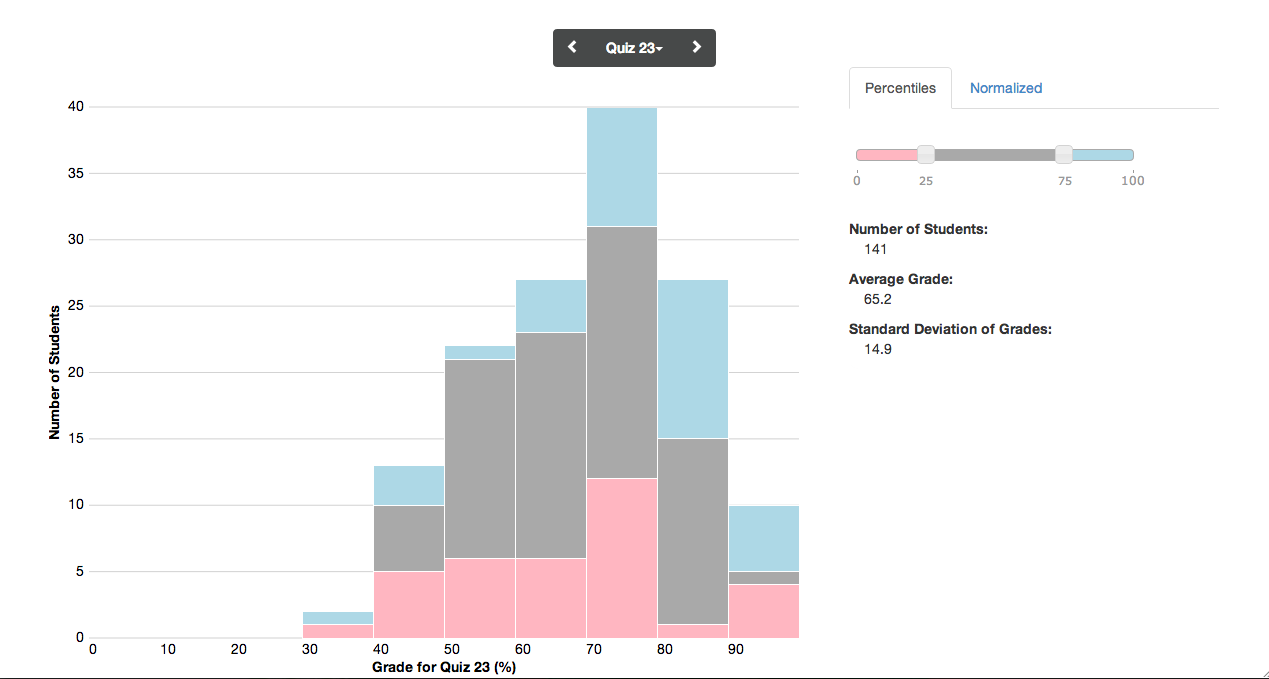
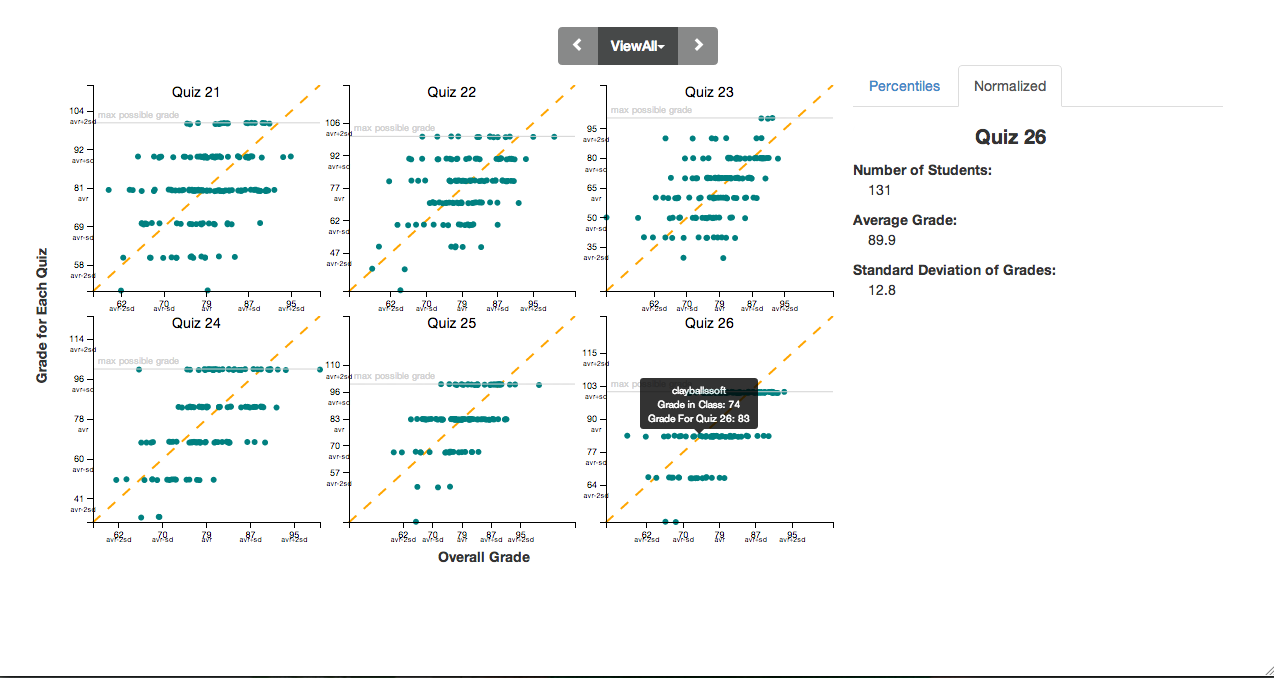
This visualization not only shows the edX students' grade distribution on the assignments, but also compares each student's performance on an assignment to his/her general performance throughout the entire course.
The first demo plots the grade distribution for regular types of assignments, while the second demo plots for mastery-driven questions where students are allowed multiple attempts until they get it correct.
This visualization was created by MIT students Kate Roe, Laura Breiman, and Marissa Stephens for the 2013 edX course Science and Cooking: From Haute Cuisine to Soft Matter Science. It demonstrates the heat diffusion through meat over time.
The temperatures for the different stages of protein denaturization come from Harold McGee's On Food and Cooking: The Science and Lore of the Kitchen (pages 152 and 210). It is important to note, however, that these temperatures are estimates and not completely universal. This simulation is not a perfect model for cooking actual meat. Stove temperatures, pan types, and meat consistency are variable from case to case. Please be certain to check that your meat is thoroughly cooked before consumption unless you enjoy getting food posioning.


A video annotation prototype for MIT's NB website (nb.mit.edu), a current online annotation tool for classes to highlight and start discussions on PDFs.
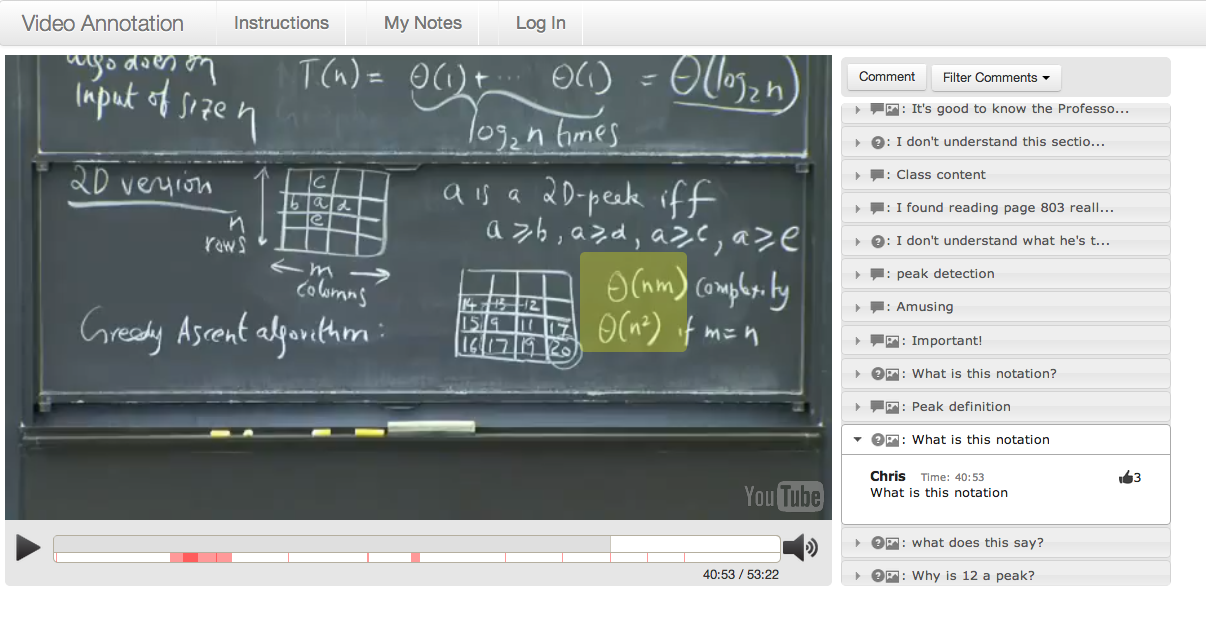
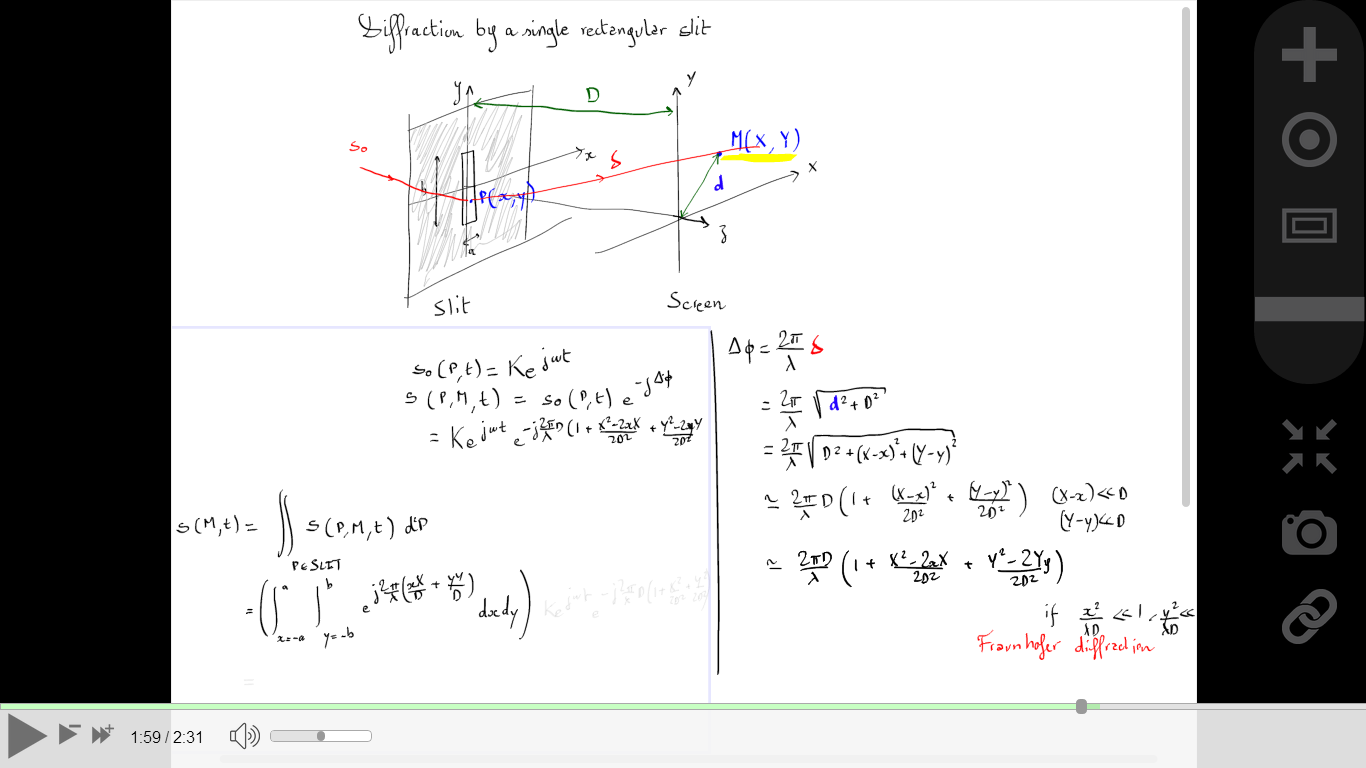
An interactive HTML "video" player for lectures created by Prof. Durand's Pentimento software.
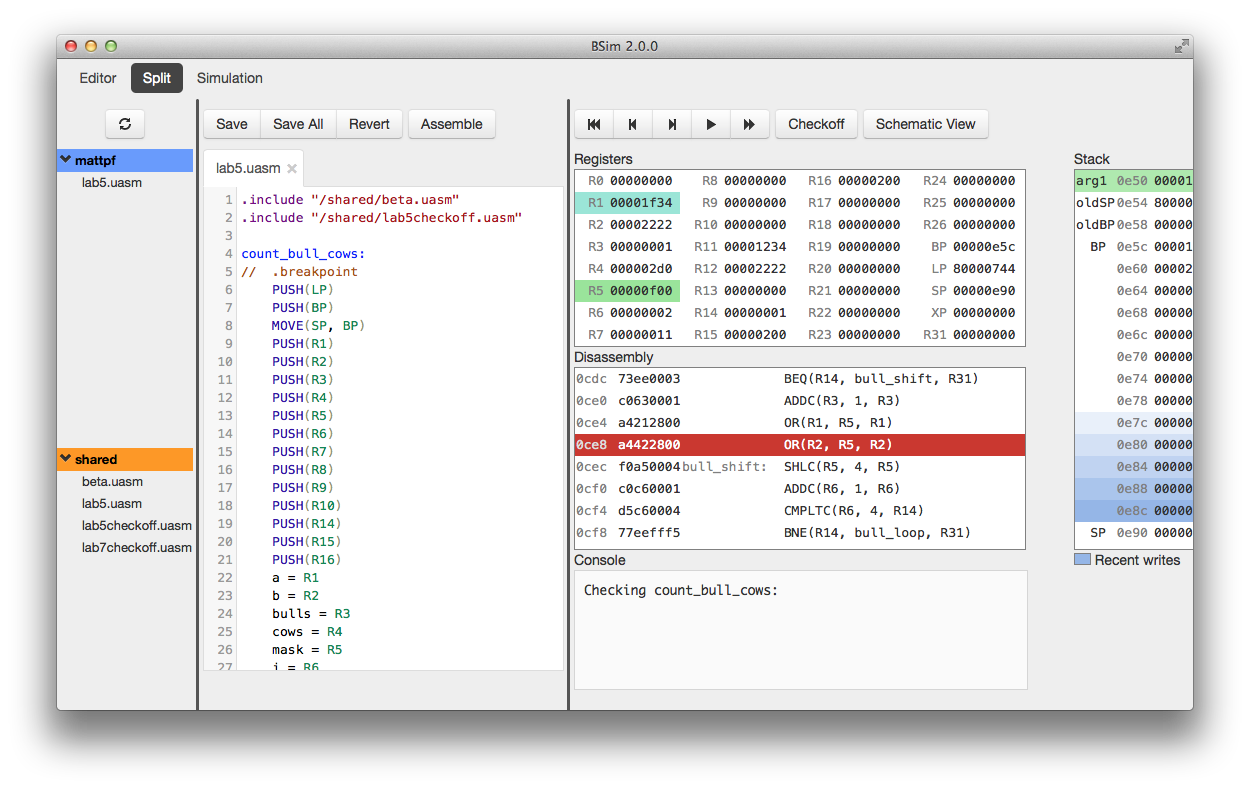
6.004x students will need to run the lab tools from their browser. The goal of this project was to rewrite the existing Java-based tools to run in the browser. We created a cloud-based persistance storage service for student files, a common editor (based on CodeMirror) with appropriate syntax highlighting for each tool, and the three tools themselves: JSim, a device- and gate-level circuit simulator; BSim, an assembler and emulator for 6.004's processor; and TMSim, a finite state machine and Turing Machine simulator.