Homepage
Enhancing the commercial real estate industry through financial, social, and environmental performance and responsibility.
Celebrating 40 Years of Real Estate Education at MIT
For four decades, the Center has made strides in advancing the field of real estate and fostering a global network of over 1,400 alumni. Join our celebration and share your support!
Celebrating 40 YearsEducation
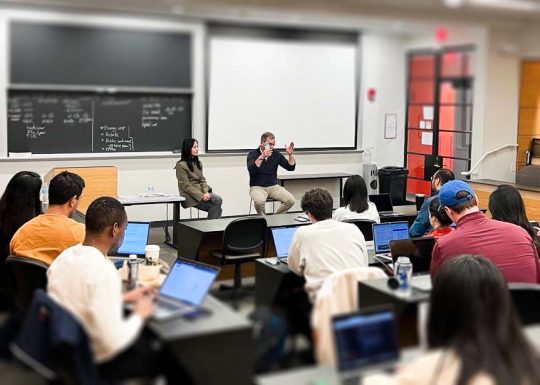
Master of Science in Real Estate Development
Leverages technical expertise, practical applications, and MIT's entreprenuerial ecosystem to educate the next generation of global innovators and leaders in the real estate industry.
Master's Program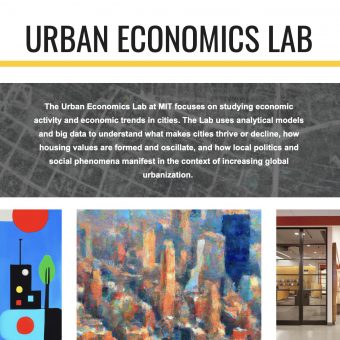
Urban Economics Lab
Featured Lab
How do economic trends and activity shape cities? How does the city form and shift housing values?

Autonomous Vehicles and Real Estate
Transportation has shaped cities as we know them – how will autonomous vehicles change our cities? How can policy and market forces foster mobility innovation?
Quantifying the Impacts of Climate Shocks in Commercial Real Estate Market | Journal of Regional Science
Industry
Our Impact
We work closely with our partners to unlock potential within the real estate industry in ways of efficiency, profitability, and social and economic responsibility. Ready to partner with the CRE?