This preliminary evaluation of the nature and extent of arsenic and other inorganic chemicals in groundwater is based on the limited number of samples that could be collected during our three-week field program. Samples were collected from only 600 of 2,500,000 tubewells in 120 of 68,000 villages; therefore, more extensive studies are required to support or disprove the hypotheses presented in this article.
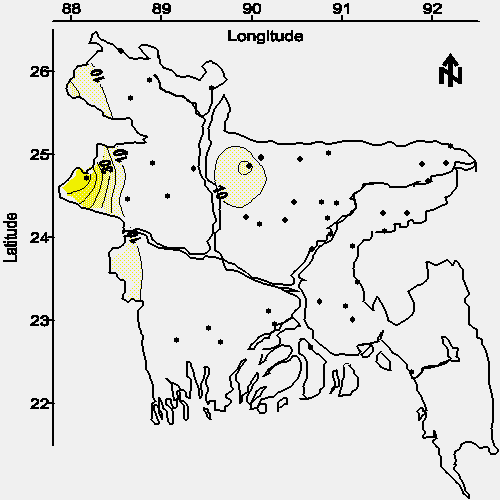
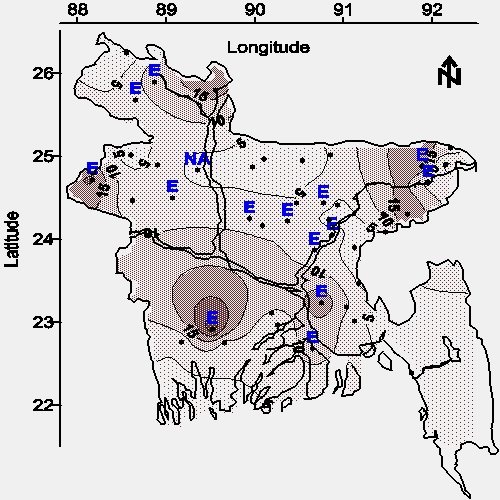
The concentrations of various inorganic chemicals throughout Bangladesh were mapped to identify areas impacted by arsenic and other toxins, to determine the potential source of arsenic, and to identify possible water treatment requirements. Contour maps of chemical concentration show the aerial extent of arsenic, chloride, phosphate, sulfide, sulfate, and total iron in groundwater (see Figures 2, 3, 6, 7, 8, 9, 10, and 13). These contour maps were drawn using the average chemical concentration in tubewell water from each village, unless otherwise stated (recall that 4 to 6 tubewells per village were sampled). The vertical distribution of arsenic was evaluated by separating samples collected from "shallow" and "deep" tubewells. Shallow tubewells were arbitrarily assigned a depth less than 30.5 m (100 feet) bgs, and deep tubewells were arbitrarily assigned a depth greater than 30.5 m (100 feet) bgs. This separated the samples into two groups with each group containing approximately 300 samples.
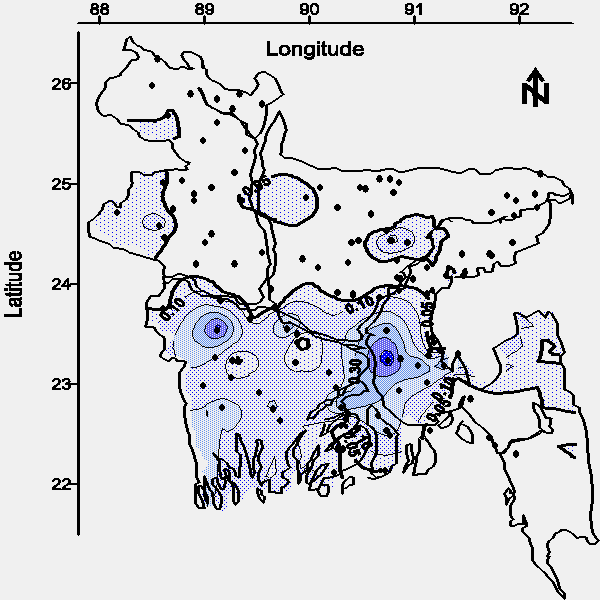
The contour maps of average arsenic concentration in water from shallow and deep tubewells are shown in Figures 2 and 3, respectively. The detection limit for the arsenic method was 0.028 mg/L (defined as the concentration of the most dilute standard used for calibration); therefore, quantitation to the WHO drinking water standard of 0.01 mg/L was not attempted and these contour maps are based on the Bangladesh drinking water standard of 0.05 mg/L. Approximately 50% of the aerial extent of Bangladesh contains groundwater from shallow tubewells with an average arsenic concentration greater than the national drinking water standard (see Figure 2).
 |
| Figure 2. Map of the average arsenic concentration (mg/L) in water from tubewells less than 30.5 m or 100 feet bgs (· = village location). |
Approximately 32% of the aerial extent of Bangladesh contains groundwater from deep tubewells with an average arsenic concentration greater than the national drinking water standard (see Figure 3).
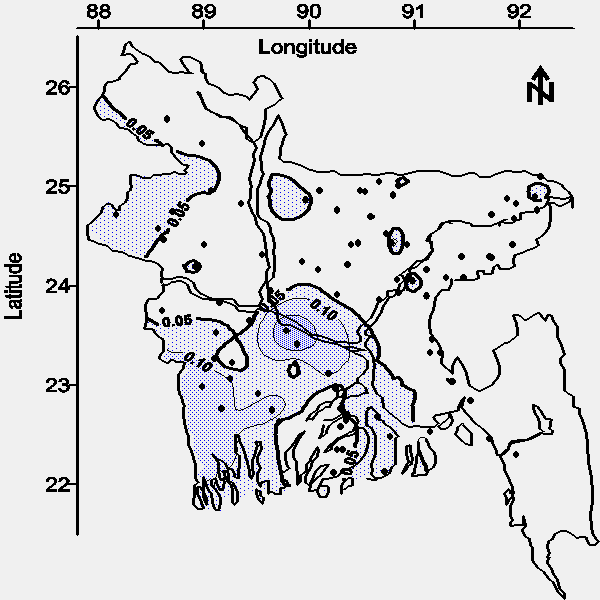 |
| Figure 3. Map of the average arsenic concentration (mg/L) in water from tubewells greater than 30.5 m (100 feet) bgs. |
Arsenic was detected in wells ranging from 7.9 m (26 feet) to 315 m (1035 feet) bgs (see Figure 4).
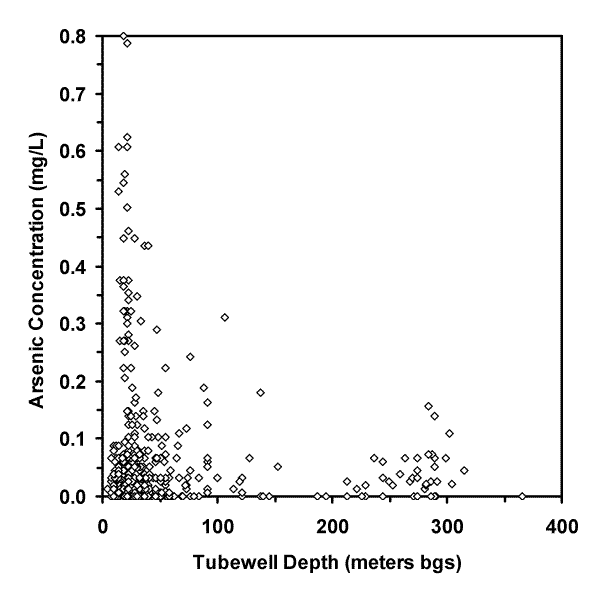 |
| Figure 4. Graph of arsenic concentration (mg/L) versus tubewell depth (meters below ground surface, bgs). |
The comparison of 10 adjacent pairs (< 100 m or < 328 feet apart) of "very deep" (67.1 to 290 m bgs or 220 to 950 feet bgs) and shallow (< 30.5 m or < 100 feet bgs) tubewells shown in Figure 5 suggests the source of arsenic is hundreds of feet thick in many areas of Bangladesh.
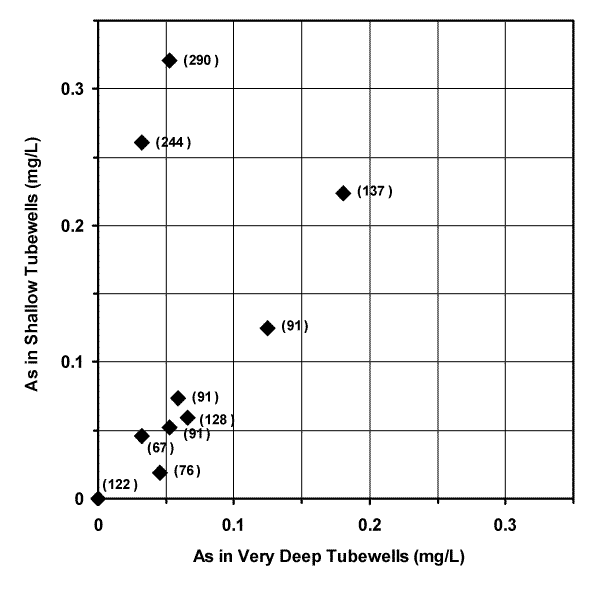 |
| Figure 5. The vertical distribution of arsenic in groundwater based on adjacent pairs (< 100 m or < 328 feet apart) of "very deep" (67.1 to 290 m bgs or 220 to 950 feet bgs) and shallow (< 30.5 m or < 100 feet bgs) tubewells. The depth of each "very deep" tubewell in meters is shown next to the corresponding data point. |
This wide-spread aerial and vertical distribution suggests the dominant source of the arsenic appears to be one or more geologically deposited minerals.
The distribution of arsenic concentration versus tubewell depth shown in Figure 4 suggests that an arsenic concentration maxima possibly occurs when tubewells are less than 61 m (200 feet) bgs. If this maxima is fact then it may result from younger surface sediments releasing more arsenic than older subsurface deposits, or the preferential release of arsenic into groundwater near the unsaturated zone. If this maxima is fiction then it may result from a statistical aberration produced by the relatively small number of observations (86 of 503 total observations) from tubewells greater than 61 m (200 feet) bgs.
A correlation coefficient matrix for a variety of tubewell water parameters is shown in Table 3 for informational purposes. Interpretation of this data should be performed with caution as it represents the entire country and is probably scale dependant. That is, these correlations may not apply on the district, thana, or village scale.
| Arsenic | Sulfate | Sulfide | Chloride | Phosphate | Depth | Total Iron | |
|---|---|---|---|---|---|---|---|
| Arsenic | 1.00 | -0.078 | 0.059 | 0.24 | 0.27 | -0.19 | 0.44 |
| Sulfate | 1.00 | 0.41 | 0.051 | -0.060 | -0.14 | 0.16 | |
| Sulfide | 1.00 | 0.062 | 0.19 | -0.097 | 0.23 | ||
| Chloride | 1.00 | 0.10 | 0.028 | 0.38 | |||
| Phosphate | 1.00 | 0.16 | 0.073 | ||||
| Depth | 1.00 | -0.19 | |||||
| Total Iron | 1.00 |
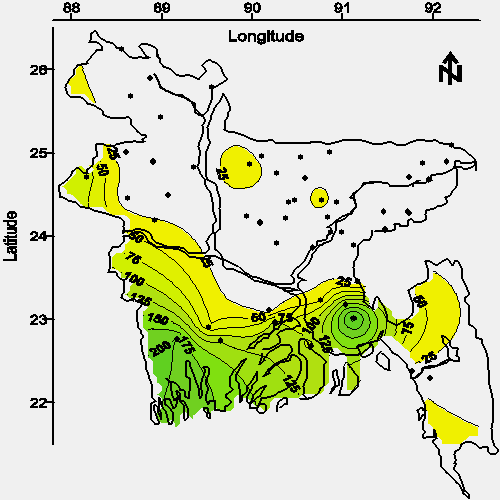
The contour map of average chloride concentration in water from shallow tubewells is shown in Figure 6. The spacial relationship between chloride and arsenic (see Figures 6 and 2) in connate water (water associated with deposition, 10) suggests the arsenic-leaching mineral or minerals were likely deposited in an estuarine environment. An alternative hypothesis is that the release of arsenic from the solid phase is facilitated by chloride or another component of historical seawater.
 |
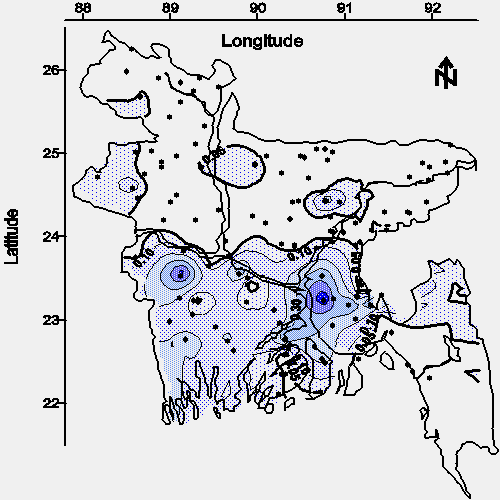 |
Phosphate is commonly used as a fertilizer; therefore, the possibility of this agrochemical impacting groundwater must be considered before comparing the spacial relationship between phosphate and geologically deposited arsenic. Phosphate fertilizer forms difficultly soluble iron, aluminum, calcium, and magnesium compounds that do not readily leach from most soils (11); however, the phosphate concentration ranged from 1 to 20 mg/L in all 11 groundwater samples collected at greater than 122 m (400 feet) bgs. This range of phosphate concentrations is approximately 5 to 100 times greater than that of seawater (6). Like phosphate, nitrate is associated with agricultural activity. Unlike phosphate, nitrate readily leaches from soils; however, nitrate was detected above 1 mg of NO3--N/L in only 5 of 90 groundwater samples. All 5 of the samples with detectable concentrations of nitrate were from wells not greater than 122 m (400 feet) bgs. Four of these 5 samples were from a small area of northwestern Bangladesh (Dinajpur, Phulbari, and Gobandaganj) with relatively sandy soils (12) which often promote leaching (11) and low concentrations of phosphate in groundwater. These findings suggest that the dominant source of phosphate in the groundwater of Bangladesh is geological, not an agricultural leachate.
The contour map of average phosphate concentration in water from shallow tubewells is shown in Figure 7. The spacial relationship between phosphate and arsenic (see Figures 7 and 2) suggests the arsenic-leaching mineral or minerals might contain arsenate isomorphically substituted for phosphate; that is, the major source of arsenic in the groundwater of Bangladesh may be a phosphate or phosphates which have arsenate as an impurity. This hypothesis should be confirmed or disproved by a detailed mineralogical evaluation of a statistically significant number of soil samples.
 |
 |
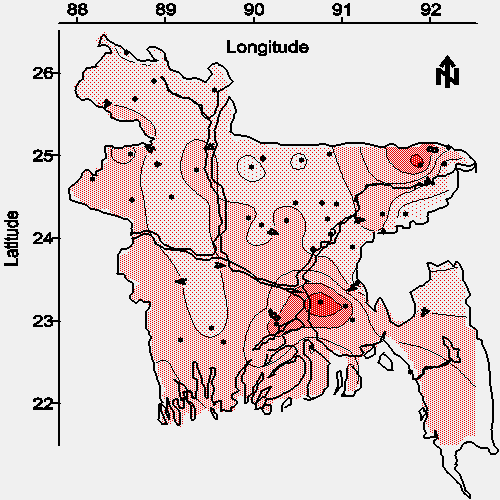
An alternative hypothesis that arsenic is being released from arsenopyrite (FeAsS) or an iron pyrite (FeS2) has been proposed for the situation in nearby West Bengal, India (immediately west of Bangladesh, 13). This hypothesis suggests that arsenic is initially associated with a difficultly soluble pyrite mineral that is underwater in a reducing environment, and the arsenic is released when the pyrite is aerated by lowering the water table during groundwater pumping. This hypothesis is supported by the detailed mineralogical evaluation of an unpublished number of soil samples ("some selected particles from 85 samples . . . were examined by . . . X-ray diffraction") from West Bengal which suggested that arsenic is associated with iron pyrite (14). If this hypothesis is true for the general situation in Bangladesh, then the concentrations of inorganic sulfur and arsenic should be correlated; however, the concentrations of sulfide and arsenic, and sulfate and arsenic in groundwater from Bangladesh are not correlated (see Table 3).
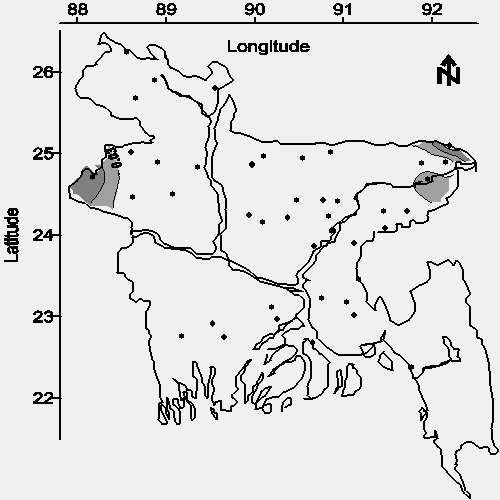
The contour maps of average sulfide concentration and average sulfate concentration in water from shallow tubewells are shown in Figures 8 and 9, respectively. The spacial relationship between sulfide and arsenic (see Figures 8 and 2), and that between sulfate and arsenic (see Figures 9 and 2) suggests the principal arsenic-leaching mineral or minerals in Bangladesh are not associated with inorganic sulfur in contrast to the presumed situation in West Bengal.
 |
 |
 |
 |
If the arsenic-leaching mineral or minerals are not associated with inorganic sulfur, then the hypothesis that groundwater depression from irrigated agriculture facilitates the release of arsenic by aerating arsenopyrite or another pyrite might not represent the general situation in Bangladesh. Nevertheless, the occurrence of sulfide and sulfate in groundwater at the West Bengal / Bangladesh border (see Figures 8 and 9) does suggest that pyrites may be an important source of arsenic in West Bengal and limited areas of Bangladesh.
Even if the principal source of dissolved arsenic in West Bengal is pyrites, the general situation in Bangladesh may differ because these two regions have very different geologies. Both West Bengal and Bangladesh receive sediment from the Ganges river basin, but Bangladesh also receives sediment from the Brahmaputra and Meghna Rivers. Each river has different sources of sediment, and most likely different proportions of arsenic, sulfur, and phosphate-bearing minerals. Moreover, Bangladesh is further than West Bengal from the presumed source of pyrites in the Ganges river basin. For these reasons, the percentage of arsenic- containing pyrites in Bangladesh aquifers is likely to differ from, and possibly be much less than that in West Bengal. Furthermore, the environments in which the aquifer sediments were deposited are different in West Bengal and Bangladesh; therefore, the oxidation-reduction conditions, sulfur concentrations, and other important aquifer chemistry parameters are likely different as well. The depositional environments of Bangladesh aquifers commonly include deltaic, estuarine, and riverine sediments, while most of the West Bengal aquifers contain only riverine sediments. Because there are so many substantial differences between the geologies of West Bengal and Bangladesh, it should not be assumed without further study that the source of arsenic in groundwater is the same in both regions.
Various local scientists have used the popular press to advocate for restricting irrigation in Bangladesh to prevent the release of arsenic from a presumed pyrite source. However, no experiments evaluating the ability of such a groundwater management scheme to provide safe drinking water have been implemented in Bangladesh, West Bengal, or elsewhere. Moveover, such an unproven groundwater management scheme would have a disastrous effect on the food supply of this famine-prone country. The people of Bangladesh suffered a severe famine in 1973 when its population of 60,000,000 did not have ready access to irrigation and generally relied on 1 crop per year (15). Over two decades later, the 120,000,000 people of Bangladesh are still not food- sufficient despite the 3 to 4 crops per year made possible with irrigation (3). Therefore, any policy which affects the availability of food or water to the people of Bangladesh must be based on meticulous scientific research, not speculation.
The composition of all minerals leaching arsenic into the groundwater of Bangladesh should be determined from a detailed evaluation of a statistically significant number of soil samples. If arsenic is released from arsenopyrite or another pyrite, then alternative groundwater management practices should be evaluated and the treatment of drinking water by aquifer oxygenation may prove to be inappropriate. Aquifer oxygenation is the injection of compressed air or oxygen around a well screen to precipitate arsenic and other metals before they are pumped above ground; however, if pyrites are present, then this process may facilitate the release of arsenic to groundwater. Knowledge of the composition of minerals leaching arsenic into groundwater is relatively unimportant if one is only concerned with treating water after it has been pumped above ground.
The contour map of average total iron concentration in water from shallow tubewells is shown in Figure 10. The spacial relationship between total iron and arsenic (see Figures 10 and 2), and the general excess of total iron relative to arsenic suggests that ambient iron might be used to coagulate (coprecipitate) arsenic in a low-input water treatment system (16). The distribution of analytical interference (see Table 1) for the determination of iron (located on the map with the letter "E") suggests that one or more of the following potentially toxic metals are widely distributed in groundwater throughout Bangladesh: chromium, zinc, cobalt, nickel, bismuth, cadmium, mercury, and/or silver (5).
 |
 |
| Analyte | Independent Standard Recovery |
Sample Matrix Spike Recovery |
|---|---|---|
| Arsenic (As) | 83% | 89 ± 11% |
| Ferrous iron (Fe2+) | 93 ± 10% | 34 ± 23% without dilution 96 ± 13% with 1 to 10 dilution |
| Total iron (Fe) | 95% | 120 ± 12% with 1 to 10 dilution |
| Sulfate (SO42-) | 106% | 106 ± 20% |
| Chloride (Cl-) | 114% | 90 ± 15% |
| Phosphate (PO43-) | 88% | 84 ± 2% |
Cobalt, nickel, and silver ores are often codeposited with arsenic (17), and each of these 3 metals are a potential interference to the 1,10-phenanthroline method; therefore, any limited resources available to investigate the occurrence of metals other than arsenic in this water should first include this subgroup of 3 metals (cobalt, nickel, and silver). Subsequent investigation should include the entire group of 8 metals (chromium, zinc, cobalt, nickel, bismuth, cadmium, mercury, and silver). Additional analytes beyond this group of 8 metals should be added as resources allow.