
April-June 1999 Issue
Budget Allocation in Large R&D Organizations:
Distributing Funds for Continuing Success
April-June 1999 Issue
Budget Allocation in Large R&D Organizations:
Distributing Funds for Continuing Success
![]() anagers of R&D in large organizations generally divide up their total budget based on the relative merit of individual projects. But Energy Laboratory research suggests that they should also focus on the different phases of research going on in their program--for example, basic research, applied research, and development. A new system dynamics model can show them how to ensure that each phase receives sufficient funding to yield a steady flow of projects toward commercialization. Given historical data on the behavior of projects in each phase--the average probability of success, the time required for completion, and the project cost--the model calculates the optimal allocation of funds among the phases and the number of products that will reach commercial readiness each year. The model can also quantify the effects of not following that allocation. For example, it shows that overfunding the final phase increases the number of products in the near term but decreases that number over the long term as output from the underfunded earlier phases dwindles. It can also quantify the potential benefits of making special investments, for example, in machinery to speed up productivity in one phase. Thus far, the researchers have demonstrated their model using publicly available data on R&D in the pharmaceutical industry. They are now working with US Department of Defense managers to study DOD budget allocation among aircraft-related projects.
anagers of R&D in large organizations generally divide up their total budget based on the relative merit of individual projects. But Energy Laboratory research suggests that they should also focus on the different phases of research going on in their program--for example, basic research, applied research, and development. A new system dynamics model can show them how to ensure that each phase receives sufficient funding to yield a steady flow of projects toward commercialization. Given historical data on the behavior of projects in each phase--the average probability of success, the time required for completion, and the project cost--the model calculates the optimal allocation of funds among the phases and the number of products that will reach commercial readiness each year. The model can also quantify the effects of not following that allocation. For example, it shows that overfunding the final phase increases the number of products in the near term but decreases that number over the long term as output from the underfunded earlier phases dwindles. It can also quantify the potential benefits of making special investments, for example, in machinery to speed up productivity in one phase. Thus far, the researchers have demonstrated their model using publicly available data on R&D in the pharmaceutical industry. They are now working with US Department of Defense managers to study DOD budget allocation among aircraft-related projects.
Managers who oversee large research and development programs face a dilemma: given an annual budget for R&D, how should they allocate resources among the active or proposed projects in their area to maximize output? Generally, such decisions are made on a project by project basis, based perhaps on the relative attractiveness of different projects or on the past successes or the persuasiveness of individual project managers. Studies of R&D management offer little guidance, as most focus on how best to run big projects, say, designing a Polaris system or organizing a flight to the moon.
According to Professor Kent F. Hansen and his colleagues at the Energy Laboratory, managers of R&D programs might do better by adopting an additional perspective. Instead of thinking project by project, they should take a systematic approach to assessing the entire collection of R&D activities under their control. Regardless of the topic, R&D projects involve a sequence of steps, or phases. The exact names of those phases may vary from industry to industry, but in general they include some version of basic research, applied research, and development. Each phase is critical to achieving the ultimate goal--in industry, to develop a commercially viable product. To ensure a continual yield of viable products, the R&D manager's problem should be viewed from two levels. First, how should the total R&D budget be divided up among basic research, applied research, and development? Then, once the allocation is made, the manager must choose projects within each phase for support.
Professor Hansen, Dr. Malcolm A. Weiss, and Dr. Sangman Kwak have developed a simple but precise mathematical technique that enables R&D managers to calculate how much of their budget to allocate to each phase to ensure a constant number of new commercial products each year. The figure below shows a simple model of the R&D process. Three phases of research lead in succession to readiness for commercial use. (More phases may be incorporated as needed.) Money flows into each phase from the budget allocation above. Ideas flow from Phase 1 to Phase 2 to Phase 3--unless they are deemed unsuccessful, in which case they flow out of the system along one of the downward arrows into the clouds.
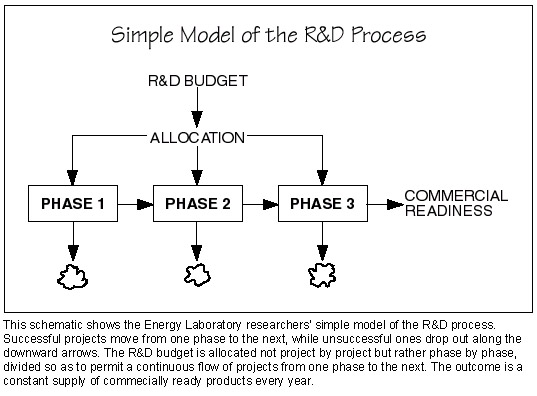
For simplicity, assume that the R&D manager's goal is to produce one commercially ready product each year; and assume that experience has shown that one out of every three projects is successful in each phase. ("Success" is defined as readiness to move on to the next phase in the R&D process or to ultimate commercial readiness.) The concept is best understood by working backwards from the end. Given the one-in-three success rate, if one commercially ready product is to come out of Phase 3, three projects must be completed in Phase 3. To have those three projects successfully come out of Phase 2, there must be nine projects completed in Phase 2. And to get those nine projects, there must be 27 projects completed in Phase 1. Thus, the researchers' approach tells--for the given assumptions--how many research projects must be completed in each phase for the R&D process to yield one commercial success each year.
But for many projects, completing a given phase will require more than a year. Therefore, the model must take into account the duration of the projects. Going back to Phase 3 in the example, if projects typically take two years to complete, then six projects must be completed in Phase 3 to get one commercial success per year. Calculating the required budget allocation for Phase 3 is then simple. If each project in Phase 3 costs $10,000 per year, the R&D manager must allocate $60,000 to Phase 3 to meet the goal of one product per year. As before, working backwards through the model (using the probability of success, duration, and cost information for each phase) will ultimately yield the total R&D budget and its "optimal" allocation among the three phases.
In the model, the process just described is expressed by a series of simple mathematical formulas that yield a precise solution: the total R&D budget required and its optimal allocation among the phases of research. Of course, critical parameters in those formulas--successfulness, duration, and cost--will vary from project to project. But a large R&D program (the only kind considered here) will have many projects in each phase. To perform an analysis, the model therefore uses mean values for those parameters--values that are determined by averaging a firm's experience with many projects over many years. Implicit in this calculation is an assumption that past behavior will continue in the future.
To illustrate the capabilities of their mathematical model, the researchers needed real industrial data on R&D activities. But acquiring the data proved challenging both because companies treat such information as proprietary and because single companies in many industries do not perform all three phases of research. In the energy field, for example, much Phase 1 research (basic research) is performed at universities. Successes from that work then enter directly into Phase 2 of the industrial stream of research activities. That situation is easily handled by the model, but it does not serve as a good example with which to demonstrate the model.
The problem was solved when graduate student Namsung Ahn found the ideal data set: composite R&D data representing the ten largest US pharmaceutical companies, assembled in 1997 by Lehman Brothers International. The pharmaceutical industry proved a good subject for analysis. To succeed financially, pharmaceutical companies must constantly introduce new drugs and other new products into the marketplace, so investment in R&D is high. Moreover, pharmaceutical companies tend to perform all three phases of research in-house--in this case, discovery and screening, preclinical evaluation, and clinical testing and market entry.
Using the Lehman Brothers' composite data, the researchers determined the average success rate, duration, and cost of projects in each of those three phases. They then used their model to calculate the total R&D investment and optimal allocation for bringing one new drug or product onto the market each year. A total of $608 million must be invested annually, and it should be divided as follows: $230 million (about 38%) should go to discovery and screening, $71 million (12%) to preclinical evaluation, and $307 million (50%) to clinical testing and market entry. The recommended allocation for Phase 1 research is substantially higher than is observed in most companies; but (as stated earlier) the pharmaceutical industry is unusually driven by innovation, and companies generally perform all of their own basic research.
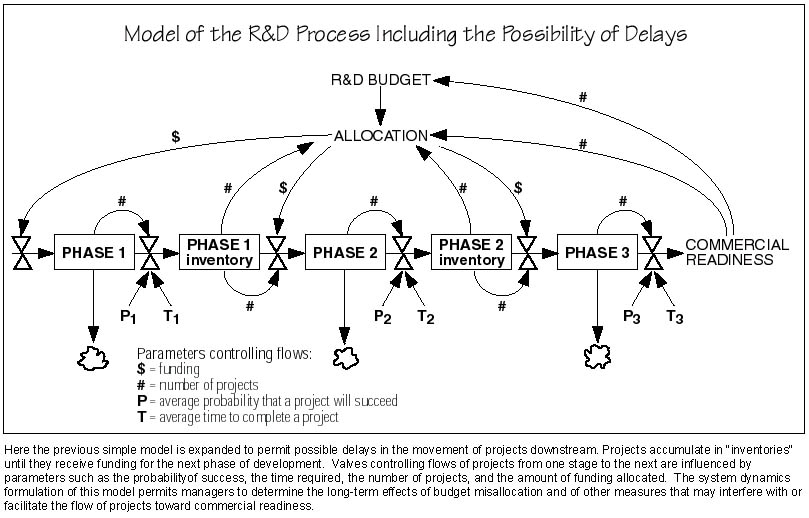
While this simple model is useful, it does not account for certain important aspects of the R&D process. For example, successful projects do not all move downstream immediately. There can be a delay until adequate interest or resources are available. To incorporate such time-dependent behavior into their analysis, the researchers turned to the techniques of system dynamics, an approach to modeling that involves building a quantitative description of the many elements of a system and their interactions over time. (See e-lab, July-September 1995, for a description of the researchers' system dynamics model of the cleanup of the Hanford nuclear waste tanks in Washington State.)
The diagram below shows the more complicated model. The basic structure of the simple model remains intact, but after Phases 1 and 2 appear "inventories"--places where successful ideas and projects can accumulate until they are developed and subsequently move forward to the next phase. The flow of projects from one status to the next is controlled by valves, which are in turn controlled by other parameters, as indicated by arrows that represent flows of information (the probability of success, the time required, the number of projects), money, or the projects themselves. Flows of projects from outside sources into the various phases are not shown in this diagram but are frequently important and are easily accommodated by the model.
Like all system dynamics models, this model is good at predicting how changing some part or aspect of the system will change overall system behavior over time. For example, what are the consequences of changing the allocation scheme from the optimal distribution? Suppose the R&D manager allocates extra money to Phase 3 in order to increase the output of commercially ready products. When the optimal allocation scheme is followed, the cumulative number of commercially ready products increases steadily over time. If more money is allocated to Phase 3 and less to Phases 1 and 2, the cumulative number of commercially ready products does increase more rapidly in the near future. In the longer term, however, it falls behind because the earlier phases are underfunded and the inventory feeding into Phase 3 becomes depleted. If the earlier phases receive the extra funding, they will produce more successes. But the later phases will have inadequate funding to exploit all those successes, and inventories will continue to build up. The model permits managers to quantify the consequences of misallocation--and to define a new allocation of funds that will even out any uneven inventories and allow projects to flow continuously from one phase to the next.
Another possibility is that the attributes of one phase may change. For example, what would happen if productivity in the basic research phase increased? Suppose the R&D manager in the earlier pharmaceutical example is considering buying a $10 million machine that will enable the basic research team to test new ideas more quickly. Ideas are no more likely to be successful, but they can be deemed good or bad faster than before, cutting the cost of completing projects (successful or unsuccessful) in half. By buying the machine, the R&D manager can get the same number of Phase 1 successes for $115 million instead of $230 million. The total R&D budget required to get one new drug per year drops from $608 million to $493 million--an excellent return on the investment in the new machine. The R&D manager could, however, decide to maintain R&D spending at the original $608 million level. If the money is allocated as before, Phase 1 inventory will increase, but the number of annual commercial successes will remain unchanged. If that money is reallocated recognizing the increased productivity of Phase 1, the number of annual commercial successes will increase by 23%--a dramatic illustration of the importance of optimizing phase allocations. The model thus enables managers to see where steps to improve the probability of success or to decrease the time or cost of projects will yield the greatest benefits.
The researchers are now beginning to use their model to analyze a current challenge: the allocation of R&D funds by the US Department of Defense. Their focus is on "air platforms," a DOD research program that includes a broad collection of activities relating to airplanes and helicopters. Like the pharmaceutical industry, the air platforms program has characteristics that make it a good subject for analysis. Its R&D is divided into three distinct sections: basic research, developmental research, and demonstration research. And a long history of data from many projects is available--a prerequisite for extracting meaningful parameters. The researchers have met with representatives of the Army, the Air Force, and the Navy to gain insights into the nature of research in this area; and they are now working with the available data to deduce parameters describing projects in each section of the program.
Meanwhile, they are considering other feedback mechanisms that should be incorporated into the model to make it better reflect reality. For example, the size of the allocated budget affects the probability of success and duration of projects in any phase. A large budget buys good people and good equipment, both of which make success more likely and the research process more efficient. In contrast, an inadequate budget can cause even good projects to fail or never reach a conclusion. The size of the upstream inventory also affects the probability of success. If many projects are available for further development, the R&D manager can select the best among them rather than having to settle for whatever is there.
In the longer term, the researchers would like to expand the model to analyze budget allocations not only among phases within a research stream but also among different streams. For example, DOD also funds research on communications, control systems, and many other topics; and each of those research streams has its own structure and characteristics. An expanded version of the model could help managers meet the challenge of allocating funds among such parallel but interacting research streams.
Kent F. Hansen is a professor of nuclear engineering. Malcolm A. Weiss is a senior research staff member and Sangman Kwak is a visiting scientist, both in the Energy Laboratory. Namsung Ahn is a PhD candidate in the Department of Nuclear Engineering. This research was partially supported by the US Department of Defense. Further information can be found in references.