
July-September 1999 Issue
Carbon Dioxide Emissions Trading:
Simplifying the Analysis
July-September 1999 Issue
Carbon Dioxide Emissions Trading:
Simplifying the Analysis
![]() ne of the hottest topics in recent climate-change
negotiations has been emissions trading. Under the Kyoto Protocol,
countries that face high costs to reduce emissions of carbon dioxide
(CO2) are allowed to pay countries with lower-cost opportunities to
make the reductions for them. An Energy Laboratory team has developed
an easy-to-interpret method of showing who would trade and how
specific nations would be affected. Using output from standard models
that simulate economic growth, energy use, and carbon emissions, the
researchers form "marginal abatement curves" that show the cost to a
given region of achieving cuts in CO2 emissions. By superimposing
curves for different regions, they can readily see which regions would
trade and how their costs would be affected. Analyses show that,
almost regardless of circumstances, all regions will benefit from
trading. The savings are enormous when the lowest-cost reducers--the
developing nations--participate. But costs drop considerably even when
trading is limited to the major regions of the Organization for
Economic Cooperation and Development (OECD). In every case, nearly all
nations benefit some, and nations facing the highest costs benefit
most. The researchers are now performing analyses involving different
levels of economic and emissions growth and specific rules for trading
currently being considered. These analyses show, for instance, that
establishing ceilings on how much a nation can trade severely reduces
the overall gains from trading.
ne of the hottest topics in recent climate-change
negotiations has been emissions trading. Under the Kyoto Protocol,
countries that face high costs to reduce emissions of carbon dioxide
(CO2) are allowed to pay countries with lower-cost opportunities to
make the reductions for them. An Energy Laboratory team has developed
an easy-to-interpret method of showing who would trade and how
specific nations would be affected. Using output from standard models
that simulate economic growth, energy use, and carbon emissions, the
researchers form "marginal abatement curves" that show the cost to a
given region of achieving cuts in CO2 emissions. By superimposing
curves for different regions, they can readily see which regions would
trade and how their costs would be affected. Analyses show that,
almost regardless of circumstances, all regions will benefit from
trading. The savings are enormous when the lowest-cost reducers--the
developing nations--participate. But costs drop considerably even when
trading is limited to the major regions of the Organization for
Economic Cooperation and Development (OECD). In every case, nearly all
nations benefit some, and nations facing the highest costs benefit
most. The researchers are now performing analyses involving different
levels of economic and emissions growth and specific rules for trading
currently being considered. These analyses show, for instance, that
establishing ceilings on how much a nation can trade severely reduces
the overall gains from trading.
Reducing carbon emissions is easier for some countries than for others. Developing nations, for example, can reduce emissions by improving their generally inefficient energy practices--a relatively low-cost approach not available to developed nations, where efficiency is already high. Even among the developed nations that signed the Kyoto Protocol, the cost of a one-ton reduction varies considerably. The United States, for example, can reduce emissions by switching from coal to natural gas--an option less available to Europe, where little coal is used. In light of those cost discrepancies, the Kyoto agreement allows countries to trade emissions "permits." Thus, a region that has only expensive opportunities to reduce can abate less by getting a region with less-expensive opportunities to reduce more in its place. The total reduction in global emissions is the same, and everyone comes out ahead. The "high-cost" region pays less to meet its restrictions by buying emissions permits from a "low-cost" region, and the low-cost region makes money by selling its permits for more than it spends on reducing the extra emissions. Under this arrangement, market-driven forces cause the least-expensive measures available worldwide to be pursued first, so the total cost of meeting the Kyoto constraints is minimized. (The location of emissions reductions is not critical because of the long-lived, well-mixed nature of atmospheric CO2.)
Many experts believe that such trading may be the key to stabilizing atmospheric CO2 at a tolerable cost--and perhaps the key to getting a meaningful climate-change agreement in place. But international negotiators have been unable to settle on acceptable rules for emissions trading. The issue is highly controversial, in part because the potential impacts of trading are so complex. An overall reduction in cost seems likely, but which countries will benefit and by how much? Will some countries be worse off? And do the benefits disappear in the absence of the developing nations, which have the lowest-cost reduction opportunities but the least-developed infrastructures for trading?
Energy Laboratory researchers led by Dr. A. Denny Ellerman have developed an approach to analyzing CO2 emissions trading that not only quantifies the impacts of various trading conditions but also helps economists and non-economists alike understand why the market will behave as predicted. The data they use are not new but rather come from existing "computable general equilibrium" (CGE) models such as the Emissions Prediction and Policy Analysis (EPPA) model, developed by Professor Henry D. Jacoby and his colleagues at MIT. This complicated model simulates economic activity, energy use, and greenhouse gas emissions for many regions and economic sectors (see e-lab, January-March 1997). Based on those simulations, it forecasts future CO2 emissions and the cost of reducing them.
However, CGE models can examine only one set of assumptions at a time. To understand the economic impacts of the Kyoto constraints, one needs to see not only the cost of abating a single ton of carbon given one set of assumptions but also how that cost changes as the reduction required in the future is greater or less, reflecting the intervening economic and emissions growth. (One performs the least-expensive emissions-reduction measures first and turns to increasingly expensive measures for further reduction. Thus, the per-ton cost will rise as the required reduction increases, and vice versa.) The needed data can be generated by running a CGE model many times with varying assumptions, but making sense of the results is difficult.
Dr. Ellerman and Annelčne Decaux have developed and demonstrated a clear, easy-to-interpret method of presenting such data. To assemble the data, they use the EPPA model to perform systematic analyses of the cost to a region of reducing carbon levels by specific amounts (for example, 10%, 20%, 30%, and so on) in a specific year. Based on those results, they form a "marginal abatement curve" showing the cost of an additional one-ton reduction in carbon emissions at various levels of abatement. (One ton of carbon corresponds to 3.67 tons of CO2.)
The figure below provides examples of marginal abatement curves and how they can be used. The curves shown, taken from a case study using the EPPA model, represent costs for varying levels of abatement for Japan, the European Community (EC), and the United States--the three biggest OECD regions--in 2010, the middle year of the first time period covered by the Kyoto agreement. As expected, within each region, the cost of reducing a ton of carbon emissions increases as more reduction occurs. But the cost of reducing emissions by a set amount differs substantially from region to region. For example, both the marginal cost and the total cost of abating 100 million tons (Mton) are many times higher for Japan than for the US. (Marginal cost is the cost of preventing the last ton of carbon from escaping. Total cost equals the hatched area below the curve.) Even when scaled as a percent of current emissions, the costs are higher for Japan than for the EC or the US because of the Japanese economy's greater energy efficiency.
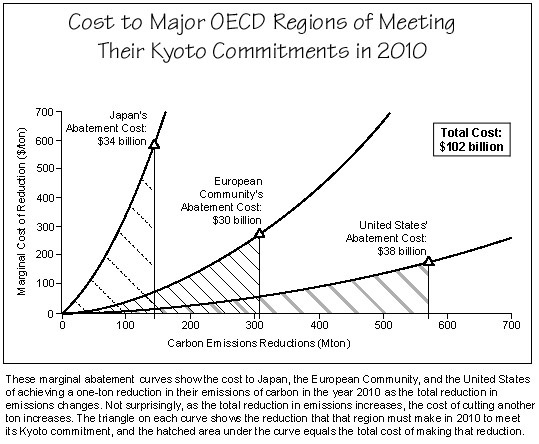
Based on those curves, the researchers can estimate the costs to the regions of meeting their 2010 constraints. The triangle on each curve indicates how many tons of carbon the region must prevent from escaping into the atmosphere in 2010, based on a prediction of what emissions would be without the Kyoto constraint. (A region's reduction requirement equals the difference between its Kyoto constraint and its expected emissions in the absence of abatement efforts.) Thus, Japan will have to reduce emissions by about 150 Mton, the EC by a little over 300 Mton, and the US by about 575 Mton. The total costs of achieving those reductions are shown on the figure.
A striking feature of the curves is the variation in the cost of reducing a ton as each region approaches its constraint. At this level of abatement, marginal cost is far lower in the US than in either Japan or the EC (even though the number of tons reduced is far higher in the US). The US pays only $186 to abate the last ton, while Japan must pay $584 and the EC $273. If emissions trading were limited to these three regions, Japan and the EC could save money by paying the US to reduce on their behalf.
The figure below shows emissions trading among the three market participants and the savings that would accrue. The curves themselves are unchanged. (The cost for a region to reduce a ton of carbon emissions is the same whether the region performs the reduction to sell to another region or to meet its own requirement.) The triangles are also in the same locations as before, indicating the required Kyoto reductions. The rectangles on the curves show how much each country would abate, given the opportunity to trade. Because the US faces the lowest costs among this group of regions, it can reduce more than it has to and become an exporter of emissions permits. But there is a limit to the amount of abatement it exports. As the US reduces more (see the right-facing arrow under the horizontal axis), the per-ton cost of reduction gradually goes up. And as Japan and the EC reduce less (see the left-facing arrows), their per-ton costs of reduction gradually go down. At a certain point, the marginal cost in the US will no longer be less than the marginal costs in Japan and the EC. Cheaper abatement will no longer be available from the US, and the other regions will perform the balance of their required reductions themselves.
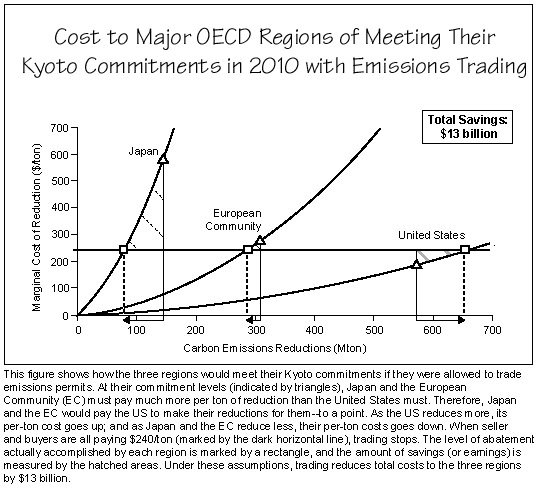
Under the assumptions made here, when the reduction costs for all participants converge at $240/ton, trading is no longer beneficial. At that cost--marked by the dark horizontal line--the US abates 83 Mton more than required, and Japan abates 65 Mton less and the EC 18 Mton less. Everybody benefits economically. The US earns $2 billion by exporting permits, while Japan saves $10 billion and the EC about $1 billion by importing permits rather than performing their own reductions. Under these circumstances, all three regions can meet their obligations for a total of $89 billion rather than the $102 billion they must spend when trading is not allowed.
These results demonstrate several important points. First, even if only the three major OECD regions trade, their cumulative savings are significant. Second, although all regions benefit to some extent, the gains from trade are greatest for those regions whose marginal cost is farthest from the market price of emissions permits. Finally, when trading occurs, the disparity among countries in the cost burden of achieving the Kyoto commitments is diminished--a condition that encourages adherence to the commitments and the subsequent upholding of the agreement.
Of course, the market for emissions permits may involve more than just the three major OECD countries. The "Annex B" countries that have agreed to limit their emissions under the Kyoto Protocol include other OECD countries (Canada, Australia, and New Zealand), eastern Europe, and the former Soviet Union (FSU). When those regions are also involved in trading, the picture changes significantly, largely because of the involvement of the FSU. According to most predictions, the FSU's commitment made at Kyoto will not result in a constraint on its carbon emissions in 2010 because the commitment corresponds to an emission level higher than the one predicted for that year. The difference between the committed level and the predicted level translates into emissions permits that the FSU can sell--a feature known as "hot air" because no actual reductions occur. In addition, the FSU's marginal abatement curve suggests that performing a certain level of actual abatement in order to export permits would make economic sense.
By creating marginal abatement curves for all of the Annex B regions, the researchers determined which regions would buy and sell emissions permits and how costs would change. With all Annex B regions trading, the market price of emissions permits settles at $127/ton--well below the $240/ton when only the three OECD regions trade. At that permit price, the US becomes an importer rather than exporter, and Japan and the EC increase the fraction of reduction requirements met with imports (see the summary table below). Japan again reaps the most economic benefit, now saving $19 billion by trading. The biggest winner, however, is the FSU. By providing 98% of all exports (through hot air and low-cost reductions), the FSU earns $34 billion.
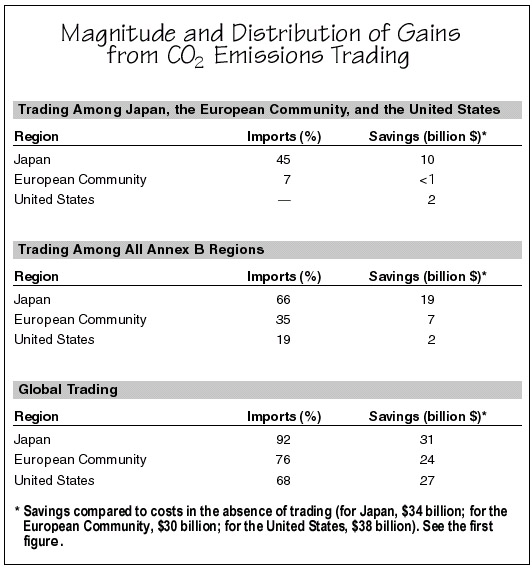
Broadening the market to non-Annex B regions worldwide brings in many more low-cost abatement providers, notably China and India. Analysis of the economic behavior of all participants shows that with global trading the market price of permits drops to $24/ton. As shown in the table, Japan now imports fully 92% of its abatement, the EC 76%, and the US 68%. Costs for each region drop, with the total cost for the three regions falling to about $20 billion. With other low-cost providers participating, the FSU is no longer as big a winner. It captures only 37% of the market; and its net gain in the global market drops to $4 billion.
Using their global data, the researchers calculated the total costs of implementing the Kyoto agreement, not just for the major OECD regions but for all of the Annex B regions. Without trading, the cost to the Annex B regions is $120 billion. When trading occurs but is limited to the Annex B regions, the cost drops to $54 billion. When nations worldwide participate, the total cost of achieving the Kyoto goals is only $11 billion.
Such findings shed light on one frequently heard argument: that the gains from trading will be limited because only the developed nations will trade. Concerns that potential suppliers of low-cost permits may not trade are valid. Some developing nations may not participate because their governments are unfamiliar with trading as a concept; China and India have objected to emissions trading on principle; and some negotiators are demanding that the FSU have stricter abatement constraints so that it cannot sell emissions permits without making real reductions. However, the MIT case studies suggest that even a subset of traders can make a significant difference. A wider market brings lower-cost permits, greater benefits to the constrained regions, and lower costs for implementing the Kyoto agreement. The wider the market, the better; but even a narrow market is better than none at all.
Deciding which regions would actually buy or sell emissions permits is only one of many uncertainties encountered in trying to predict the impacts of emissions trading. For example, different levels of emissions changes and economic growth for certain regions significantly change the emission reductions required by the Kyoto Protocol. For instance, a recent forecast from the Energy Information Administration predicts less emissions growth overall but relatively more rapid economic and emissions growth for the US than for Japan or the EC. This particular forecast implies that the US would face the highest marginal cost and therefore import permits from Japan and the EC.
The researchers have also examined possible impacts of proposed rules for trading. One proposal put forth by the European nations and rejected by the US involves placing a "ceiling" on the degree to which a single nation can meet its commitment by buying emissions permits from other nations. Analyses using marginal abatement curves suggest that the imposition of such a ceiling would have perverse impacts. The analyses show that adoption of an import ceiling increases the global cost of meeting the Kyoto requirements and transfers most of the gains from trade from exporters to importers. Marginal abatement curves are thus proving a useful tool for investigating not only economic uncertainties but also proposed policy options and their potential impacts on the magnitude and distribution of gains from emissions trading.
A. Denny Ellerman is a senior lecturer at the Sloan School of Management and executive director of the MIT Joint Program on the Science and Policy of Global Change. Annelčne Decaux received her SM degree from MIT's Technology and Policy Program in 1999. She is now employed by ABB Energy Information Systems. Henry D. Jacoby is the William F. Pounds Professor Management and co-director of the MIT Joint Program on the Science and Policy of Global Change. This research was supported by a group of corporations in the United States, Europe, and Japan; by the Electric Power Research Institute; and by agencies of the Norwegian and US Governments. Further information can be found in references.