| Vol.
XXIX No.
5 May / June 2017 |
| contents |
| Printable Version |
Highlights from MIT's Student Quality of Life Survey
In February 2017, Dean for Student Life Suzy Nelson invited all enrolled students to provide feedback on their MIT experience by responding to an on-line survey. Designed with input from students, faculty, and staff, the survey covered a wide range of topics, including satisfaction with academic and non-academic experiences; health and wellness; campus climate; and usage of student resources. By consulting a diverse group of students, with differing perspectives and backgrounds, the MIT community has another source of information to better understand what is working well, what may need improvement, and how the MIT student experience could evolve in the future. In addition, the survey, which is administered every four years, provides the Institute another opportunity for periodic self-examination and reflection by hearing directly from the students who make MIT such a unique and dynamic place.
The survey closed in early March and was answered by 4,541 students, for an overall response rate of 42%. In general, students report being satisfied at MIT, work hard to succeed inside and outside the classroom, and sometimes find it difficult to manage all they have to do. In many areas, the 2017 results look similar or better than 2013, for both undergraduate and graduate students.
To view the entire survey instrument and to explore question-by-question results, please visit: web.mit.edu/ir/surveys/sql.html.
Below are some of the broad-level survey findings, organized by topic area.
Satisfaction
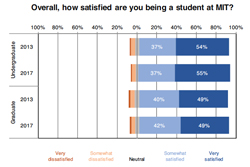
It is difficult to measure every aspect of a student’s quality of life, so as a simple measure, we directly ask students how satisfied they are being a student at MIT. According to the survey, 91% of students reported being somewhat or very satisfied (92% for undergraduates; 90% for graduate students). The 2017 results looked similar to the 2013 results. See Figure 1. When students were asked, “If you could decide all over again whether to be a student at MIT, what would you decide?” 3% responded that they would choose not to come to MIT, 81% said they would come to MIT, and the remaining 16% reported having second thoughts.
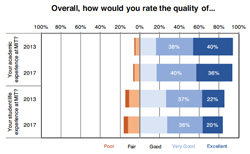
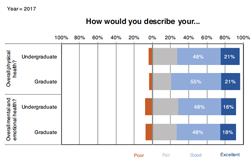
Just 20% of students expressed being very satisfied with their ability to balance academics and other aspects of life, 47% somewhat satisfied. Both undergraduate and graduate students tended to rate their overall academic experience higher than their overall student life experience. See Figure 2.
(click on image to enlarge)
(click on image to enlarge)
Workload
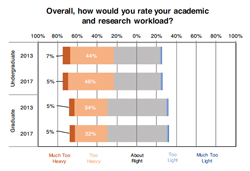
To further explore workload balance issues, the survey asked students to rate their current academic workload at MIT and how it compared to prior educational settings. Fifty-four percent of students said their current academic and research workload was “About right” (60% for graduate students and 47% for undergraduate students). Two percent said “Too light” or “Much too light.” The 2013 and 2017 results looked similar. See Figure 3. Fifty-six percent of undergraduate students rated their workload as much heavier than high school, compared to 22% of graduate students who rated their workload much heavier than college.
(click on image to enlarge)
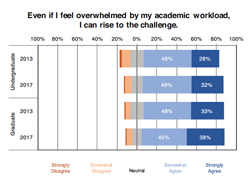
Despite the demands that come with an MIT education, students noted that they felt self-driven and motivated to work through academic pressures. When asked the extent to which they agreed or disagreed with the statement, “Even if I feel overwhelmed by my academic workload, I can rise to the challenge,” 83% somewhat or strongly agreed. A higher proportion of students strongly agreed with this statement in 2017 compared to 2013, for both graduate and undergraduate students. See Figure 4.
(click on image to enlarge)
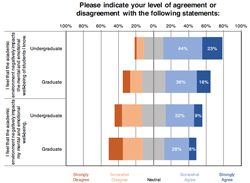
The survey asked two questions about the academic environment at MIT and how it relates to student well-being: has the academic environment negatively impacted the respondent's mental and emotional well-being, and has it negatively impacted the mental and emotional well-being of other students they know. Twenty-three percent of undergraduate students and 16% of graduate students strongly agreed that the academic environment negatively impacted the mental and emotional well-being of students they knew. A lower percentage (8-9%) strongly agreed that their own well-being was negatively impacted. See Figure 5.
(click on image to enlarge)
Campus Climate & Support
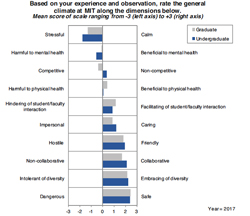
Another goal of the survey was to gain student perspectives on campus climate and the support available to them. From a list of 10 different dimensions, students were asked to rate the general climate at MIT using a six-point scale. At one end of the scale was one word (e.g., Dangerous), and at the other end was another word (e.g., Safe). Figure 6 shows the mean score for each word pairing, separately for undergraduate students and graduate students. We observe that for the wording pairing Stressful: Calm, students were more likely to select “Stressful” than “Calm.”
(click on image to enlarge)
During the analysis of this particular section, we saw notable differences by student type. Graduate students were more likely than undergraduates to select “Competitive” for the word pair Competitive: Non-competitive. Similarly, undergraduates were more likely to select “Collaborative” for the word pair Non-collaborative: Collaborative. Undergraduate students were more likely than graduate students to select “Harmful to mental health” for the word pair Harmful to mental health: Beneficial to mental health. Specifically, two-thirds of undergraduate students selected a point on the “harmful to mental health” side of the scale, compared to 52% of graduate students.
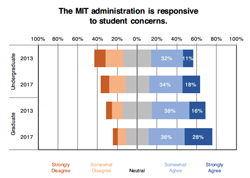
The survey also sought to gauge how supported students felt inside and outside of the classroom. For the statement, “Faculty members treat me fairly,” 52% of students answered “strongly agree,” up from 42% in 2013. A higher percentage of students agreed that MIT provided needed academic support than support to succeed outside of academics (77% versus 55%). Both measures were up from 2013. The MIT administration’s responsiveness to student concerns also fared better between the two survey years. See Figure 7. In 2017, 23% of students strongly agreed with the statement, compared to 14% in 2013.
(click on image to enlarge)
| Back to top |
Feeling Overwhelmed, Isolated & Stressed
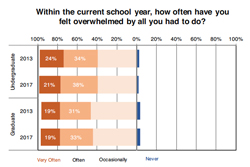
Another section of the survey revolved around sources of student stress, the ways students manage their stress, and their frequency of feeling overwhelmed and isolated. When asked how often they felt overwhelmed by all they had to do during the current school year, more than half said “Often” or “Very often,” similar to findings in 2013. See Figure 8. On average, students were less likely to say they felt isolated than feeling overwhelmed. Eight percent said they felt isolated “Very often”; nearly a quarter said “Never.”
(click on image to enlarge)
The survey included a bank of questions asking students about potential sources of stress during the current academic year. For each of the 27 items in the bank, students rated the item on a four-point scale, ranging from “Not a source of stress” to “Very stressful.” Interestingly, both undergraduate and graduate students expressed the same top stressors.
The top stressor was “Managing my workload,” where 87% of undergraduates and 81% of graduate students rated it moderately or very stressful. This was followed by “Balancing multiple commitments“ (84% undergraduate, 73% graduate), “Expectation to perform as well as my peers” (57% undergraduate, 61% graduate), and “Concerns about life after MIT” (56% undergraduate, 50% graduate).
Health & Well-Being
Another important component of the survey looked at health and well-being issues, asking students to respond to questions about their sleep habits, emotional health, and ability to find time to engage in fun activities. Seventy-three percent of students described their overall physical health as good or excellent, while 65% said the same about their overall mental and emotional health. Undergraduate and graduate students looked similar on these measures. See Figure 9.
(click on image to enlarge)
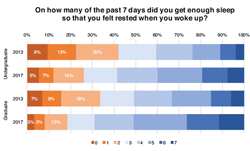
When asked on how many of the past 7 days students got enough sleep so that they felt rested when they woke up, 22% of students said fewer than three days per week (26% for undergraduate students and 18% for graduate students). This is much improved from 2013, where 37% of students said fewer than three days per week. See Figure 10.
(click on image to enlarge)
Seventy-eight percent of students somewhat or strongly agreed with the statement, “I know where to get help when I am not feeling well,” compared to 75% in 2013. In the hopes of learning if students are engaging in activities that are enjoyable, we asked how many days in the past week they did something fun; 70% of students responded 3 or more days.
In the coming months, we will conduct a more thorough analysis of this survey, with particular focus on the open-ended questions asked on the survey. Questions about this survey or other surveys run at MIT can be directed to mit-surveys@mit.edu.
| Back to top | |
| Send your comments |
| home this issue archives editorial board contact us faculty website |