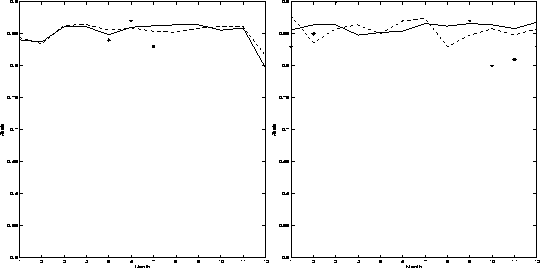
The albedo calculated by the snowpack model plays a crucial role in determining the amount of meltwater formed on the ice sheet. The value of 0.88 used for fresh snow and the prescribed dependence on the time elapsed since the previous precipitation event are adequate. This is confirmed by the comparison between model predicted and observed albedo shown in Fig.5 for two sites in the accumulation region of the ice sheets, Carrefour ( 1850 m.) in Greenland and South Pole ( 2835 m.) in Antarctica. The natural variability seems to be underestimated, perhaps because factors such as the diurnal variations of the solar zenith angle are neglected in the parameterization or because the stochastic rainfall model underestimates the natural variability.
 |
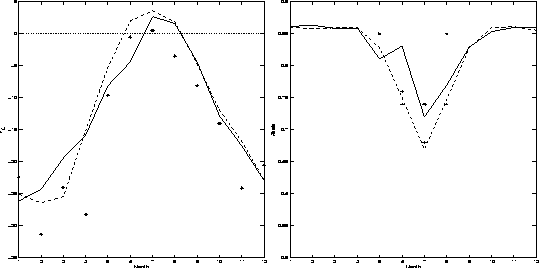
The albedo parameterization near and above the melting point depends entirely on the surface air temperature. The good agreement between the predicted and observed temperatures and albedo shown in Fig.6 for the ETH station allows us to conclude that the albedo parameterization in the -8-4 oC range is adequate.
|
 |
The absence of such high quality data for stations situated in the zone of extensive summer melting complicates the verification process in the 4-8 oC temperature range. Table 2 compares the mean summer temperature and albedo at two sites which experience significantly more melting than the ETH station. The temperatures simulated by the MIT model are slightly too high at Nordbogletscher which will lead to an overestimation of the ablation, they are however generally close to observations. The good agreement between the observed net shortwave radiation, a quantity which is to a large extent determined by the surface albedo, and the values predicted by the MIT model confirm that the albedo parameterization is adequate (the underestimation of the net shortwave radiation at Qamanârssûp Sermia is more likely to be due to an underestimation of the downwelling solar radiation at the surface by the MIT model at that site than to an overestimation of the albedo). The ECHAM model simulates temperatures which are too cold by several degrees at both stations. This leads to a serious overestimation of the albedo which in turn produces the error in the net shortwave radiation.