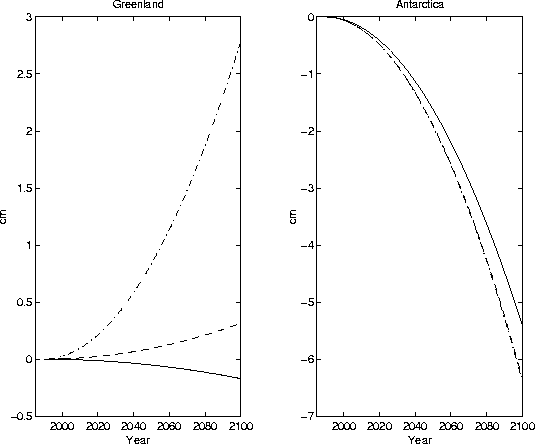
Translating changes in the mass balance of an ice sheet into changes in sea-level requires either a transient integration or an assumption about the time evolution of the changes in accumulation and runoff between the time-slice experiments. The assumption used here is that the changes between 1990 and 2100 will proceed linearly. This assumption may not be justified in light of the preceeding discussion on the effects of non-linearities in the evolution of the surface albedo on the formation of meltwater and runoff, yet the transient integrations performed with the MIT model and described below do not give a clear indication that an alternate fit would clearly be more appropriate. Integrating the changes in mass balance based between the two runs of the ECHAM model yields the estimates of sea-level change shown in Fig.3. It is unclear which, if any, of those results is more reliable since all three estimates of runoff for the current climate were quite different and far from observations. The 173/163 . 1012kg a-1 increase in runoff predicted by the snowpack and degree-day models respectively for Greenland are to a large degree offset by the 132 . 1012kg a-1 increase in accumulation, and the resulting sea-level rise is negligible. The linear model predicts an increase of 2.8 cm but that model was already substantially overestimating the current runoff. The decrease in sea-level associated with changes in the mass balance of the Antarctic ice sheet is entirely determined by the increase in accumulation. Therefore, because the ECHAM model provided the best estimate of accumulation of the two climate models over that ice sheet, the decrease in the level of the oceans by 5.5 - 6.5 cm by the end of the next century is the main conclusion to retain from these examples.
 |