Instructor
Anastasia Yendiki, Ph.D.
Lab description
The purpose of this lab is to familiarize you with
joint statistical analysis of data that has been collected
from multiple subjects performing the same functional paradigm.
Lab software
We will use NeuroLens
for all fMRI statistical analysis labs.
Lab data
We will use data from the self-reference functional paradigm
that was presented in Lab 1. In this lab we will combine the data
from Subject 7, the one that we have been working on so far,
with the data from Subjects HST1 and HST2, the volunteers that
were scanned during Lab 1.
The data from these three subjects are available under the course directory: /afs/athena.mit.edu/course/other/hst.583/Data2006/selfRefOld/Subject7Sessions7-8-9-13/ /afs/athena.mit.edu/course/other/hst.583/Data2006/Lab1_fMRIAcquisition/SubjectHST1,selfref/ /afs/athena.mit.edu/course/other/hst.583/Data2006/Lab1_fMRIAcquisition/SubjectHST2,selfref/
Here's a reminder of the paradigm structure.
Words are presented in a blocked design.
Each run consists of 4 blocks,
2 with the self-reference condition and
2 with the semantic condition.
The conditions alternate in the ABBA format.
This is the order for the three subjects the we will analyze here:
Subject 7:               Run 1:  A=semantic, B=selfref
                         Run 2:  A=selfref,  B=semantic
                         Run 3:  A=semantic, B=selfref
                         Run 4:  A=semantic, B=selfref

Subjects HST1 and HST2:  Run 1:  A=selfref,  B=semantic
                         Run 2:  A=semantic, B=selfref
                         Run 3:  A=selfref,  B=semantic
                         Run 4:  A=semantic, B=selfref
Words are presented for 3 sec each, grouped in blocks of ten.
Prior to each block the subject views a 2 sec cue
describing their task for the upcoming block.
Each block is followed by 10 sec of a rest condition.
This is the breakdown of a single run:
10 sec   Rest
2 sec    Cue
30 sec   Block A (10 words, each lasts 3 sec)
10 sec   Rest
2 sec    Cue
30 sec   Block B (10 words, each lasts 3 sec)
10 sec   Rest
2 sec    Cue
30 sec   Block B (10 words, each lasts 3 sec)
10 sec   Rest
2 sec    Cue
30 sec   Block A (10 words, each lasts 3 sec)
16 sec   Rest
----------------------------------------
TR = 2 sec
Total run duration = 184 sec (i.e., 92 scans) per run
Lab report
The lab report must include your answers to the questions found
throughout the instructions below.
Due date: 12/8/2006
To perform a group analysis with multiple subjects, we will analyze the data at three levels:
- First we have to perform a first-level analysis on the EPI images from each run of each subject, i.e., a total of 12 first-level analyses. A first-level analysis consists of fitting a linear model to the data of an individual run and saving the estimated effect size and effect standard error to feed to the second-level analysis.
- Then we have to perform a second-level analysis for each subject, i.e., 3 second-level analyses. A second-level analysis combines the outputs of the four first-level analyses from an individual subject's four runs. This produces an overall effect size and effect standard error for each subject, which we will feed to the third-level analysis.
- Finally, we have to perform a third-level analysis, that combines the outputs of the second-level results of the three subjects.
Here's a detailed breakdown of the steps needed at each level:
-
First-level analysis. (For Subject 7, you have already performed the first-level analyses, so you do not need to repeat them.) For each run of each subject, repeat the following:
- Apply motion correction to the EPI images.
- Apply spatial smoothing to the motion-corrected images, using a Gaussian smoothing kernel with a FWHM of 6mm.
- Normalize the intensity of the smoothed images to a mean value of 10000.
- Fit a linear model to the normalized images, using the appropriate design matrix for the specific run/subject you are working on. Use the default HRF shape and set the maximum order of polynomial drift terms to 1 (linear). Save the Effect size and Standard error for effect for a single contrast, that of the self-reference condition vs. the semantic condition.
- Resample the effect size volume and the effect standard error volume onto the space of the standard brain. (For Subject 7, you had to run the registration algorithm to obtain the transformation needed for resampling. For Subjects HST1 and HST2, the transformations are provided for you as /afs/athena.mit.edu/course/other/hst.583/Data2006/Lab1_fMRIAcquisition/*.nlxfm.)
- Save the resampled effect size volume and the resampled effect standard error volume.
-
Second-level analysis. For each subject, repeat the following:
- Make sure that the four resampled effect size volumes and the four resampled effect standard error volumes corresponding to the subject's four runs are open.
- Run the Group Analysis module from one of the resampled effect size volumes. In the Inputs tab, check the resampled effect size volumes of the subject's four runs, and only those. In the Settings tab, set the Analysis type to Pure fixed effects. In the Outputs tab, check -log(p), Effect size, and Standard error for effect.
- Save the -log(p) map, the effect size volume and the effect standard error volume for this subject.
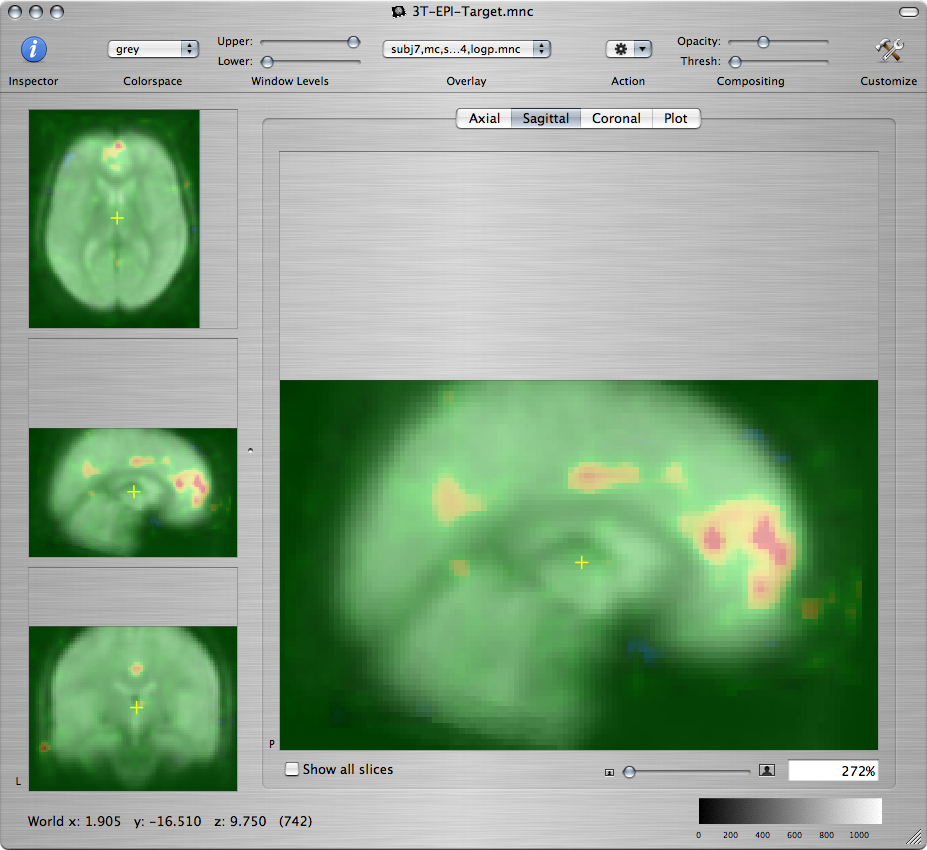
Q: For each of the three subjects, provide a screenshot showing a sagittal view of the self-reference-vs.-semantic -log(p) map on the medial wall, overlaid on the standard brain, as shown below.
Q: Compare the self-reference-vs.-semantic activations of the three subjects, particularly in the three regions of interest from the last question of the previous lab. Discuss the similarities or differences among the three subjects in terms of the statistical significance, location, and spatial extent of those activations.
-
Third-level analysis.
- Make sure that the three effect size volumes and the three effect standard error volumes that were produced by the second-level analyses of the three subjects are open.
-
Start the Group Analysis module from one of
the three second-level effect size volumes.
In the Inputs tab, check the second-level effect size volumes
of the three subjects.
In the Settings tab, set the Analysis type to
Mixed effects and keep the default parameter values.
In the Outputs tab, check -log(p).
Save the resulting -log(p) map.
Q: Provide a screenshot showing a sagittal view of the group self-reference-vs.-semantic -log(p) map on the medial wall, overlaid on the standard brain. Compare the activations that you see on the group -log(p) map to those that you saw in the -log(p) maps of the individual subjects, particularly in the three medial regions of interest.
- Repeat the third-level analysis, this time setting the Analysis type to Pure fixed effects. Save the resulting -log(p) map.
-
You will now compare the statistical maps resulting from
a mixed-effects third-level analysis and a fixed-effects third-level analysis.
Open the three medial-wall ROIs that you used in the previous lab:
- /afs/athena.mit.edu/course/other/hst.583/Data2006/selfRefOld/subj7,std,roi1,lab7iii.mnc
- /afs/athena.mit.edu/course/other/hst.583/Data2006/selfRefOld/subj7,std,roi2,lab7iii.mnc
- /afs/athena.mit.edu/course/other/hst.583/Data2006/selfRefOld/subj7,std,roi3,lab7iii.mnc
Q: Find the maximum -log(p) value within each of these three ROIs, in the -log(p) map of the mixed-effects third-level analysis and in the -log(p) map of the fixed-effects third-level analysis. How do the -log(p) values from the two types of analysis compare? Why? In general, which of the two types of analysis is more appropriate when combining data from multiple subjects?
Type of analysis Max -log(p) ROI1 Max -log(p) ROI2 Max -log(p) ROI3 Mixed effects Fixed effects