
-

Center of Innovation
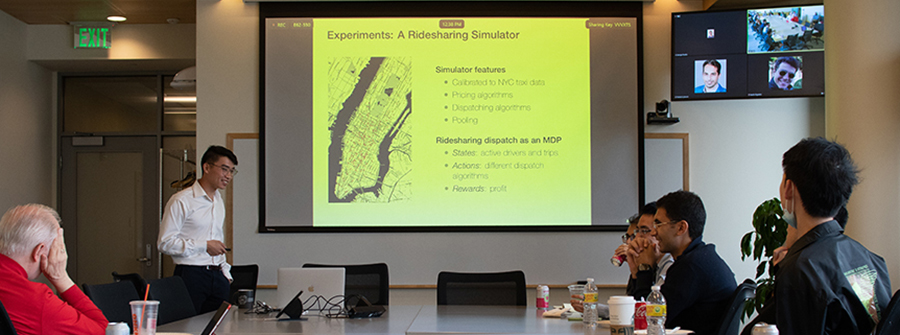
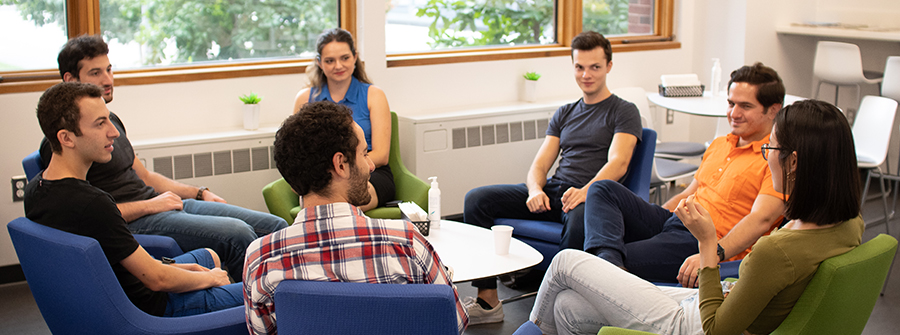
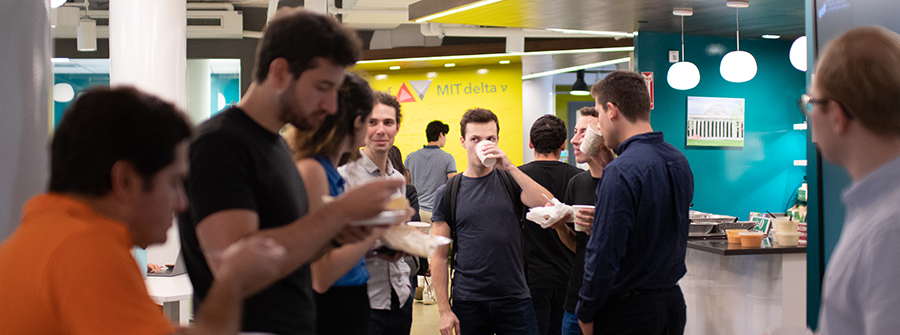
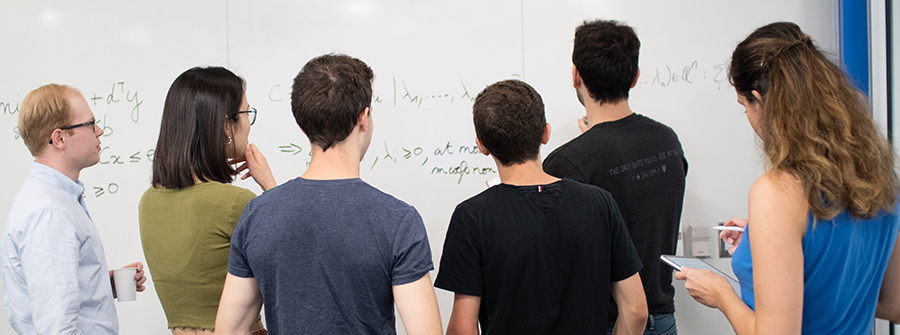
At the MIT ORC, our vibrant community of scholars and researchers work collaboratively to connect data to decisions in order to solve problems effectively—and impact the world positively.


Andy Sun PhD '11
Embracing the future we need
Professor Andy Sun works to improve the electricity grid so it can better use renewable energy.
Read MoreTo build a better AI helper, start by modeling the irrational behavior of humans
To build AI systems that can collaborate effectively with humans, it helps to have a good model of human behavio
Advancing technology for aquaculture
According to the National Oceanic and Atmospheric Administration, aquaculture in the United States represents a

Drop Date
Last day to cancel subjects from spring term Registration
read more