Workshop Proceedings: Short Papers
Multihydrophone localization of low frequency broadband sources
Stephen E. Forsythe
Naval Undersea
Warfare Center, 1176 Howell Ave, Newport RI 02841 USA, forsythese@npt.nuwc.navy.mil
Introduction
To localize high areas of fish activity and adequately characterize fish behavior, it is useful to localize individual fish by their emitted sounds over a range of 10s-100s of meters. In theory, one can use multiple hydrophones distributed in space to localize a source position/direction: using time-of-flight differences among the hydrophones, generate multiple hyperboloids then solve for the surfaces' intersection to give a unique position for the source, perhaps in the least-squares sense. In practice, this is difficult for low frequency signals generated by fish (thumps, etc.) because the onsets of the signals are not well defined. By using cross correlations among the received signals as a "fuzzy" measure of time difference it is possible to do the equivalent of the intersecting hyperboloids calculation with an uncertain measure of time differences, giving the equivalent of a probability density of source location over a predetermined space of a priori possible locations.
The proposed method of tracking should be flexible, easily deployed, and self-calibrating. A useful side benefit of this kind of computerized fish tracking is to provide a record of vocalizations for later processing.
Prior art: conventional beamforming approach
A conventional beamformer coherently adds the outputs of several hydrophones using time delays per hydrophone to emphasize energy arriving from a particular direction (and to suppress energy arriving from other directions).
In general, the spacing among hydrophones must be several times the wavelength of the detected sound to form an accurate estimate of direction; in addition, conventional arrays of hydrophones have ambiguity in locating a sound source (e.g., the angular ambiguity around a line array).
Alternative: Position estimates from time differences among hydrophone pairs
An alternative to beamforming is to use a "loose" array of hydrophones with an irregular geometry to perform the localization. In this method, hydrophones are used in pairs. For each pair, correlated pulses of sound arriving with a time difference D t between hydrophones correspond to a single source whose position lies on a hyperboloid with the hydrophone pair at the foci. Using several pairs of hydrophones reduces the problem of location to finding the intersection (possibly in the least squares sense) of several hyperboloids. The problem with this method is that uncertainty in the required D t produces an uncertain estimate of the hyperboloids’ intersections. This uncertainty is relatively small for high frequency clicks, but is greater at low frequencies or for narrowband signals like thumps and whistles.
To overcome the effects of uncertainty, it is useful to keep the estimates of D t "fuzzy" by replacing the number D by a probability distribution around the most likely D t. The use of statistics derived from the cross correlation functions between pairs of hydrophones does exactly this. Data from multiple hydrophone pairs can be fused into a single coherent picture by combining statistics from several hydrophone pairs in a manner to multiplying probabilities of independent events to obtain the probability of all events occurring simultaneously.
Position estimation experiment
To test the effectiveness of the localization technique, 5 hydrophones were deployed in a lake. The hydrophones were arranged as vertices of an inverted square pyramid 1 meter on a side with the apex 1 meter below the base.
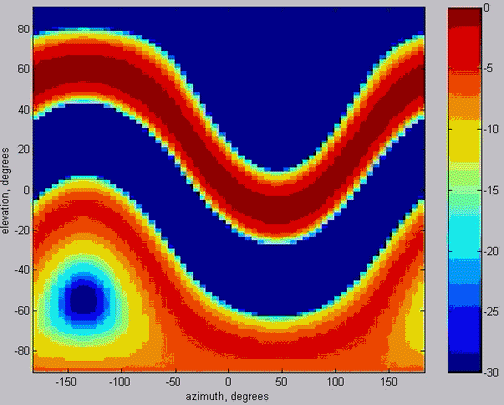
Figure 1 below shows the "fuzzy" surface (mapped as a Mercator projection using elevation from the horizontal plane and "longitude" around the equator) formed from magnitude of the cross correlation function of a cusk-eel sound as measured by a pair of hydrophones in the array. The dark red areas are the most likely positions of the source as measured by the magnitude of the cross correlation of the two hydrophones’ signals.
 |
|
Figure 1 — magnitude of the broadband cross correlation (dB relative to max) for 2 hydrophones (apex and 1 base) |
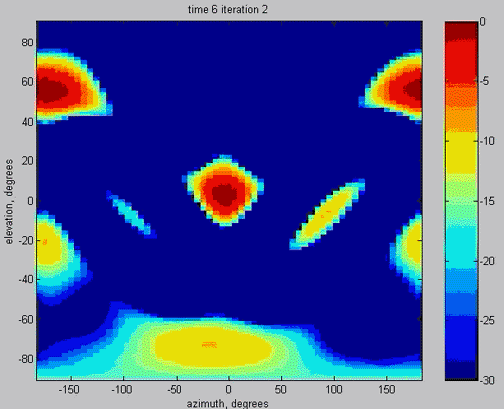
Figure 2 represents the product of the first two cross correlation magnitudes.
 |
|
Figure 2 — product of correlation magnitudes for the first 2 hydrophone pairs |
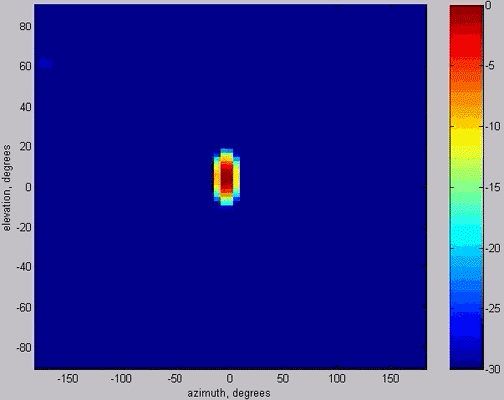
The improvement using just two pairs is dramatic. Finally, figure 3 below shows the results of including all hydrophone pairs in the product.
 |
|
Figure 3 — product of magnitudes of all hydrophone pairs |
The final result virtually localizes the source.
Discussion
The technique described above performs well in a low-noise environment. By simulation, several potential sources of error were modeled using the acoustic data gathered in the original experiment. The error sources considered were
- Uncertainty in hydrophone positions (contaminates all measurements);
- Uncertainty in signal arrival times;
- Signals at hydrophones not exact copies of source (directivity of source);
- Reverberation (images of the signal from boundaries);
- Ambient noise;
- Overlapping signals from multiple sources.
Of the 6 sources of error, the most damaging were numbers 4 and 6. Because the estimation process used has a nonlinear component (product of magnitudes), multiple signals received simultaneously from the same type of fish generate multiple cross correlation peaks. These in turn generate spurious product terms when multiplied together to form the final estimate. The minimization of this effect is the subject of future research.