Workshop Proceedings: Short Papers
|
Quantifying Species-Specific Contributions to the Overall Sound Level Mark W. Sprague1 and Joseph J. Luczkovich2 (1) Dept. of Physics, East Carolina University, Greenville, NC 27858, USA spraguem@mail.ecu.edu (2) Inst. for Coastal and Marine Resources and Dept.
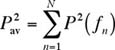
of Biology, East Carolina University, Greenville, NC 27858, USA Introduction Many fishes are soniferous (sound-producing) and produce species-specific sounds (Fish and Mowbray 1970, Sprague et al. 2000). The sound production of an individual fish or group of fishes can be used to determine their presence in an area and as an indication of courtship and spawning behavior. Often, we would like to quantify the sound production of a particular individual or species, but how do we separate that sound from other sounds that are simultaneously produced by biological sources, wave noise, and anthropogenic sources such as boats and ships? A short answer to this question is to use a portion of the sound in which the desired source dominates over all others. This portion could be a time segment in which the desired source is much louder than the background (i.e., all other sounds), a portion of the frequency spectrum in which the desired source is much louder than the background, or a combination of these techniques. Separating and Combining Sounds Parseval’s Theorem tells us that the squared-pressure
of each frequency component P2 (ƒn)
contributes additively to the time-averaged overall squared-pressure
. In other words, each frequency component in a power
spectrum or sonogram makes an additive contribution to the total sound
power because sound power is proportional to the squared-pressure. Also,
when sounds are mutually incoherent (i.e., originating from sources
not correlated in time), their time-averaged squared-pressures, . Equation (2) applies to most fish and background sounds because most naturally-occurring sounds are incoherent. The total sound pressure level (SPL) is also
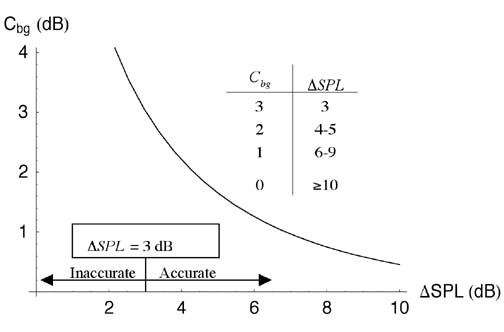
calculated from where P0 is the reference pressure (1 m Pa for underwater acoustics). To combine two mutually incoherent sounds with SPLs SPL1and SPL2, we must convert each SPL to a squared-pressure using the inverse of Equation (3) before adding them. The combined SPL is Equation (4) can be used to combine or separate the SPLs of various sources, including fish sounds and the background. Background Correction Function Cbg Pierce (1989) developed a background correction function Cbg, based on Equation (4), to determine the sound pressure level of a source SPL1 when background noise is present: In Equation (5), DSPL is the difference between the source and background SPLs and SPLtot is the total sound pressure level. The Cbgtechnique is inaccurate when DSPL< 3 dB because small inaccuracies in the measurement of SPLtot lead to large inaccuracies in SPL1. Figure 1 shows a plot of Cbg vs. DSPL. When a sound is 10 dB or more above the background, the total SPL is the same as the SPL of the sound (i.e., DSPL is zero).
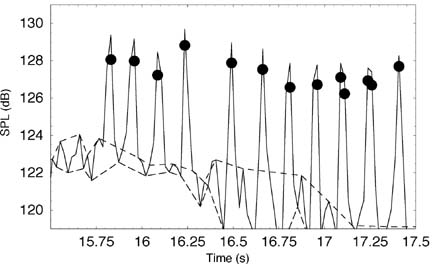
Figure 1. The background correction function Cbg vs. the difference between the source and background sound pressure levelsDSPL . The inset table gives Cbg - values to the nearest decibel. The background correction function is inaccurate for DSPL < 3 dB. (Pierce, 1989) In order to determine the source SPL using Cbg, the total SPL and the background SPL must be measured. Using the Background Correction Factor to Determine Silver Perch SPL We recorded an individual silver perch Bairdiella chrysoura in Wallace Channel, NC, USA using a hydrophone and video camera attached to a remote operated vehicle (ROV) placed on the sea floor in 10 m of water. The video confirmed that the fish made sound as it swam close to the hydrophone. A spectrogram of the recording is shown in Luczkovich and Sprague (2002). We estimated the background SPL by measuring the sound levels between the pulses in the silver perch call and determined the silver perch SPL by subtracting Cbg from the total SPL during the pulses. The sound was sampled at 24 kHz, and we computed SPLs from the time-averaged squared-pressure in 1024-point Hanning windows. Each consecutive window overlapped the previous window by 512 sample points to insure that each sample point occurred near the center of at least one sample window. The peaks of the background SPL were interpolated to give an upper estimate of the background SPL, and the valleys were interpolated to give a lower estimate. Figure 2 shows an interpolated plot of the total and the maximum and minimum background SPL as well as the silver perch SPL. The maximum silver perch SPL was 129 dB (using either the maximum or minimum background SPL).
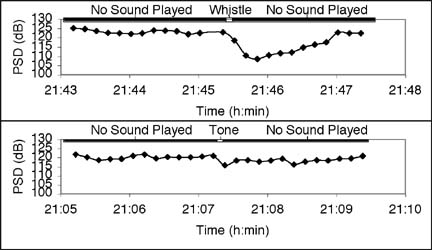
Figure 2. Sound pressure levels (SPLs) in a silver perch sound recording at Wallace Channel, NC, USA. The solid line is the total SPL, the upper dashed line the maximum background SPL, the lower dashed line the minimum background SPL, and the dots the silver perch SPL calculated using the background correction factor Cbg. Spectral Analysis of Sounds and Sciaenid Egg Identification We have established a correlation between sound levels produced by Sciaenid fishes and the presence of fertilized sciaenid-type eggs in Pamlico Sound (Luczkovich et al. 1999, Luczkovich and Sprague 2002). We conducted planktonic egg surveys at suspected weakfish Cynoscion regalis and silver perch spawning sites using 28-cm diameter bongo net with 500 mm mesh towed at the surface for 5 min to capture the buoyant eggs. We recorded the drumming sounds at the same location before and after the tow and compared the species-specific power spectral density (PSD) in a 10-s average power spectrum to the measured egg density. The weakfish PSD was taken as the sum of the PSDs in the power spectrum from 304—375 Hz and the silver perch PSD the sum the PSDs from 984—1078 Hz (Sprague et al. 2000). We assumed, based on our mtDNA RFLP analysis of sciaenid-type eggs and the results of Daniel and Graves (1993), that eggs less than 0.8 mm were those of silver perch and those greater than 0.85 mm were those of weakfish. The regression relationships of egg density vs. species-specific PSD, after log-transforming, are nearly linear in both cases with an R2 of 0.38 for weakfish and 0.44 for silver perch. The large variations in the data could be the result of errors associated with the egg sampling technique. We believe that in many cases our egg sample nets did not capture nearby eggs due to variations in currents, patchiness in the egg distribution, and perhaps in the buoyancy of the eggs (due to salinity fluctuations). Despite the variations, these data are significant and provide the basis for predicting the egg production for each of these species from sound levels in the future. Silver Perch Acoustic Avoidance of Bottlenose Dolphins During our study of sciaenid spawning areas, we noticed that silver perch aggregations would suddenly become quiet when we heard bottlenose dolphin Tursiops truncatus signature whistles. To verify our observations, we played a recording of bottlenose dolphin signature whistles (with frequency content 4—8 kHz) at similar source levels to those produced by bottlenose dolphins near a silver perch aggregation and found that the signature whistles significantly quieted the silver perch vocalizations (Luczkovich et al. 2000). We also played a 700-Hz tone at the same source level with no significant effect on the silver perch.
Figure 3. Examples of silver perch species-specific PSD fluctuations upon playback of a bottlenose dolphin signature whistle (above) and a 700-Hz tone (below) at the same source level. We determined the silver perch PSD by summing the PSDs in the power spectrum for frequency components from 950—1200Hz, the frequency range where silver perch are dominant, for consecutive 10-s average power spectra (see Figure 3). To determine the silver perch reaction to the playback, we took the difference between the measured the silver perch PSD immediately before playback and during the interval between 20—30 s after playback. Using an analysis of covariance (ANCOVA), we compared the decrease in silver perch PSD after playback of bottlenose dolphin whistles to changes in silver perch PSD after the 700-Hz tones and also to spontaneous PSD changes before and 20—30 s after an ad-hoc selected time in a 120-s recording of silver perch with no sound playback. The bottlenose dolphin whistle produced a significant 9-dB decrease in silver perch SPL [ANCOVA, P = 0.000001 (among playback treatment adjusted means), P = 0.13 (among slopes of the regression lines for each treatment), R2 = 0.81, n=54]. The silver perch responded to bottlenose dolphin signature whistles by reducing their sound production. Conclusions Several techniques have been demonstrated for determining the sound level of an individual or species in the presence of other sound sources. Each technique isolates a portion of the sound in which the desired source dominates over the others. The sound portion could be a time interval in which the desired source is much louder than the others or it could be a portion of the frequency spectrum in which the desired source dominates. In some situations, techniques that combine time intervals and characteristic frequency bands must be used to separate the contributions of the desired source. References Daniel, L. B. and Graves. J. E. (1994) Morphometric and genetic identification of eggs of spring-spawning sciaenids in lower Chesapeake Bay. Fish. Bull. 92, 254-261. Fish, M. P. and W. H. Mowbray. (1970) Sounds of Western North Atlantic Fishes. Johns Hopkins Press, Baltimore, 209 pp. Luczkovich, J. J., M. W. Sprague, S. E. Johnson, and R. C. Pullinger. (1999) Delimiting spawning areas of weakfish, Cynoscion regalis (Family Sciaenidae) in Pamlico Sound, North Carolina using passive hydroacoustic surveys. Bioacoustics 10, 143-160. Luczkovich, J. J., H. J. Daniel III, M. Hutchinson, T. Jenkins, S. E. Johnson, R. C. Pullinger, and M. W. Sprague. (2000) Sounds of sex and death in the sea: bottlenose dolphin whistles silence mating choruses of silver perch. Bioacoustics 11, 323-334. Luczkovich, J. J. and M. W. Sprague. (2002) Using Passive Acoustics to Monitor Spawning of Fishes in the Drum Family (Sciaenidae). Proceedings of an International Workshop on the Application of Passive Acoustics in Fisheries. Held April 8-10, 2002, Massachusetts Institute of Technology Sea Grant Publication. http://web.mit.edu/seagrant/acoustics/exsum/hawkins/luczkovich_extended.html Pierce, A. D. (1989) Acoustics an introduction to its physical principals and applications. Acoustical Society of America, Woodbury, NY, pp. 54-78. Sprague, M. W., J. J. Luczkovich, R. C. Pullinger, S. E. Johnson, T. Jenkins, and H. J. Daniel III. (2000) Using spectral analysis to identify drumming sounds of some North Carolina fishes in the family Sciaenidae. Journal of the Elisha Mitchell Society 116, 124-145.
|
 (1)
(1) and
and  add to
give the squared-pressure of the combined sound,
add to
give the squared-pressure of the combined sound, (2)
(2) (3)
(3) (5)
(5)