Workshop Proceedings: Short Papers
|
Classifying
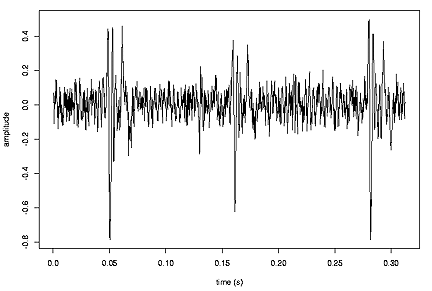
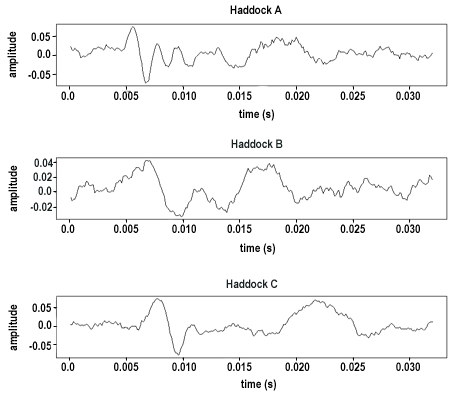
Fish Sounds Using Wavelets Introduction Many species of marine fish emit low frequency sounds composed of sequences of nearly identical transient units. The production of these sounds is often coupled with displays of aggression and/or courtship. In order to associate sound production with fish behaviour we need to be able to distinguish between the sounds of different species and between individual fish to be able to identify which fish is emitting sound at any given time. Wavelets have been used to produce features of the waveforms which are then used to discriminate between the sounds from different fish. We consider the performance of this method for discriminating between individual haddock, Melanogrammus aeglefinus, and for discriminating between sounds from three fish species, the haddock, cod Gadus morhua, and pollack Pollachius pollachius. Data Recordings of the haddock were made at the FRS Marine Laboratory, Aberdeen in a semi-annular tank (90m3) containing 3 male and 5 female fish. The sounds were detected by a broad-band hydrophone, amplified and sampled at a frequency of 8 kHz. The haddock were maintained under controlled conditions, and recordings were made over two spawning seasons (February-April, 1999 and 2000). Haddock sounds consisted of long trains of regularly repeated ‘knocks’. Figure 1 shows a typical recording consisting of a series of regularly spaced low frequency sound units, or knocks. Figure 2 shows the different waveforms of the 3 male haddock. The haddock varied their sound by repeating these knocks at different rates.
The cod sounds were recorded in the aquarium of the FRS Marine Laboratory and consisted of long grunts, produced singly or in groups of up to 5. The pollack sounds were recorded in the sea at a depth of 15m in Loch Torridon, Wester Ross, from a cage of fish, and consisted of short repeated grunts. The sounds of all three species are described by Hawkins and Rasmussen (1978).
Wavelets Wavelets are special mathematical functions, designed to overcome the shortfalls of the well known Fourier Transform. Wavelets are produced by scaling (compressing or expanding) and shifting a single ‘mother’ wavelet along the time axis. These wavelets are usually designed to form an orthonormal basis, in which any sound signal may be represented as a series of the scaled and shifted wavelets. The ‘amount’ of each wavelet present in the decomposition determines the dominant frequency components and their location in the signal. For this reason we say that the wavelet transform has good time and frequency localization. Background material on wavelet analysis may be found in Jawerth and Sweldens (1994), Bruce and Gao (1996) and Abramovich et al. (2000). A more mathematical treatment is given by Chui (1992a,b) and Daubechies (1992).
Recognition of Individual Haddock Wavelets were used to extract features from the sound units which would enable individual haddock or different species to be automatically recognised. The procedure consisted of 4 steps.
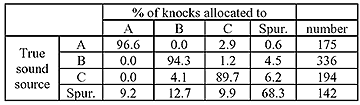
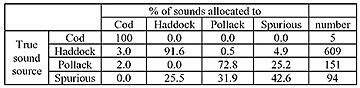
Results and Conclusions In a test data set of the haddock sounds, 175 knocks were detected as having come from fish A, 336 from B, 194 from C and 142 were spurious sounds. The classification rates are shown in table 1. The overall success rate was 89%. It was shown that using the fact that knocks occurred in long repetitive series increased the success rate to 95%. For the allocation of sounds to different species, 5 sounds were detected as having come from cod, 609 from haddock, 151 from pollack and 94 of the sounds were spurious. The classification rates are shown in table 2. The overall success rate achieved was 83%.
Wavelets provide a useful method of automatic sound recognition. The methods described above can count and assign a large number of sounds far more quickly than can be done by eye. This technique has the potential to separate fish sounds from ambient noise in the sea, and may provide a non-invasive method for locating spawning fish. Acknowledgements We thank Professors I.T. Jolliffe and A.D. Hawkins, University of Aberdeen, and Dr G. Horgan, Biomathematics and Statistics Scotland, for their supervision and input. We thank Licia Casaretto, FRS Marine Laboratory, for recording the haddock sounds, and Professor A.D. Hawkins for supplying the cod and pollack recordings. We acknowledge the financial support provided by the sponsors of the International Workshop on the Application of Passive Acoustics in Fisheries, Dedham, Boston MA. References Abramovich, F., Bailey, T.C. and Sapatinas, T. (2000) Wavelet analysis and its statistical applications, Journal of the Royal Statistical Society, Series D, 49(1), 1-29. Bruce, A. and Gao, Hong-Ye (1996) Applied wavelet analysis with S-PLUS, Springer-Verlag, New York. Chui, C.K. (1992a) An introduction to wavelets, Academic Press, Boston, MA. Chui, C.K. (1992b) Wavelets: a tutorial in theory and applications, Academic Press, Boston, MA. Daubechies, I (1992) Ten lectures on wavelets, Society for Industrial and Applied Mathematics, Philadelphia. Jawerth, B. and Sweldens, W. (1994) An overview of wavelet based multiresolution analyses, Society for Industrial and Applied Mathematics, 36(3), 377-412. Krazanowski, W.J. (1996) Principles of multivariate analysis: A users perspective, Oxford University Press, Oxford. Hawkins, A.D. and Rasmussen, K.J. (1978) The calls of gadoid fish, Journal of the Marine Biology Association U.K., 58, 881-911.
|