![[go to the Space Plasma Group home page]](http://web.mit.edu/space/www/nav_images/space_group_temp3.gif)
![[go to User Specified Plotting page]](http://web.mit.edu/space/www/nav_images/user_spec_helv20.gif)
![[go to Recent Publications page]](http://web.mit.edu/space/www/nav_images/recent_pubs_helv20.gif)
![[go to Model Animations page]](http://web.mit.edu/space/www/nav_images/model_anim_helv20.gif)
![[go to IMP 8 page]](http://web.mit.edu/space/www/nav_images/imp8_helv20.gif)
![[go to VOYAGER page]](http://web.mit.edu/space/www/nav_images/voyager_helv20.gif)
![[go to WIND page]](http://web.mit.edu/space/www/nav_images/wind_swe_helv20.gif)
![[go to CSR page]](http://web.mit.edu/space/www/nav_images/csr_helv20.gif)
![[go to MIT page]](http://web.mit.edu/space/www/nav_images/mit_temp5.gif)
|
|
MIT Space Plasma Group
WIND-SWE Instruments Page |
![[rainbow line]](http://web.mit.edu/afs/athena/org/s/space/www/rainbow_line.gif)
Table of Contents:
WIND-SWE Instruments
SWE - Vector Electron Ion Spectrometer |
SWE - Faraday Cup |
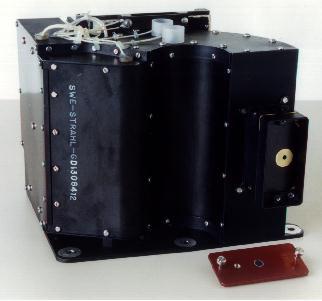
SWE - Strahl Detector |
|
Faraday Cup Diagram
![[wind_FC_diagram.gif]](http://web.mit.edu/afs/athena/org/s/space/www/wind/wind_figures/wind_FC_diagram.gif)
Figure Caption: How a Faraday Cup works. We show here a schematic cross section of a typical Faraday Cup sensor. It contains a series of wire-mesh, planar grids knitted from tungsten wire and one or more collector plates. The velocity distribution function of ions is measured by applying a sequence of voltages to the "modulator" grid. With voltage V applied to the grid, only particles having energy/charge, E/Q, greater than V will be able to pass through the grid and continue on to strike the collector plate where they produce a measurable current. As normally operated, the grid voltage is varied between two voltages, V1 and V2 at a frequency of a few hundred Hz. Thus particles normally incident on the grid and having E/Q between V1 and V2, will produce a current on the collector plate that varies at the modulation frequency and can easily be detected with an appropriate phase-sensitive measurement system. By choosing an increasing sequence of values for the modulation voltage, e.g. V2 and V3, the E/Q spectrum of the particles can be explored.
Example of a Solar Wind Ion Spectrum
![[wind_wind_ex_spec.gif]](http://web.mit.edu/afs/athena/org/s/space/www/wind/wind_figures/wind_ex_spec.gif)
Figure Caption: Nine panels are shown, each displaying a plot of measured current versus energy-per-charge (plotted as energy channel number). Each panel represents the energy-per-charge spectrum measured at a particular spacecraft azimuth angle (or rotation angle) relative to the sun-spacecraft line. The largest peak in the current is due to solar wind protons, while a second peak occurring at higher energy is associated with solar wind alpha particles. Plasma parameters are derived from these data by fitting the measured currents to currents calculated by convolving model distribution functions with the sensor response.
The Strahl Detector
The WIND Solar Wind Experiment (SWE) includes a sensor especially configured to measure the solar wind strahl, the narrow beam of electrons which travel outward from the Sun closely aligned with the interplanetary magnetic field. The strahl is believed to be a remnant of electron velocity distributions in the solar corona and therefore is of considerable interest. During one 3s rotation of the spacecraft, the strahl sensor makes high angular resolution measurements of the electron velocity distribution within a field of view 50 degrees by 50 degrees centered on the average magnetic field direction looking toward the Sun, and one-half rotation later, measurements are made along the average field direction looking away from the Sun. SWE is therefore able to make nearly continuous measurements of the strahl and of any "anti- strahl" at lAU.
Detailed velocity distribution measurements show that the strahl manifests itself at energies above the thermal core as a field-aligned anisotropy skewed away from the sun. The strahl angular width, defined as the width in pitch angle at half maximum, varies from 20 degrees at 100 eV to 10 degrees at 500 eV, approximately. When compared with the interplanetary magnetic sector and corotating stream structure, the strahl electron velocity distributions are found to be most anisotropic during high speed streams with the most intense strahl occurring during the rising portion of the stream velocity profile. The peak in the flux of electrons coming from the anti- strahl direction, while only a fraction of the strahl flux, is time coincident with the strahl, suggesting possible Coulomb or other scattering effects.
For More Information
You are most welcome to contact:
Dr. Keith W. Ogilvie, Keith.W.Ogilvie@nasa.gov, 301-286-5904,
Dr. John D. Richardson, jdr@space.mit.edu, 617-253-6112,
Use this form for email comments.
|
|
|
|
|
|
|
|
| MIT |
MIT Center for
Space Research |
MIT Space Plasma Group | Recent Publications |
|---|