
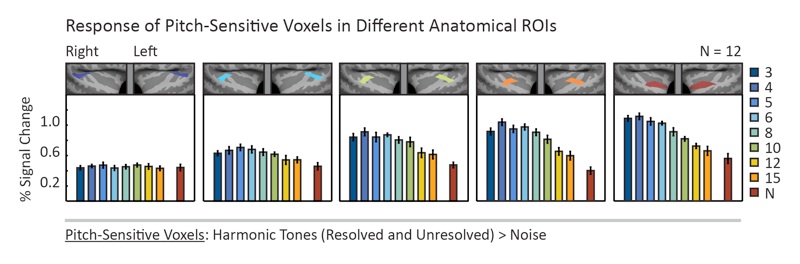
From each ROI, we selected the 10% of voxels that with the most significant response preference for harmonic tones compared with noise. The figure plots the response of these voxels, measured in independent data, to all of the harmonic and noise condition, collapsing across the two frequency ranges tested (as in Figure 3B). The 4 most anterior ROIs contained voxels with a replicable pitch response, responding more to tones than noise in left-out data. The most posterior ROI contained no replicable pitch responses, even though it contained an equal number of sound-responsive voxels (see Figures 4D-F). All ROIs with a replicable pitch response also responded more to low-numbered resolved harmonics.