-
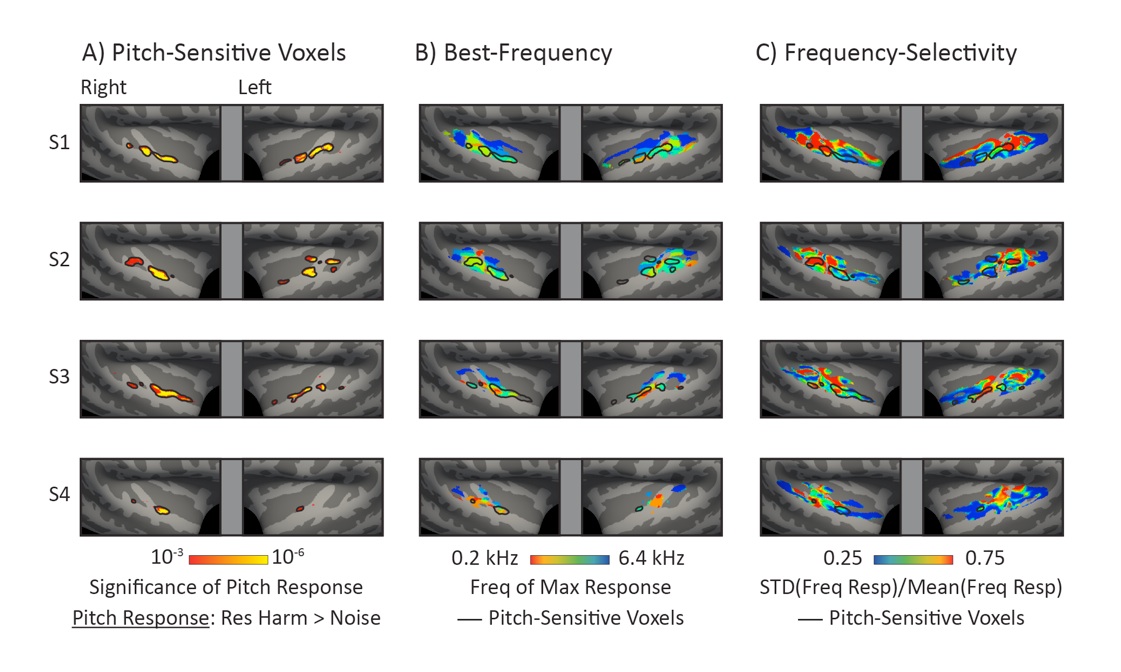
(A) Pitch-sensitive voxels in four individual participants who participated in a follow-up scan to more robustly measure pitch sensitivity and tonotopy in their individual brain.
-
(B) Best-frequency maps for each participant with an outline of pitch-sensitive voxels overlaid. As in the group analysis (Figure 6B), pitch-sensitive voxels overlapped with low- but not high-frequency regions of primary auditory cortex. The color of each voxel corresponds the to the octave frequency range that produced the maximum response (the six frequency ranges tested had center frequencies corresponding to 0.2, 0.4, 0.8, 1.6, 3.2, and 6.4 kHz).
-
(C) Maps of frequency-selectivity for each individual participant with pitch-sensitive voxels overlaid. As in the group analysis (Figure 6D), pitch-sensitive voxels overlapped with a highly frequency-selective region of primary auditory cortex and a less frequency-selective region, anterior to primary auditory cortex.