
-
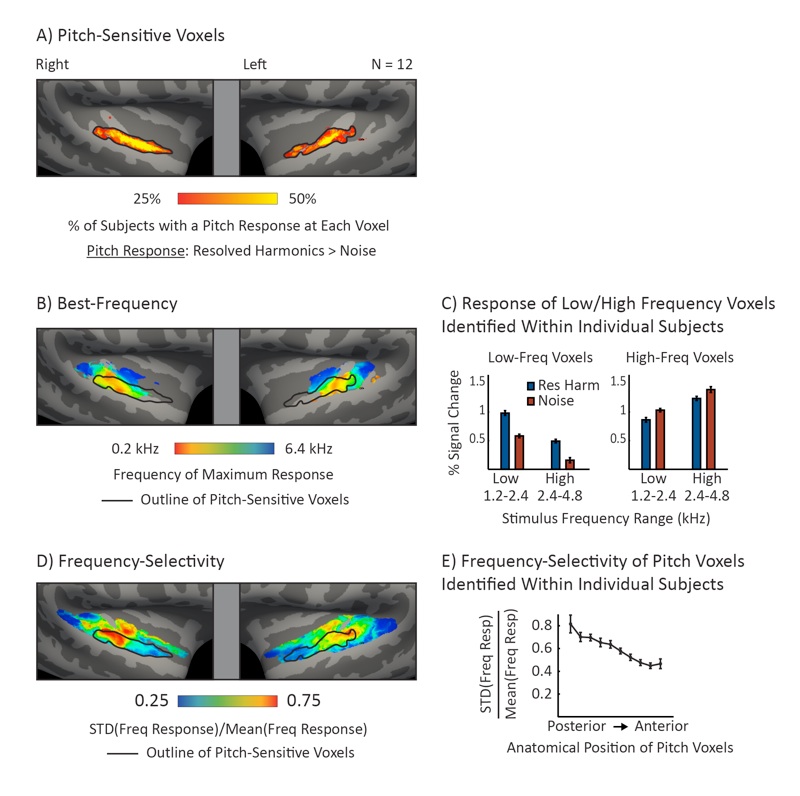
(A) Summary map indicating the percentage of subjects who exhibited a pitch response at each surface voxel. Pitch-sensitive voxels were localized to the anterior half of auditory cortex (consistent with our anatomical ROI analyses, see Figure 4).
-
(B) Best-frequency map showing the preferred frequency of each surface voxel averaged across subjects (measured using pure tones). An outline of pitch-sensitive voxels is overlaid for comparison. Pitch-sensitive voxels overlapped with low, but not high-frequency regions of the tonotopic map. The tonotopy stimuli can be downloaded here.
-
(C) The response of low-frequency-preferring (left) and high-frequency-preferring (right) voxels (identified within individual subjects using pure tones) to low- and high-frequency-resolved harmonics (blue) and noise (red). Low-frequency voxels responded more to resolved harmonics, while high-frequency voxels responded slightly more to the noise stimuli.
-
(D) Map of frequency selectivity indicating the degree to which a voxel responded differently to pure tones of different frequencies. Pitch-sensitive voxels overlapped with a frequency-selective region of primary auditory cortex (selective for low frequencies), and a less frequency-selective region anterior to primary auditory cortex.
-
(E) Pitch-sensitive voxels were identified within individual subjects and sorted based on their posterior-to-anterior position (see Methods for details). Consistent with the group analysis (panel D), more anterior pitch voxels were less frequency-selective.