Download all of the tonotopy stimuli.
The stimulus set consists of sequences of pure tones belonging to one of 6 different frequency ranges (similar to Humphries et al., 2010). An example stimulus for each of the 6 frequency ranges is given below:
These stimuli are intended to be used in a simple, block design (see Figure 2B of our paper for a schematic), as opposed to doing phase-mapping (Da Costa et al., 2011). The benefit of this approach is that you can directly measure response magnitudes to each frequency range. Low- and high-frequency-selective regions can be localized with a direct contrast (i.e., 200 + 400 + 800 Hz vs. 1600 + 3200 + 6400 Hz). Best-frequency maps can be computed by assigning each voxel to the frequency that produced the maximum response (as in Figures 6B and 7B of our paper). Maps of frequency-selectivity can be computed by measuring the degree of response variation across the 6 frequency ranges (as in Figures 6D and 7C of our paper).
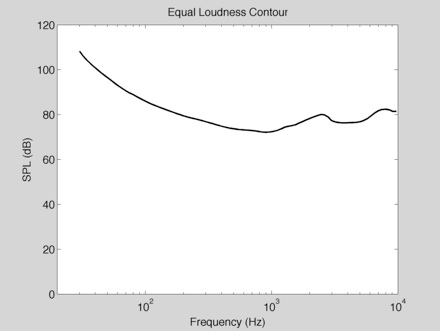
All of the stimuli vary in frequency at a fast rate, because we have found in pilot experiments that such stimuli produce a larger response in tonotopic regions. The tones are also designed to have approximately equal loudness (Glasberg and Moore, 2006). The equal-loudness contour used to generate the stimuli is plotted below. To be fully faithful to the loudness model, tones at 1 kHz should be presented at approximately 72 dB SPL, corresponding to a level of 8 sones.
References
Da Costa S, van der Zwaag W, Marques JP, Frackowiak RS, Clarke S, Saenz M (2011) Human primary auditory cortex follows the shape of Heschl’s gyrus. J Neurosci 31.
Glasberg BR, Moore BC (2006) Prediction of absolute thresholds and equal-loudness contours using a modified loudness model. J Acoust Soc Am.
Humphries C, Liebenthal E, Binder JR (2010) Tonotopic organization of human auditory cortex. NeuroImage.